Where are Americans happiest?

Canva
Where are Americans happiest?
A person stretching at the water’s edge at sunset.
Research shows that in some cases, money does lead to happiness. In fact, a 2021 University of Pennsylvania study found a correlation between happiness and income growth, even past an annual income of $80,000. This is in contrast to previous research that found happiness stagnated after an individual earned $75,000. However, not all places can offer the same level of happiness, as some cities offer more economic opportunities and a better quality of life than others.
To uncover the happiest places in America, SmartAsset analyzed the 200 largest cities, 164 of which had available data. This analysis looked at 13 different metrics across three categories: personal finance, well-being and quality of life. For details on our data sources and how SmartAsset put all the information together to create final rankings, read the Data and Methodology section below.
Key Findings
- California cities dominate the top 10. While cities like Sunnyvale and Fremont offer the No. 1 and No. 3 highest earnings for individuals, these Western cities score highest in the quality of life category. Specifically, top 10 California cities had lower percentages of people living in poverty, higher marriage rates and lower violent crime rates.
- Birmingham is the least happy city. This Alabama city ranks in the bottom five across metrics such as personal bankruptcy filings per capita, life expectancy and the percentage of residents living in poverty. Newark, New Jersey and Memphis, Tennessee follow as the second- and third-least happy cities.
- Top 10 cities have high marriage rates. Residents who’ve said “I do” make up the majority of the population in all but one city: Arlington, Virginia, where the marriage rate is 44.0%. Frisco, Texas, which ranks No. 5 overall, has the highest marriage rate study-wide (62.6%).
Top 10 cities have high marriage rates. Residents who’ve said “I do” make up the majority of the population in all but one city: Arlington, Virginia, where the marriage rate is 44.0%. Frisco, Texas, which ranks No. 5 overall, has the highest marriage rate study-wide (62.6%).
![]()
SmartAsset
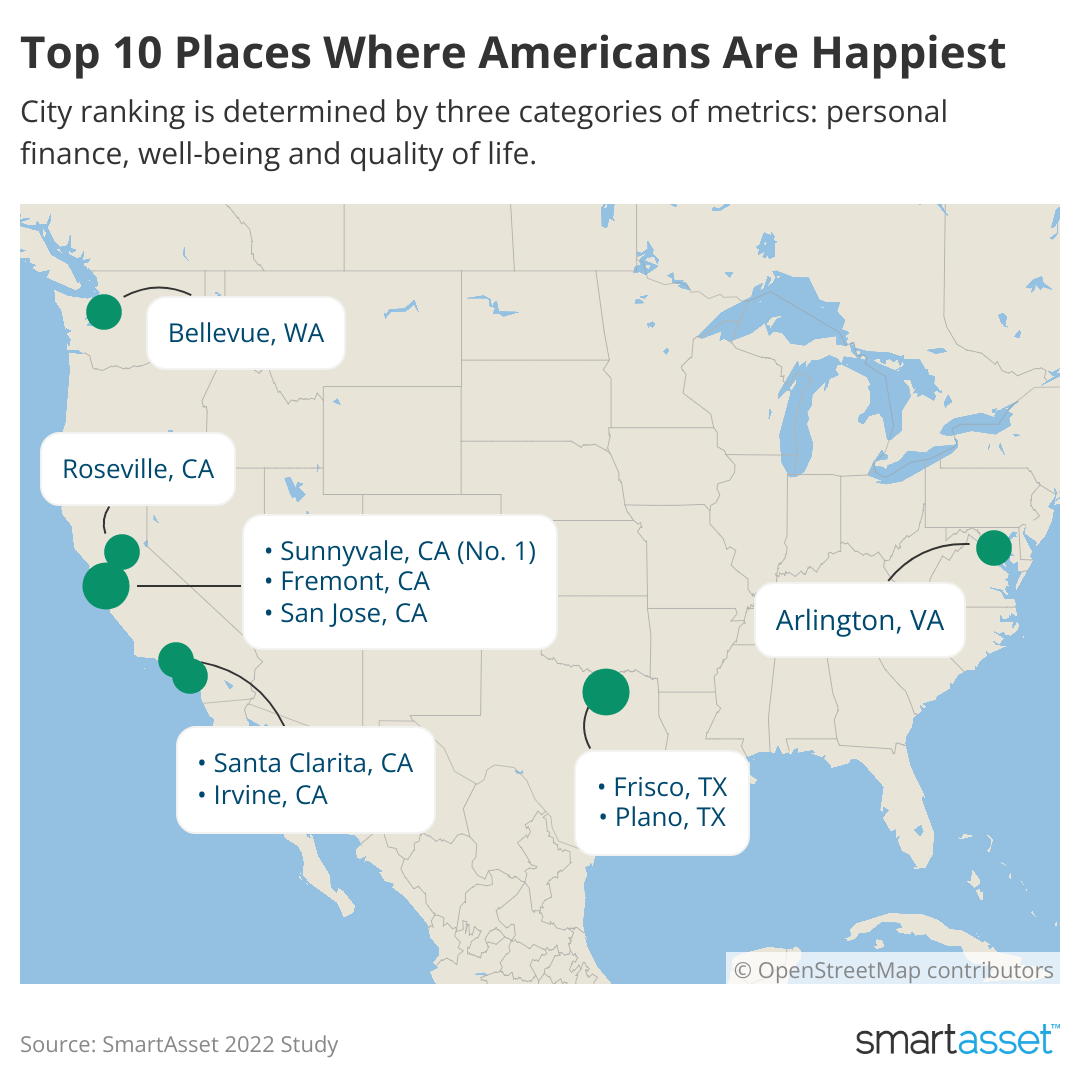
The Top 10 Happiest Cities Score High For Well-Being And Financial Stability
A map of the United States showing the ten happiest cities.
1. Sunnyvale, CA
Well-being and quality of life is where Sunnyvale, California ranks best. The city has the highest percentage of individuals earning $100,000 or more (62.5%), the third-lowest percentage of adults living below the poverty level (roughly 5%) and the fifth-highest marriage rate (56.8%). Violent crime in the area is also low (No. 9) with roughly 149 violent crimes per 100,000 residents.
2. Arlington, VA
While Arlington, Virginia ranks in the top seven across all three categories measured (personal finances, well-being and quality of life), the city ranks highest in the former. Specifically, roughly 48% of Arlington’s residents earn $100,000 or more (No. 5). Additionally, living costs make up less than 35% of the median household income (No. 6). The county in which Arlington is located also has the lowest amount of personal bankruptcy filings.
3. Bellevue, WA
Bellevue, Washington scores highest in the quality of life category but also does well for resident personal finances. Specifically, roughly 61% of Bellevue’s residents earn $100,000 or more (No. 2) and less than 8% of the population lives below the poverty line (No. 8). Additionally, cost of living as a percent of income is the lowest across the study (28.69%).
4. Fremont, CA
Fremont, California ranks No. 3 for both its high percentage of individuals earning $100,000 or more (55.4%) and its low living costs relative to income (32.17%). The city also ranks No. 2 for both the percentage of adults who live below the poverty level (4.9%) and its marriage rate (61.6%).
5. Frisco, TX
Frisco, Texas takes both the No. 1 spots for the marriage rate (62.6%) and the percentage of residents living below the poverty level (2.5%). Additionally, the city ranks No. 2 for its typical living costs compared to the median household income (29.55%) and its violent crime rate (roughly 86 crimes per 100,000 residents).
6. Plano, TX
Plano, Texas ranks in the top 20 across six metrics, most notably: the city has the fourth-highest marriage rate (56.9%) and the 10th-lowest violent crime rate (roughly 155 for every 100,000 residents). Just over a third of the Plano population earns $100,000 or more and typical cost of living expenses make up 40.43% of the median household income in the city.
7. Roseville, CA
Living costs in Roseville, California are the fifth-lowest across the study making up about a third of the median household income annually. Just over 38% of the city’s population earn $100,000 or more (13th-highest) and less than 6% live below the poverty level (fourth-lowest). The county in which Roseville is located also has the 15th-lowest number of personal bankruptcy filings study-wide.
8. San Jose, CA
Roughly 43% of San Jose, California residents earn $100,000 or more (10th-highest) and less than 7.4% live in poverty (eighth-lowest). Additionally, Santa Clara County – where San Jose is located – takes the No. 2 spot for both the percentage of residents reporting poor mental health days (10%) and life expectancy (84.7 years).
9. Santa Clarita, CA
Santa Clarita, California ranks best in the quality of life category, taking the No. 8 spot. Specifically, less than 7% of the city’s population live in poverty (sixth-lowest) and roughly 53% of residents are married (10th-highest). The area is also pretty safe, with the seventh-lowest violent crime rate study-wide (roughly 131 crimes per 100,000 residents).
10. Irvine, CA
Irvine, California ranks in the top 10 for both the percentage of individuals earning $100,000 or more (nearly 46%) and living costs as a percent of income (roughly 38%). Irvine also has the No. 1 lowest violent crime rate study-wide (51 crimes for every 100,000 residents). Additionally, the county in which Irvine is located is also No. 10 for both the percentage of residents reporting poor mental health days (11.3) and life expectancy (82.8 years).
SmartAsset
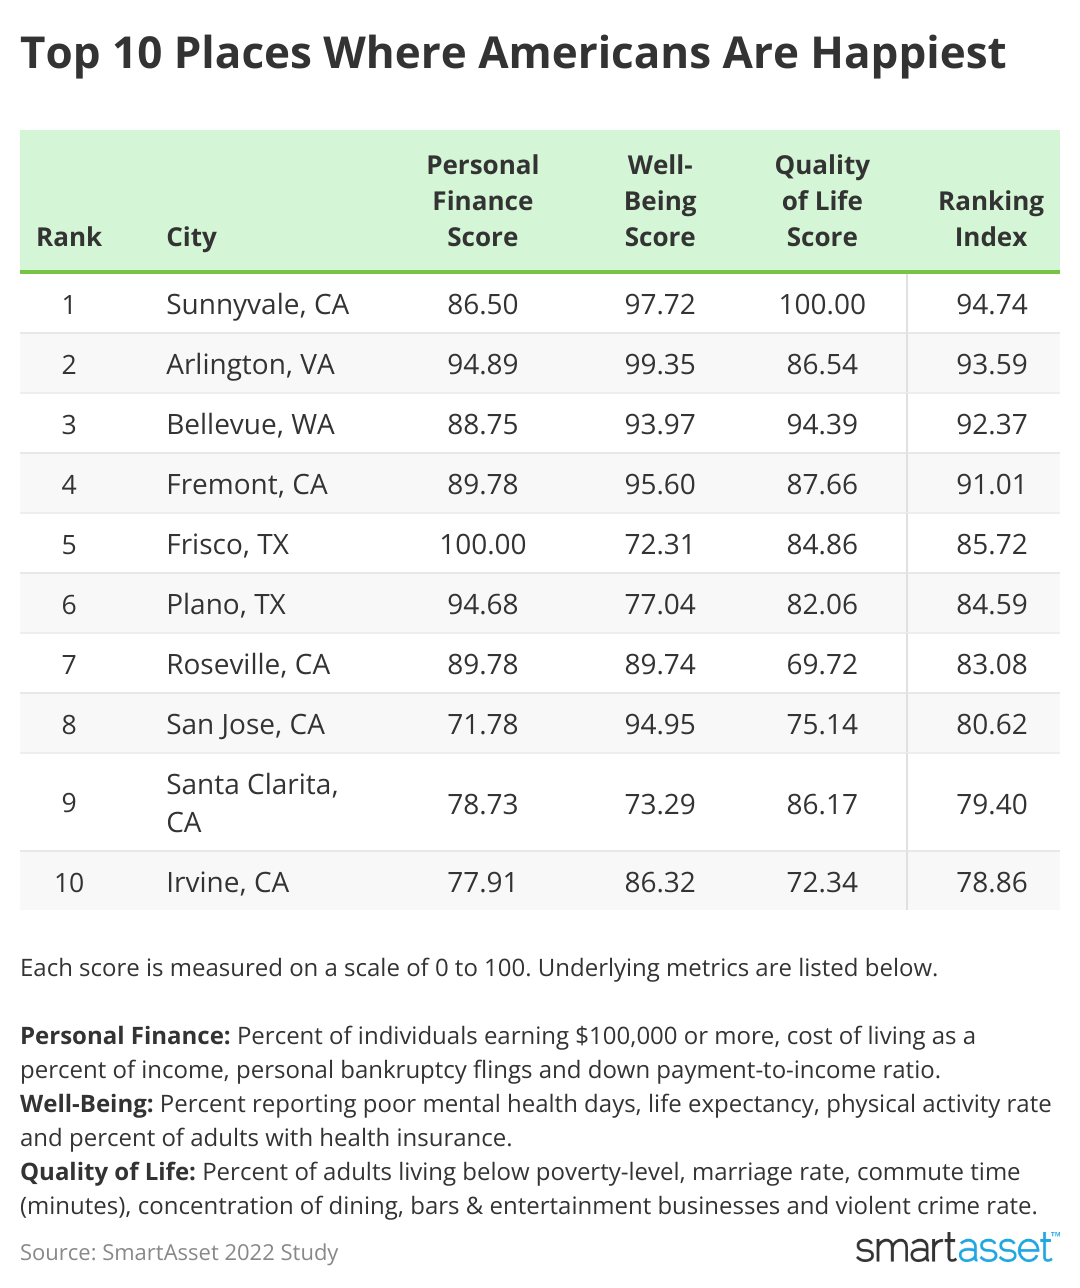
Data and Methodology
A chart showing scores for personal finance, well-being and quality of life.
To find where Americans are happiest, SmartAsset analyzed the 200 largest cities of which 164 had available data. Thirteen metrics were considered across three categories:
Personal Finances
- Percent of individuals earning $100,000 or more. Data comes from the U.S. Census Bureau’s 2021 1-year American Community Survey.
- Cost of living as a percent of income. This is the cost of living (for an individual with no children) divided by the median household income. Data comes from the U.S. Census Bureau’s 2021 1-year American Community Survey. Cost of living data is from MIT’s living wage calculator.
- Personal bankruptcy filings per 100,000 residents. Data is from uscourts.gov and is at a county-level.
- Down payment-to-income ratio. This is the ratio between a 20% down payment on the median-valued home and the median household income. Data is from the 2021 1-year American Community Survey.
Well-Being
- Percent reporting poor mental health days. Data is from the 2022 County Health Rankings.
- Life expectancy (years). Data is from the 2022 County Health Rankings.
- Percent who report physical inactivity. Data is from the 2022 County Health Rankings.
- Percent of adults with health insurance. Data comes from the U.S. Census Bureau’s 2021 1-year American Community Survey.
Quality of Life
- Percent of adults living below poverty level. Data is from the Census Bureau’s 2021 1-year American Community Survey.
- Marriage rate. Research by the GSS over five decades has shown that people who have been married (whether or not they currently still are) are happier than those who’ve never been married. For this reason, this metric was included in our analysis. Data is from the Census Bureau’s 2020 5-year American Community Survey.
- Average commute time. This is the average number of minutes it takes for a worker to commute to work. Data comes from the Census Bureau’s 2021 1-year American Community Survey.
- Concentration of dining, bars and entertainment establishments. This is the number of dining, bars and entertainment as a percentage of all establishments. Data comes from the Census Bureau’s 2020 County Business Patterns Survey.
- Violent crime rate. This is the number of violent crimes per 100,000 residents. Data comes from the FBI’s 2020 Uniform Crime Reporting database as well as NeighborhoodScout.com.
SmartAsset ranked each place in every metric and found an average ranking and score for each category. A final score was found by averaging the three category scores. The place with the highest cumulative score ranked at the top of the list.
This story originally appeared on SmartAsset and has been independently reviewed to meet journalistic standards.