These 5 counties are most vulnerable to extreme winter weather

ND700 // Shutterstock
These 5 counties are most vulnerable to extreme winter weather
crews in bucket truck working on power lines in snowy condition
Which counties face the biggest risks from winter weather events like ice storms, blizzards, and cold waves?
To find out, HVAC Gnome compared nearly 450 U.S. counties with relatively high and very high risk of extreme winter weather according to FEMA. We also considered the average historical winter temperature and expected annual financial loss from severe winter weather, among seven total metrics.
Explore our ranking below. To learn how we ranked the counties, see our methodology below.
![]()
HVAC Gnome
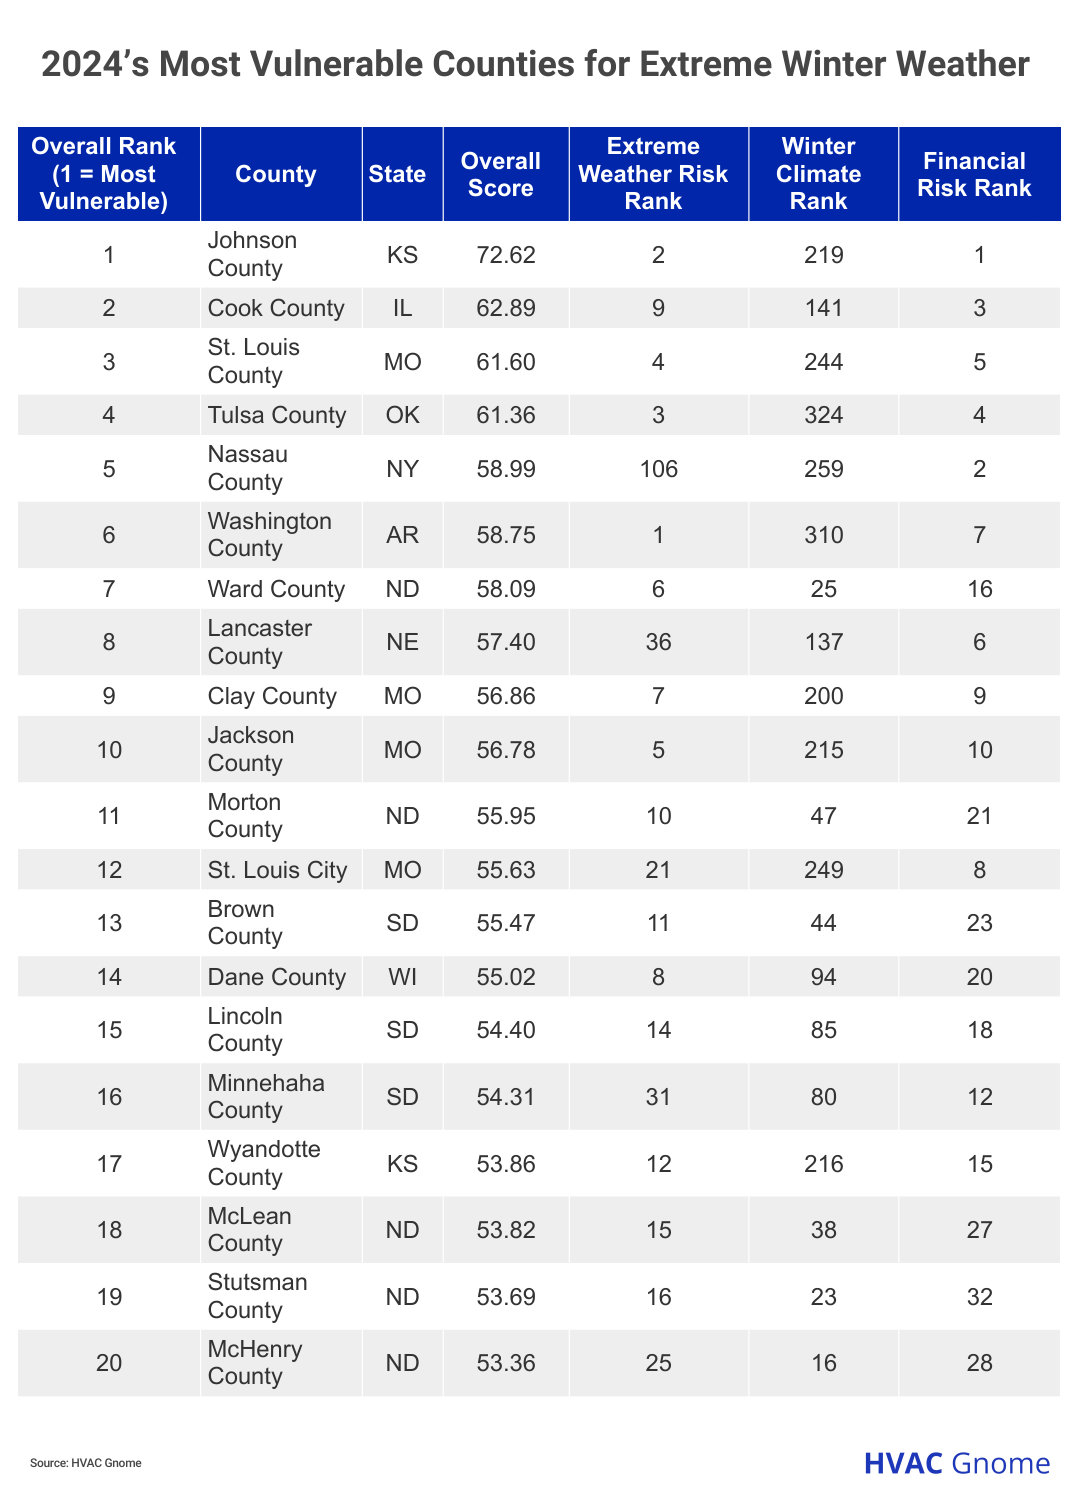
Here is a breakdown of the top 5 most vulnerable counties
table showing the 20 Most Vulnerable Counties for Extreme Winter Weather
No. 1: Johnson County, Kansas
- Overall Score: 72.62
- Winter Weather Risk Score: 100 | Rank: 1
- Ice Storm Risk Score: 99.63 | Rank: 8
- Cold Wave Risk Score: 94.34 | Rank: 89
- Expected Annual Financial Loss from Winter Weather Events: $10. 4 million | Rank:1
- Expected Annual Financial Loss from Ice Storms: $6.2 million | Rank: 7
No. 2: Cook County, Illinois
- Overall Score: 62.89
- Winter Weather Risk Score: 99.65 | Rank: 12
- Ice Storm Risk Score: 90.94 | Rank: 98
- Cold Wave Risk Score: 100 | Rank: 1
- Expected Annual Financial Loss from Winter Weather Events: $2.5 million | Rank: 15
- Expected Annual Financial Loss from Cold Waves: $68 million | Rank: 1
No. 3: St. Louis County, Missouri
- Overall Score: 61.6
- Winter Weather Risk Score: 99.97 | Rank: 8
- Ice Storm Risk Score: 94.94 | Rank: 5
- Expected Annual Financial Loss from Winter Weather Events: $5.1 million | Rank: 5
- Expected Annual Financial Loss from Ice Storms: $1 million | Rank: 5
- Expected Annual Financial Loss from Cold Waves: $159,467.36 | Rank: 117
No. 4: Tulsa County, Oklahoma
- Overall Score: 61.36
- Winter Weather Risk Score: 99.9 | Rank: 4
- Ice Storm Risk Score: 99.97 | Rank: 2
- Expected Annual Financial Loss from Winter Weather Events: $3.9 million | Rank: 4
- Expected Annual Financial Loss from Ice Storms: $8.9 million | Rank: 4
- Expected Annual Financial Loss from Cold Waves: $759,664.85 | Rank: 120
No. 5: Nassau County, New York
- Overall Score: 58.99
- Average Historical Winter Temperature: 36.13 | Rank: 259
- Winter Weather Risk Score: 98.31 | Rank: 54
- Ice Storm Risk Score: 100 | Rank: 1
- Expected Annual Financial Loss from Winter Weather Events: $1.4 million | Rank: 43
- Expected Annual Financial Loss from Ice Storms: $25.7 million | Rank: 1
The upshot
Midwestern counties such as Johnson County, Kansas (No. 1), Cook County, Illinois (No. 2), and St. Louis County, Missouri (No. 3), finish as the most vulnerable counties to severe winter weather, ice storms, and cold waves. Johnson County deals with the highest expected financial loss from winter weather events — over $10 million. Cook County faces an estimated annual loss of over $68 million due to cold waves.
26 North Dakota counties score among the 100 most vulnerable, with Ward County (No. 7) landing in the worst 10. North Dakota shivers through some of the coldest winters — Cavalier County (No. 188), has the lowest average historical winter temperature of 7.84 degrees.
Southern states like Tennessee, Kentucky, and South Carolina land in the less vulnerable half of our ranking thanks to lower chances of extreme winter weather and less costly estimated financial losses.
Behind the ranking
First, we determined the factors (metrics) that are most relevant to rank the most vulnerable counties for extreme winter weather. We then assigned a weight to each factor based on its importance and grouped those factors into 3 categories: Extreme Weather Risk, Winter Climate, and Financial Risk. The categories, factors, and their weights for 447 U.S. counties with Relatively High and Very High risk of extreme winter weather, as determined by FEMA, can be found here.
Finally, we calculated scores (out of 100 points) for each county to determine its rank in each factor, each category, and overall. A county’s Overall Score is the average of its scores across all factors and categories. The highest Overall Score ranked “Most Vulnerable” (No. 1) and the lowest “Least Vulnerable” (No. 447). Note: The “Least Vulnerable” among individual factors may not be No. 447 due to ties.
This story was produced by HVAC Gnome and reviewed and distributed by Stacker Media.