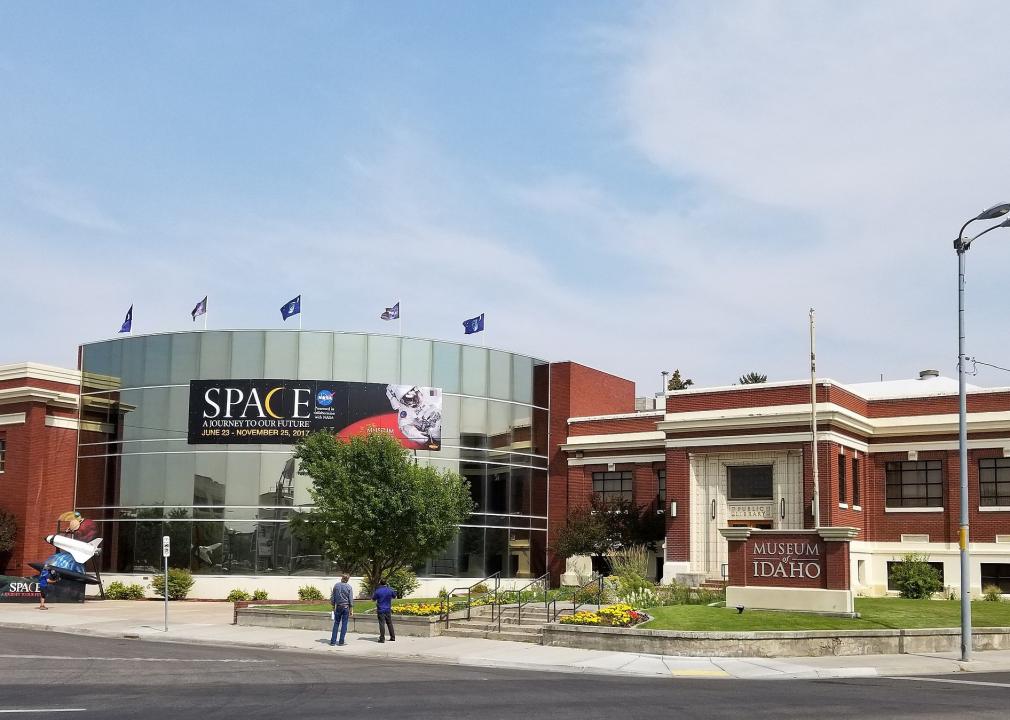
Counties with the most super commuters in Idaho
Tricia Simpson // Wikimedia Commons
Counties with the most super commuters in Idaho
There are more than 283 million vehicles on the road in the United States, and many of those cars, trucks, vans, and motorcycles are used to ferry people to and from their homes and jobs during their daily commutes. A small but growing number of people are walking and biking to work, particularly in compact college towns. Many more take public transportation, especially in major cities like New York, Chicago, San Francisco, Washington D.C., Boston, and Seattle—but nationwide, public transit accounts for only about 5% of daily commutes.
The overwhelming majority of people still drive to and from work every day, and the vast majority of those car commuters drive alone—fewer than 10% of Americans carpool. According to the U.S. Census Bureau, the average one-way commute in the United States has grown to a record 26.9 minutes. That’s just shy of an hour a day that average Americans squander behind the wheel, not at home with their families, and instead, burning gas and putting miles on their cars.
For some Americans, however, the commute to work is far from average. A phenomenon known as super commuting has emerged and grown in recent years. Super commuters spend 90 minutes or more—each way—chasing their paychecks every day. The biggest percentage of super commuters work in the extraction industry, with workers pursuing lucrative jobs in remote mines, oil fields, and other energy operations. Many more, however, have been priced out of expensive housing in urban metro areas where high-paying jobs are located, far away from their less-expensive county of residence.
Stacker compiled a list of counties with the most super commuters in Idaho using data from the U.S. Census Bureau. Counties are ranked by the highest percent of workers with a commute over 90 minutes, based on 2020 5-year estimates. Keep reading to see where in your state people are spending the most time going to and from work every day.
![]()
JERRYE & ROY KLOTZ MD // Wikimedia Commons
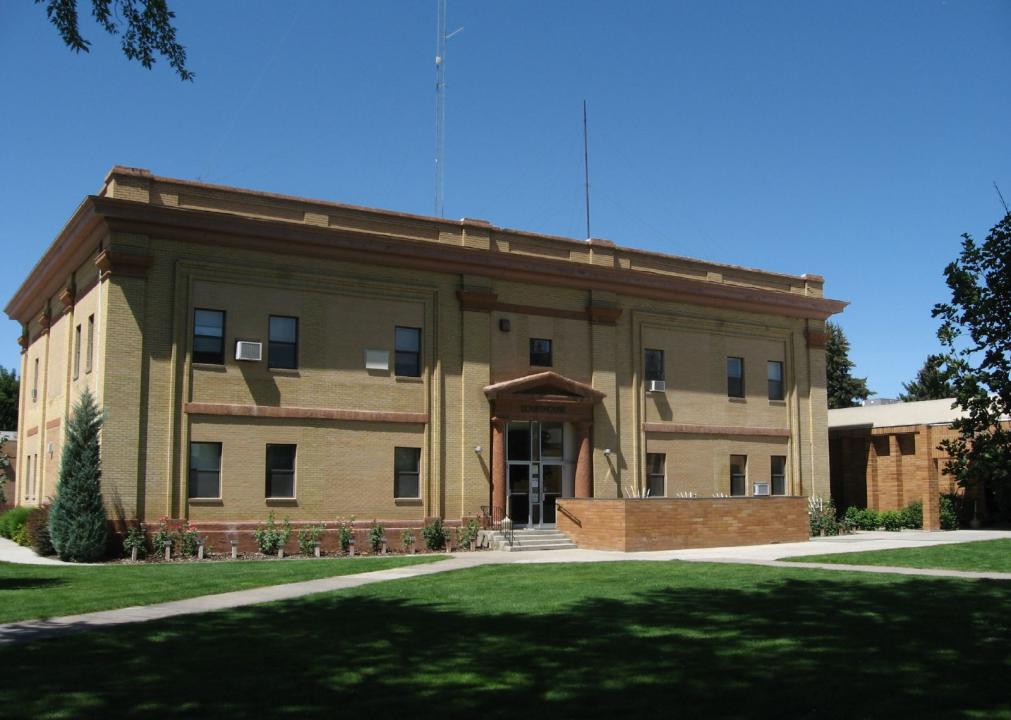
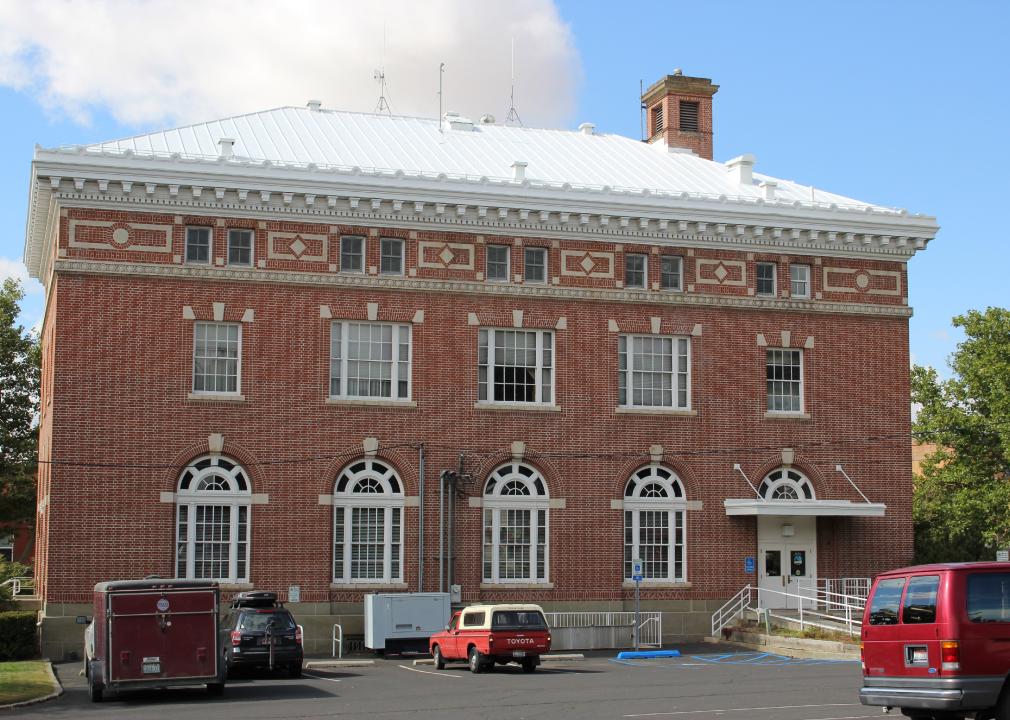
#44. Power County
– Workers with 90+ minute commute: 0.0%
— 60+ minute commute: 1.4%
– Average commute time: 16.5 minutes
— 4.7 minutes shorter than state average
– Left for work from 12 a.m. to 6 a.m.: 13.0%
– Worked outside county of residence: 27.5%
– Means of transportation: drove alone (71.0%), carpooled (11.4%), walked to work (7.0%), public transportation (0.0%), worked from home (9.1%)
Larry D. Moore // Wikimedia Commons
#43. Jerome County
– Workers with 90+ minute commute: 0.5%
— 60+ minute commute: 3.0%
– Average commute time: 18 minutes
— 3.2 minutes shorter than state average
– Left for work from 12 a.m. to 6 a.m.: 15.3%
– Worked outside county of residence: 36.9%
– Means of transportation: drove alone (79.8%), carpooled (12.8%), walked to work (2.2%), public transportation (0.6%), worked from home (4.3%)
tinosa // Wikimedia Commons
#42. Custer County
– Workers with 90+ minute commute: 0.6%
— 60+ minute commute: 8.6%
– Average commute time: 16.6 minutes
— 4.6 minutes shorter than state average
– Left for work from 12 a.m. to 6 a.m.: 11.5%
– Worked outside county of residence: 10.0%
– Means of transportation: drove alone (54.8%), carpooled (10.9%), walked to work (7.0%), public transportation (0.2%), worked from home (24.4%)
Ken Lund // Wikimedia Commons
#41. Minidoka County
– Workers with 90+ minute commute: 0.7%
— 60+ minute commute: 2.9%
– Average commute time: 16.2 minutes
— 5.0 minutes shorter than state average
– Left for work from 12 a.m. to 6 a.m.: 18.5%
– Worked outside county of residence: 37.8%
– Means of transportation: drove alone (82.1%), carpooled (11.3%), walked to work (1.8%), public transportation (0.1%), worked from home (3.7%)
Ken Lund // Wikimedia Commons
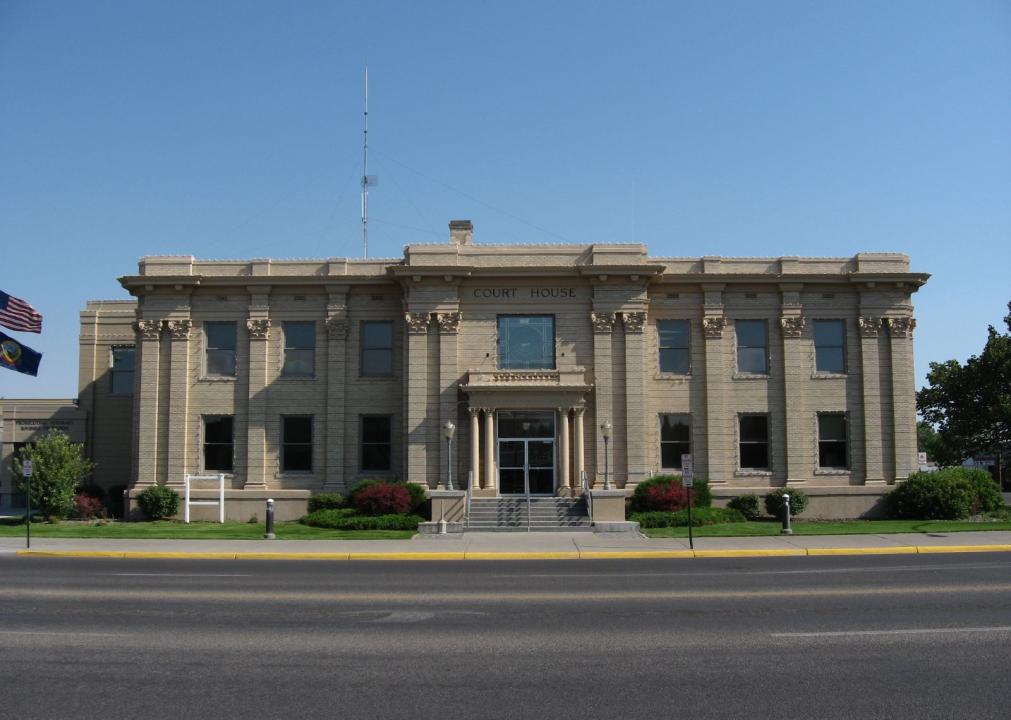
#40. Madison County
– Workers with 90+ minute commute: 0.9%
— 60+ minute commute: 2.3%
– Average commute time: 14.1 minutes
— 7.1 minutes shorter than state average
– Left for work from 12 a.m. to 6 a.m.: 6.1%
– Worked outside county of residence: 16.5%
– Means of transportation: drove alone (67.0%), carpooled (16.1%), walked to work (7.1%), public transportation (0.5%), worked from home (8.2%)
You may also like: Counties with the most college graduates in Idaho
Greg L. Wright // Wikimedia Commons
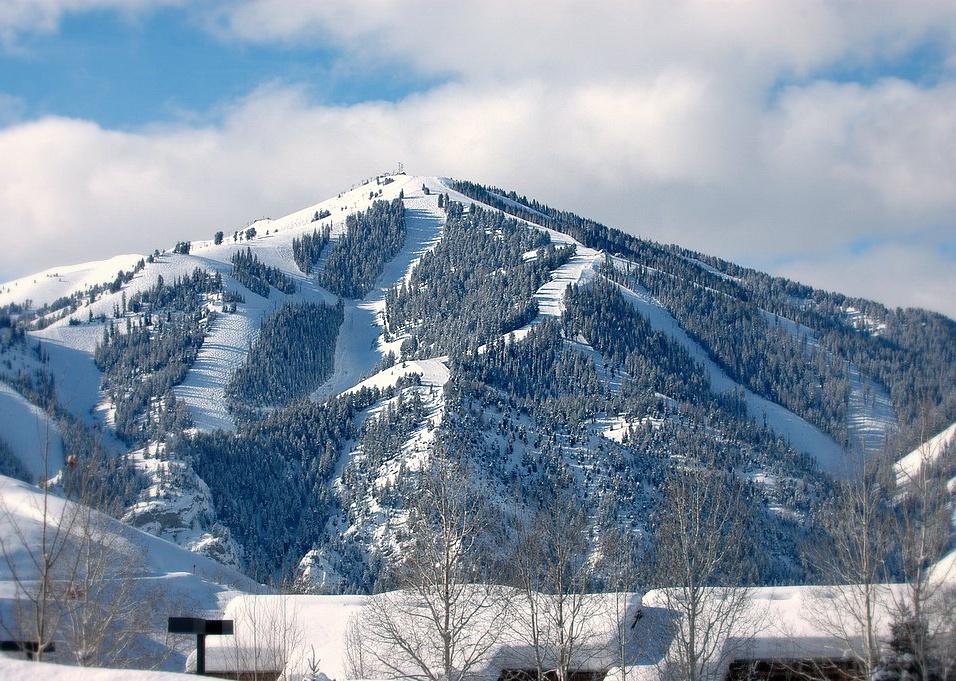
#39. Blaine County
– Workers with 90+ minute commute: 1.0%
— 60+ minute commute: 3.6%
– Average commute time: 17.5 minutes
— 3.7 minutes shorter than state average
– Left for work from 12 a.m. to 6 a.m.: 8.1%
– Worked outside county of residence: 1.5%
– Means of transportation: drove alone (73.4%), carpooled (7.3%), walked to work (2.8%), public transportation (1.3%), worked from home (12.8%)
wilson44691 // Wikimedia Commons
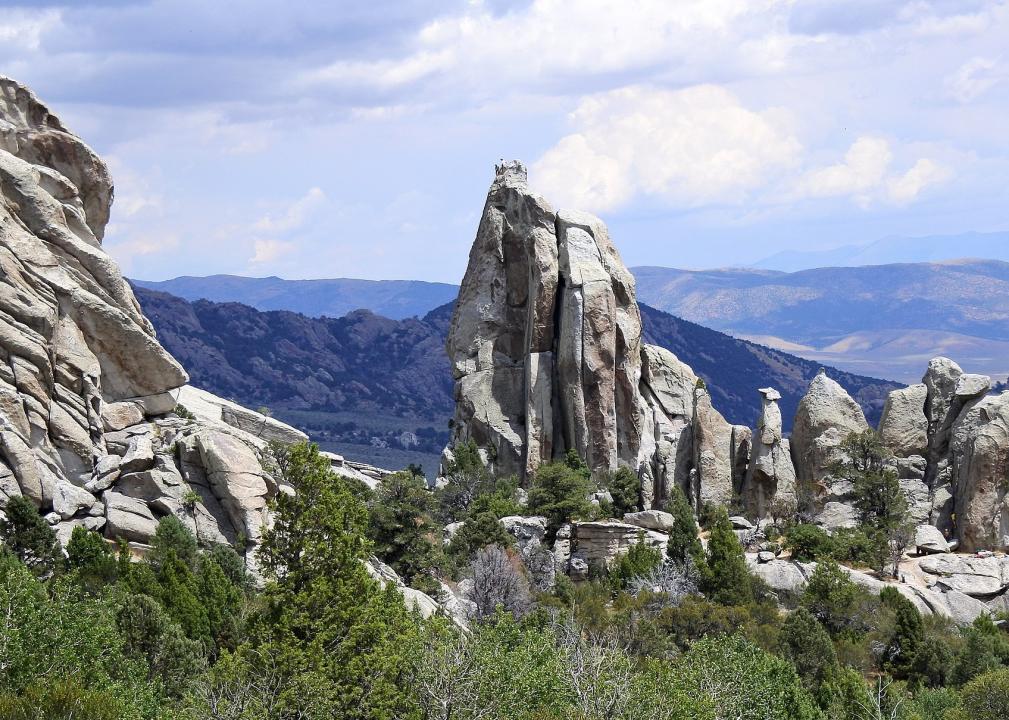
#38. Cassia County
– Workers with 90+ minute commute: 1.1%
— 60+ minute commute: 3.3%
– Average commute time: 15.9 minutes
— 5.3 minutes shorter than state average
– Left for work from 12 a.m. to 6 a.m.: 15.4%
– Worked outside county of residence: 25.9%
– Means of transportation: drove alone (83.5%), carpooled (8.5%), walked to work (2.5%), public transportation (0.4%), worked from home (4.4%)
John D // Wikimedia Commons
#37. Gem County
– Workers with 90+ minute commute: 1.1%
— 60+ minute commute: 12.5%
– Average commute time: 28.8 minutes
— 7.6 minutes longer than state average
– Left for work from 12 a.m. to 6 a.m.: 18.2%
– Worked outside county of residence: 42.8%
– Means of transportation: drove alone (80.8%), carpooled (10.4%), walked to work (0.6%), public transportation (0.0%), worked from home (7.0%)

Forest Service Northern Region from Missoula, MT, USA // Wikimedia Commons
#36. Idaho County
– Workers with 90+ minute commute: 1.3%
— 60+ minute commute: 6.6%
– Average commute time: 17 minutes
— 4.2 minutes shorter than state average
– Left for work from 12 a.m. to 6 a.m.: 22.6%
– Worked outside county of residence: 16.2%
– Means of transportation: drove alone (72.1%), carpooled (12.3%), walked to work (7.5%), public transportation (0.4%), worked from home (5.5%)
John Stanton // Wikimedia Commons
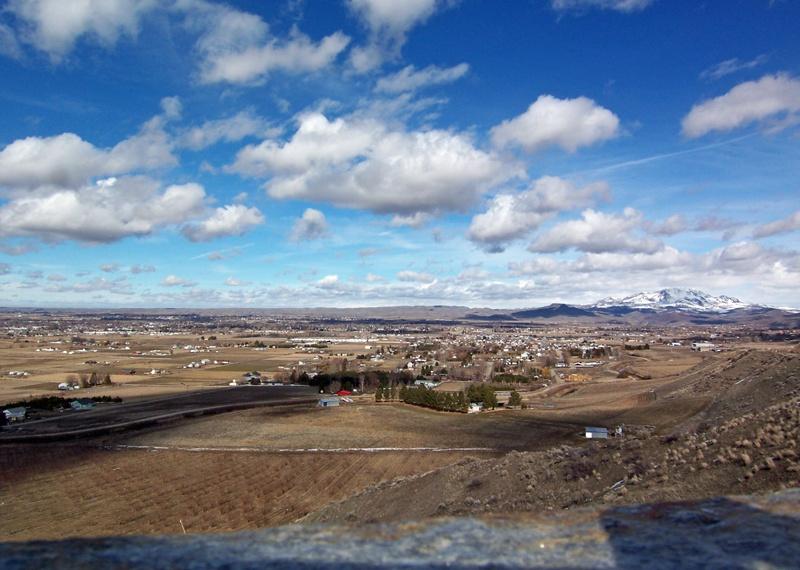
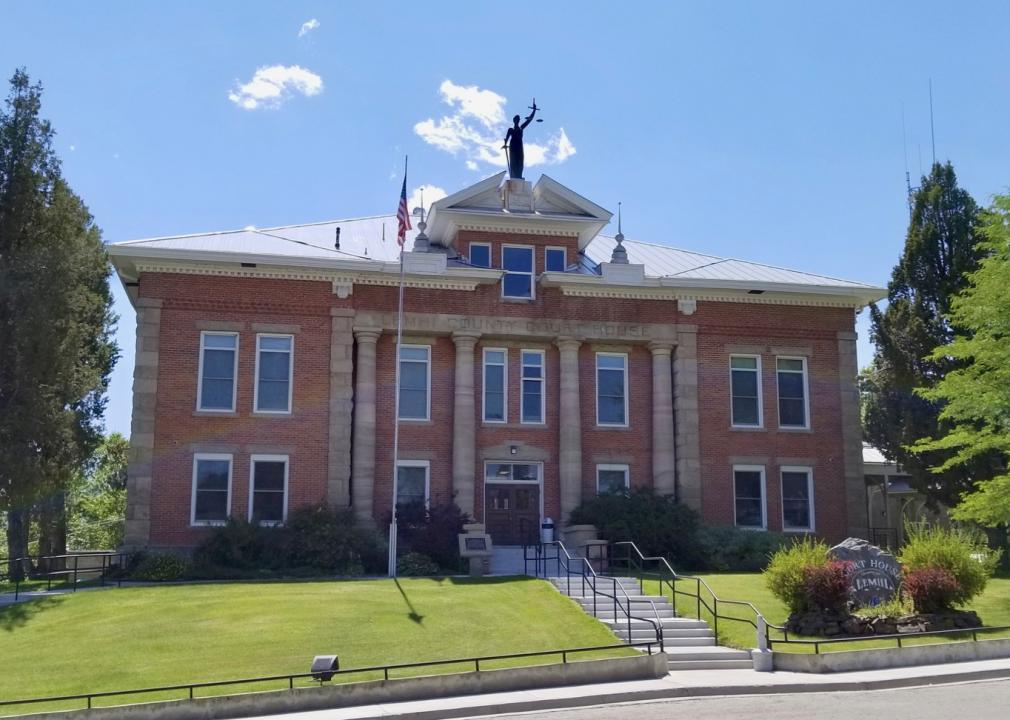
#35. Lemhi County
– Workers with 90+ minute commute: 1.4%
— 60+ minute commute: 3.3%
– Average commute time: 12.5 minutes
— 8.7 minutes shorter than state average
– Left for work from 12 a.m. to 6 a.m.: 12.2%
– Worked outside county of residence: 4.1%
– Means of transportation: drove alone (72.9%), carpooled (9.9%), walked to work (5.5%), public transportation (0.0%), worked from home (7.9%)
You may also like: Best private high schools in Idaho
Charles Knowles // Shutterstock
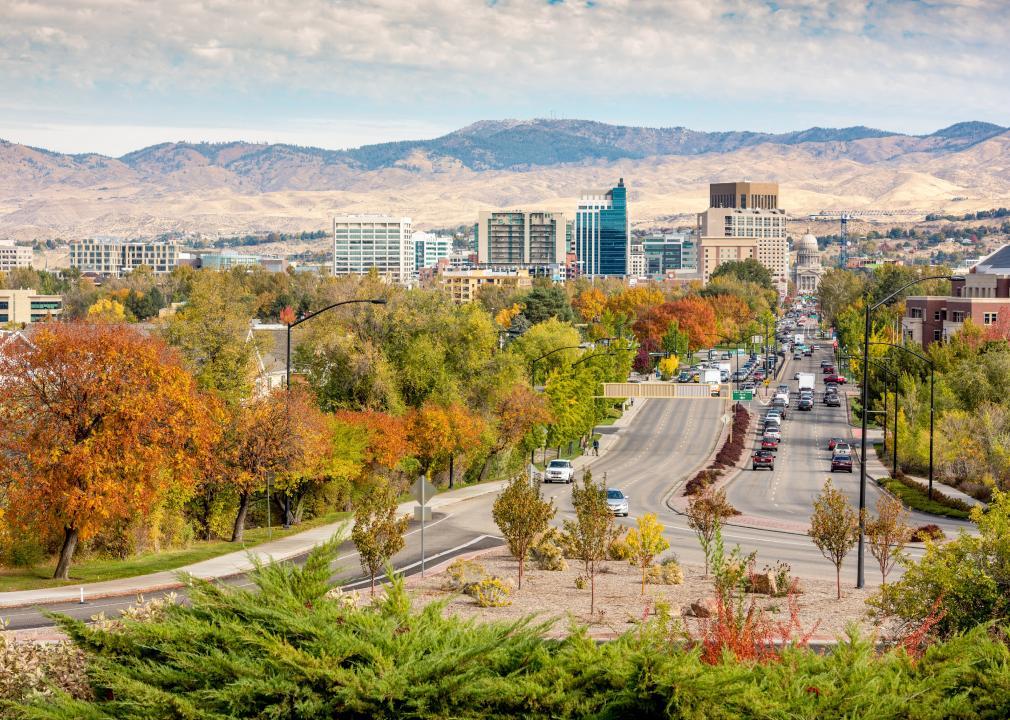
#34. Ada County
– Workers with 90+ minute commute: 1.4%
— 60+ minute commute: 2.8%
– Average commute time: 20.9 minutes
— 0.3 minutes shorter than state average
– Left for work from 12 a.m. to 6 a.m.: 8.4%
– Worked outside county of residence: 6.4%
– Means of transportation: drove alone (78.2%), carpooled (7.3%), walked to work (2.0%), public transportation (0.3%), worked from home (9.4%)
Ian Poellet // Wikimedia Commons
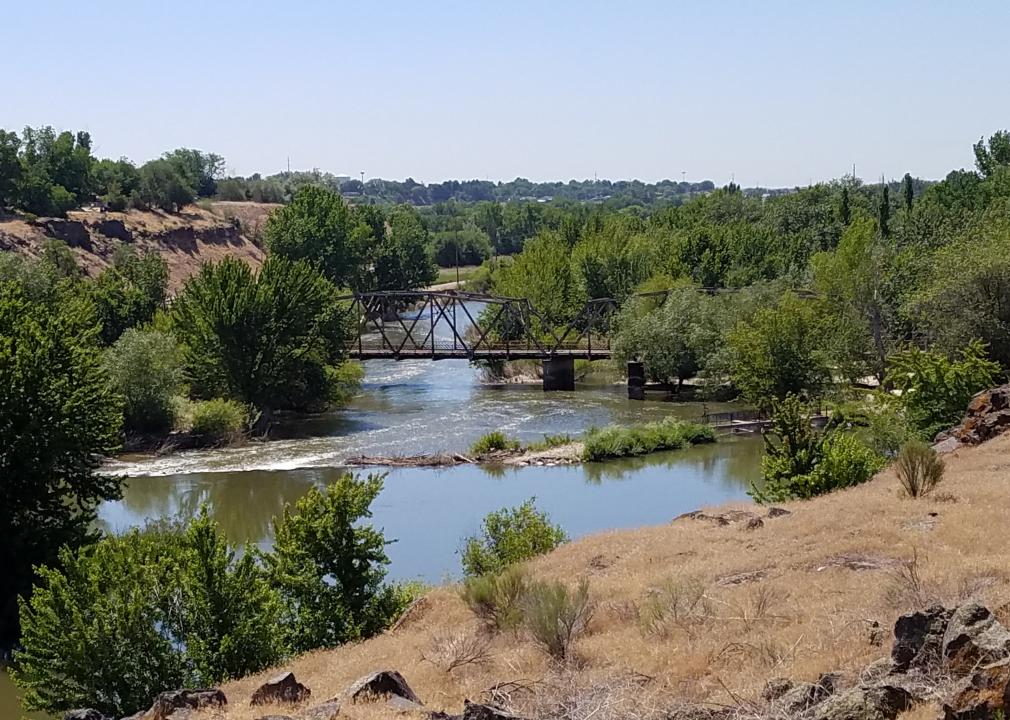
#33. Payette County
– Workers with 90+ minute commute: 1.4%
— 60+ minute commute: 5.4%
– Average commute time: 19.5 minutes
— 1.7 minutes shorter than state average
– Left for work from 12 a.m. to 6 a.m.: 12.3%
– Worked outside county of residence: 17.9%
– Means of transportation: drove alone (86.2%), carpooled (7.3%), walked to work (2.5%), public transportation (0.0%), worked from home (3.2%)
Apstrinka // Wikimedia Commons
#32. Latah County
– Workers with 90+ minute commute: 1.5%
— 60+ minute commute: 4.5%
– Average commute time: 19.3 minutes
— 1.9 minutes shorter than state average
– Left for work from 12 a.m. to 6 a.m.: 11.7%
– Worked outside county of residence: 6.9%
– Means of transportation: drove alone (66.0%), carpooled (10.3%), walked to work (12.3%), public transportation (0.9%), worked from home (6.7%)

Lowjumpingfrog // Wikimedia Commons
#31. Teton County
– Workers with 90+ minute commute: 1.5%
— 60+ minute commute: 12.8%
– Average commute time: 29.2 minutes
— 8.0 minutes longer than state average
– Left for work from 12 a.m. to 6 a.m.: 9.5%
– Worked outside county of residence: 4.0%
– Means of transportation: drove alone (71.3%), carpooled (10.0%), walked to work (1.2%), public transportation (2.1%), worked from home (14.1%)
Squelle // Wikimedia Commons
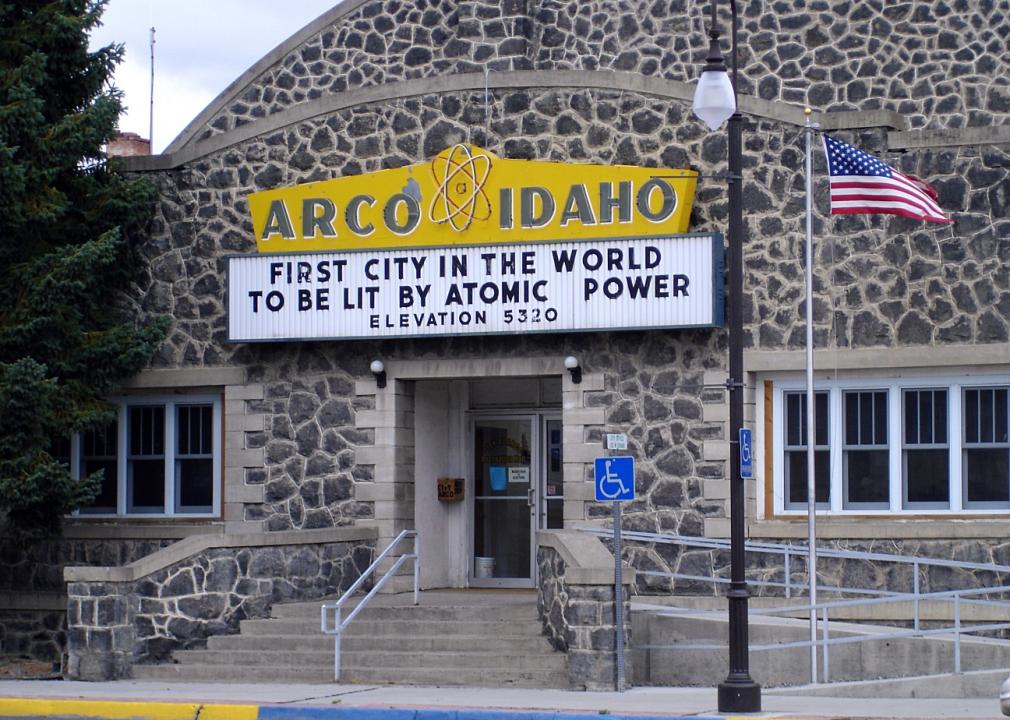
#30. Butte County
– Workers with 90+ minute commute: 1.7%
— 60+ minute commute: 5.8%
– Average commute time: 19.2 minutes
— 2.0 minutes shorter than state average
– Left for work from 12 a.m. to 6 a.m.: 22.3%
– Worked outside county of residence: 14.1%
– Means of transportation: drove alone (69.1%), carpooled (12.2%), walked to work (4.3%), public transportation (1.4%), worked from home (10.4%)
You may also like: Highest-rated things to do in Idaho, according to Tripadvisor
rustejunk // Wikimedia Commons
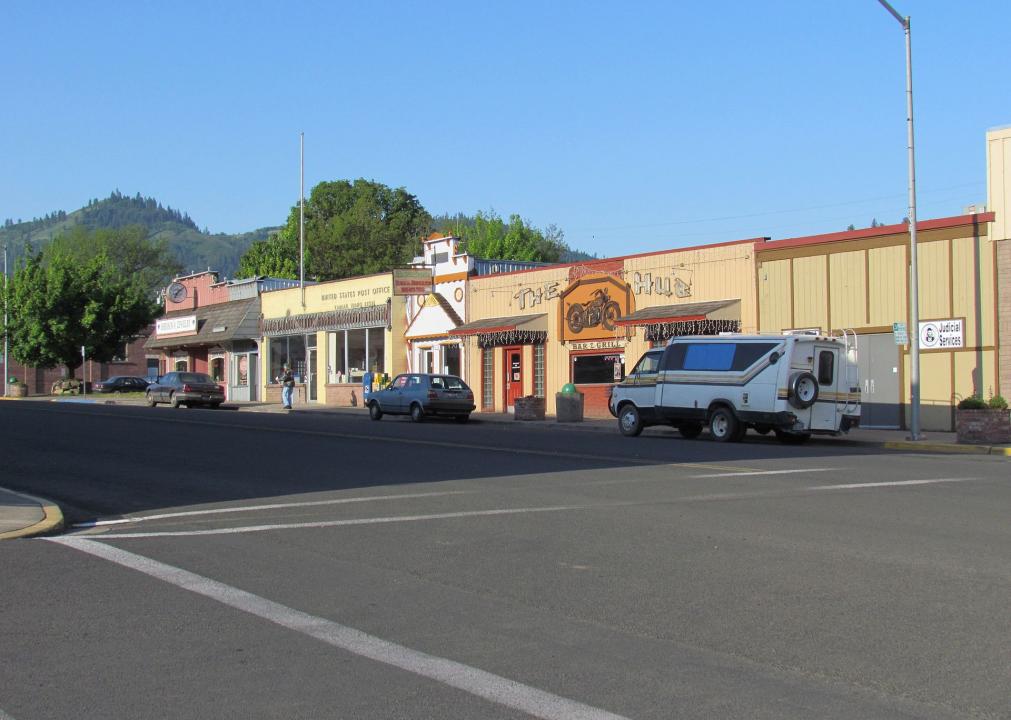
#29. Lewis County
– Workers with 90+ minute commute: 1.7%
— 60+ minute commute: 10.0%
– Average commute time: 21.3 minutes
— 0.1 minutes longer than state average
– Left for work from 12 a.m. to 6 a.m.: 18.6%
– Worked outside county of residence: 33.7%
– Means of transportation: drove alone (75.8%), carpooled (12.0%), walked to work (6.4%), public transportation (0.5%), worked from home (4.8%)
Dsdugan // Wikimedia Commons
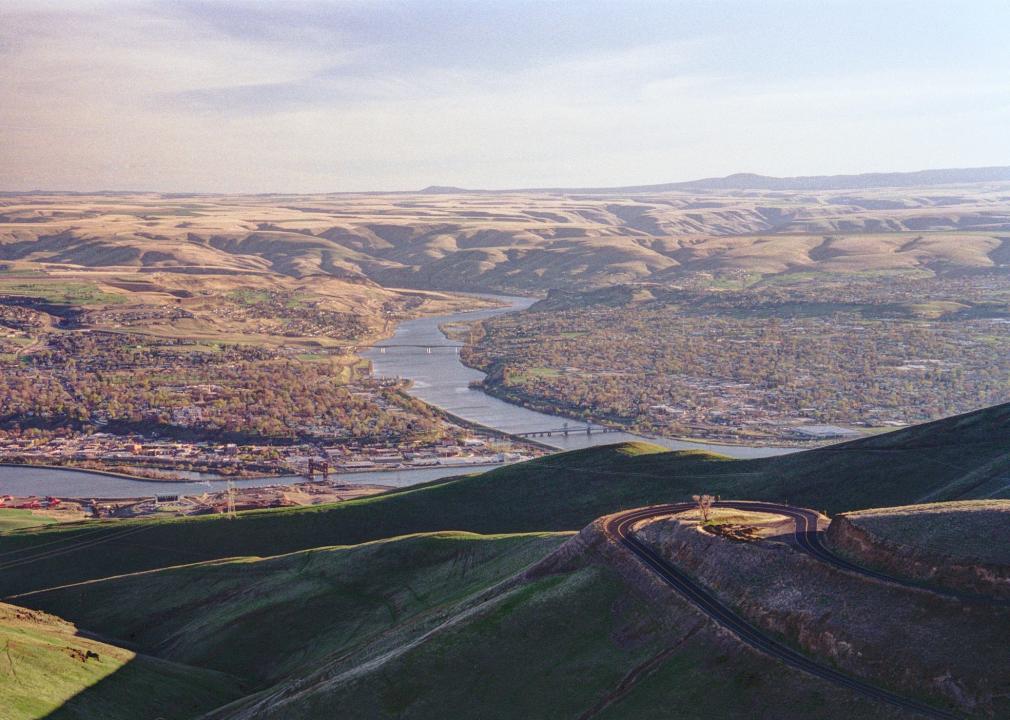
#28. Nez Perce County
– Workers with 90+ minute commute: 1.7%
— 60+ minute commute: 3.8%
– Average commute time: 17.4 minutes
— 3.8 minutes shorter than state average
– Left for work from 12 a.m. to 6 a.m.: 19.5%
– Worked outside county of residence: 3.8%
– Means of transportation: drove alone (81.6%), carpooled (7.5%), walked to work (3.1%), public transportation (0.5%), worked from home (5.7%)
Tamanoeconomico // Wikimedia Commons
#27. Canyon County
– Workers with 90+ minute commute: 1.8%
— 60+ minute commute: 4.6%
– Average commute time: 25.4 minutes
— 4.2 minutes longer than state average
– Left for work from 12 a.m. to 6 a.m.: 15.3%
– Worked outside county of residence: 35.5%
– Means of transportation: drove alone (78.3%), carpooled (10.3%), walked to work (1.4%), public transportation (0.2%), worked from home (7.8%)
Antony-22 // Wikimedia Commons
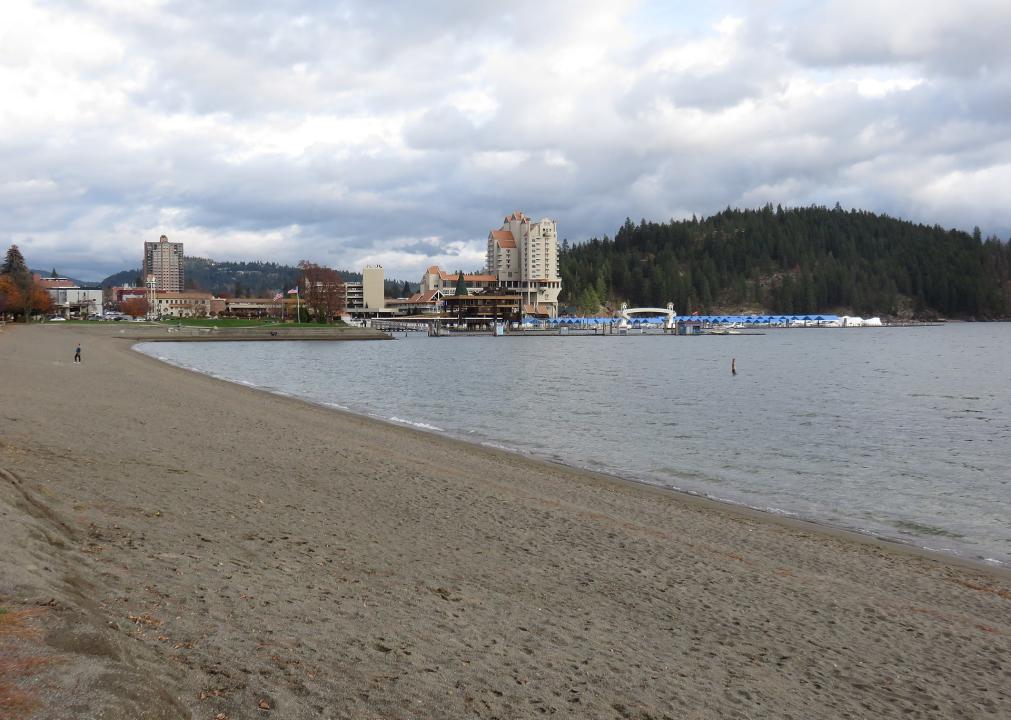
#26. Kootenai County
– Workers with 90+ minute commute: 1.9%
— 60+ minute commute: 4.7%
– Average commute time: 22.1 minutes
— 0.9 minutes longer than state average
– Left for work from 12 a.m. to 6 a.m.: 13.9%
– Worked outside county of residence: 2.7%
– Means of transportation: drove alone (79.7%), carpooled (9.1%), walked to work (1.5%), public transportation (0.3%), worked from home (8.3%)
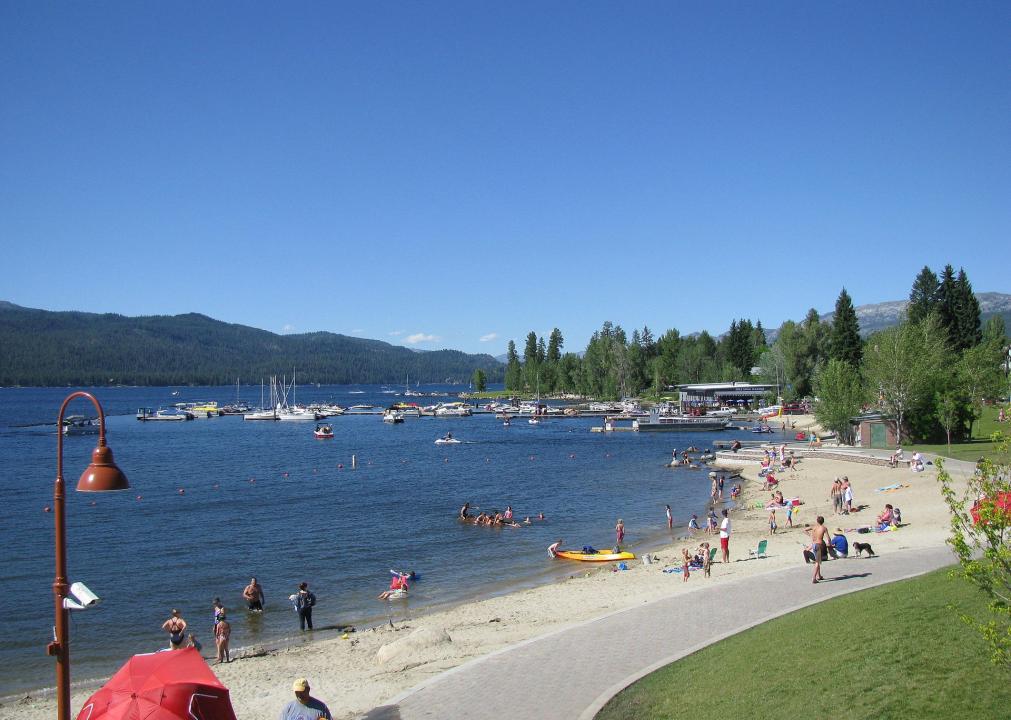
Karthikc123 // Wikimedia Commons
#25. Valley County
– Workers with 90+ minute commute: 1.9%
— 60+ minute commute: 2.8%
– Average commute time: 14.1 minutes
— 7.1 minutes shorter than state average
– Left for work from 12 a.m. to 6 a.m.: 7.5%
– Worked outside county of residence: 1.9%
– Means of transportation: drove alone (77.1%), carpooled (3.8%), walked to work (2.4%), public transportation (0.3%), worked from home (15.5%)
You may also like: Famous actors from Idaho
Dschwen // Wikimedia Commons
#24. Caribou County
– Workers with 90+ minute commute: 1.9%
— 60+ minute commute: 8.3%
– Average commute time: 18.1 minutes
— 3.1 minutes shorter than state average
– Left for work from 12 a.m. to 6 a.m.: 16.7%
– Worked outside county of residence: 9.6%
– Means of transportation: drove alone (75.0%), carpooled (16.1%), walked to work (3.7%), public transportation (0.0%), worked from home (3.7%)

KRRK // Wikimedia Commons
#23. Bingham County
– Workers with 90+ minute commute: 2.0%
— 60+ minute commute: 5.5%
– Average commute time: 23 minutes
— 1.8 minutes longer than state average
– Left for work from 12 a.m. to 6 a.m.: 16.2%
– Worked outside county of residence: 36.1%
– Means of transportation: drove alone (76.2%), carpooled (13.7%), walked to work (1.3%), public transportation (2.7%), worked from home (5.2%)
Karthikc123 // Wikimedia Commons
#22. Twin Falls County
– Workers with 90+ minute commute: 2.0%
— 60+ minute commute: 4.0%
– Average commute time: 19.1 minutes
— 2.1 minutes shorter than state average
– Left for work from 12 a.m. to 6 a.m.: 14.0%
– Worked outside county of residence: 13.2%
– Means of transportation: drove alone (82.6%), carpooled (8.9%), walked to work (1.5%), public transportation (0.2%), worked from home (5.8%)
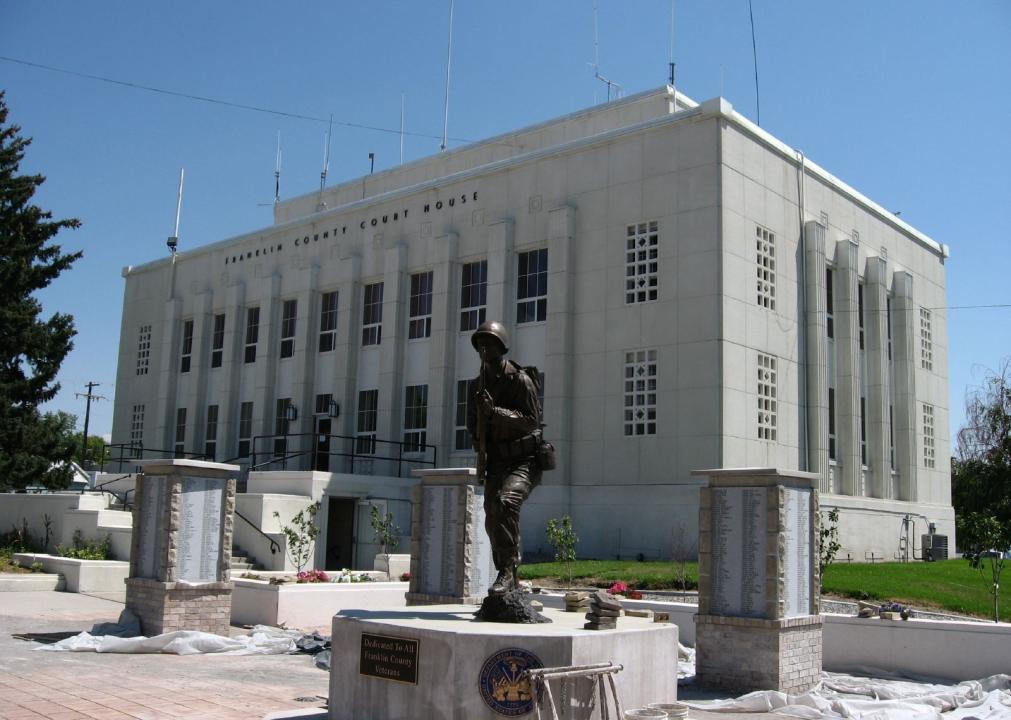
Ken Lund // Wikimedia Commons
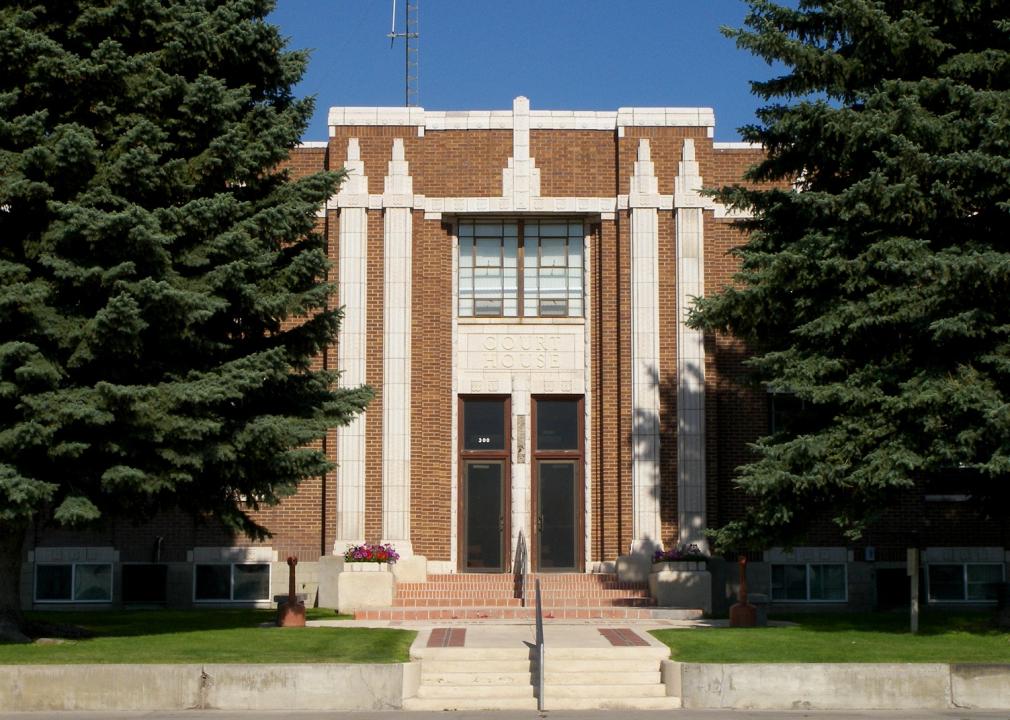
#21. Franklin County
– Workers with 90+ minute commute: 2.2%
— 60+ minute commute: 8.4%
– Average commute time: 26.3 minutes
— 5.1 minutes longer than state average
– Left for work from 12 a.m. to 6 a.m.: 23.0%
– Worked outside county of residence: 4.0%
– Means of transportation: drove alone (81.2%), carpooled (10.7%), walked to work (1.4%), public transportation (0.3%), worked from home (5.8%)
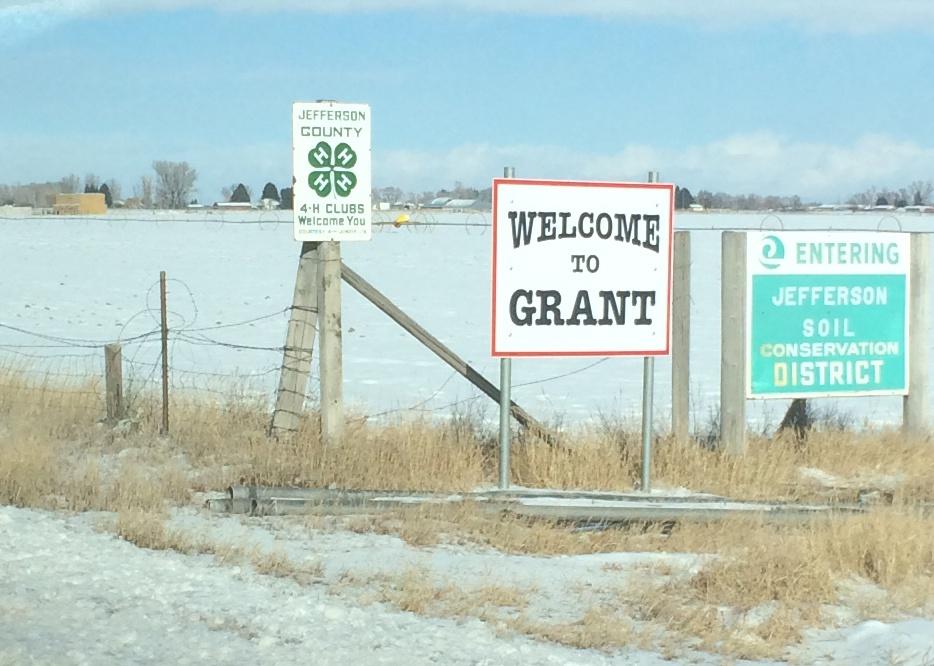
Bathlander // Wikimedia Commons
#20. Jefferson County
– Workers with 90+ minute commute: 2.3%
— 60+ minute commute: 5.7%
– Average commute time: 22.7 minutes
— 1.5 minutes longer than state average
– Left for work from 12 a.m. to 6 a.m.: 11.4%
– Worked outside county of residence: 50.4%
– Means of transportation: drove alone (75.7%), carpooled (10.2%), walked to work (2.1%), public transportation (1.9%), worked from home (7.9%)
You may also like: What Idaho’s immigrant population looked like in 1900
L’Aquatique // Wikimedia Commons
#19. Bonner County
– Workers with 90+ minute commute: 2.3%
— 60+ minute commute: 7.8%
– Average commute time: 23.5 minutes
— 2.3 minutes longer than state average
– Left for work from 12 a.m. to 6 a.m.: 18.8%
– Worked outside county of residence: 10.4%
– Means of transportation: drove alone (75.2%), carpooled (10.5%), walked to work (2.8%), public transportation (0.8%), worked from home (7.3%)
Jcarr29 // Wikimedia Commons
#18. Bonneville County
– Workers with 90+ minute commute: 2.5%
— 60+ minute commute: 6.9%
– Average commute time: 19.8 minutes
— 1.4 minutes shorter than state average
– Left for work from 12 a.m. to 6 a.m.: 14.7%
– Worked outside county of residence: 11.6%
– Means of transportation: drove alone (79.2%), carpooled (9.1%), walked to work (1.4%), public transportation (2.8%), worked from home (5.9%)
Tom Young // Wikimedia Commons
#17. Lincoln County
– Workers with 90+ minute commute: 2.5%
— 60+ minute commute: 20.6%
– Average commute time: 30.5 minutes
— 9.3 minutes longer than state average
– Left for work from 12 a.m. to 6 a.m.: 15.6%
– Worked outside county of residence: 49.7%
– Means of transportation: drove alone (74.6%), carpooled (18.0%), walked to work (2.3%), public transportation (1.1%), worked from home (3.6%)
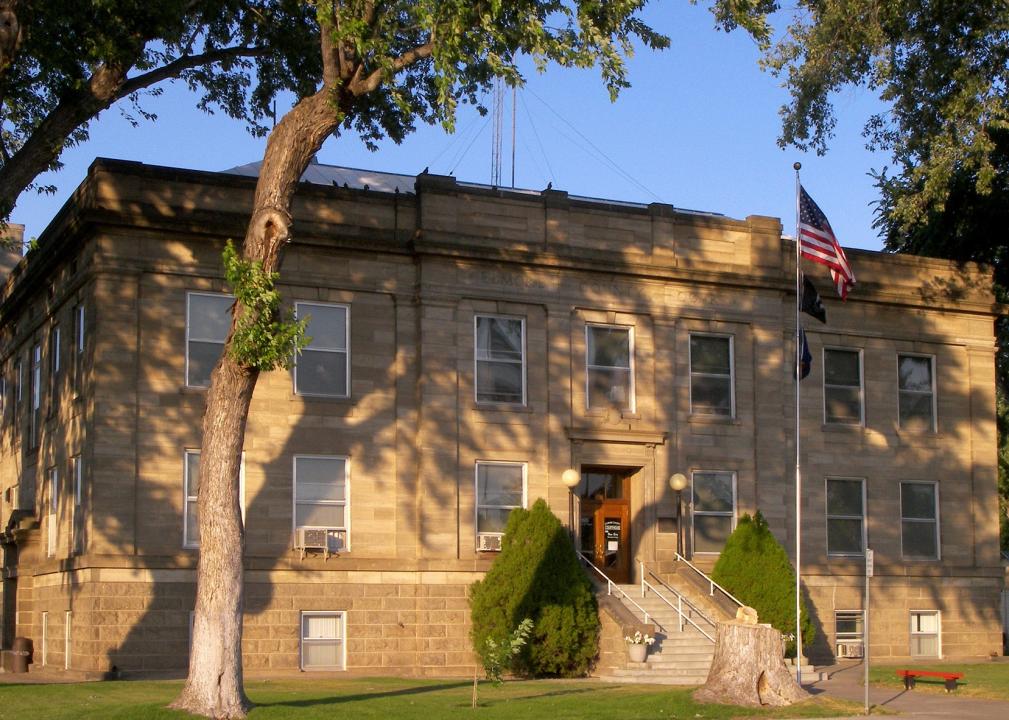
Larry D. Moore // Wikimedia Commons
#16. Elmore County
– Workers with 90+ minute commute: 2.5%
— 60+ minute commute: 5.9%
– Average commute time: 20.6 minutes
— 0.6 minutes shorter than state average
– Left for work from 12 a.m. to 6 a.m.: 15.6%
– Worked outside county of residence: 14.9%
– Means of transportation: drove alone (81.1%), carpooled (11.8%), walked to work (2.4%), public transportation (0.6%), worked from home (2.8%)
Michlaovic // Wikimedia
#15. Bannock County
– Workers with 90+ minute commute: 2.5%
— 60+ minute commute: 5.1%
– Average commute time: 17.9 minutes
— 3.3 minutes shorter than state average
– Left for work from 12 a.m. to 6 a.m.: 11.8%
– Worked outside county of residence: 10.9%
– Means of transportation: drove alone (77.6%), carpooled (10.6%), walked to work (2.4%), public transportation (1.0%), worked from home (6.6%)
You may also like: Most popular boy names in the 60s in Idaho
jfergusonphotos // Shutterstock
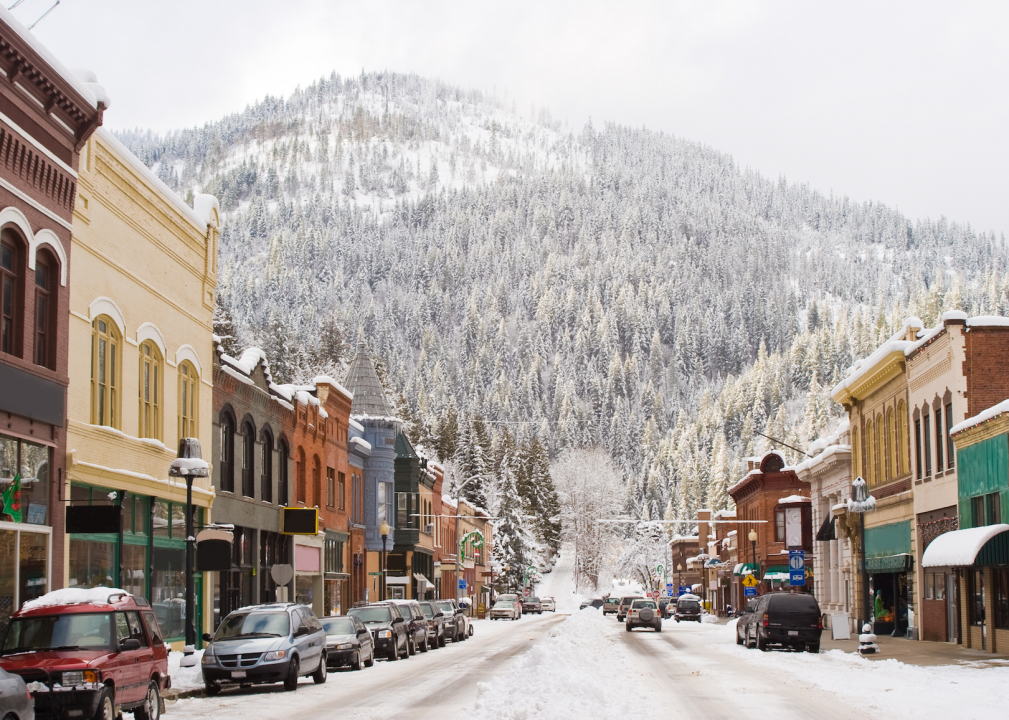
#14. Shoshone County
– Workers with 90+ minute commute: 2.7%
— 60+ minute commute: 9.7%
– Average commute time: 20.9 minutes
— 0.3 minutes shorter than state average
– Left for work from 12 a.m. to 6 a.m.: 28.6%
– Worked outside county of residence: 15.1%
– Means of transportation: drove alone (76.5%), carpooled (11.2%), walked to work (6.1%), public transportation (0.2%), worked from home (3.8%)

United States Department of Agriculture // Wikimedia Commons
#13. Owyhee County
– Workers with 90+ minute commute: 2.7%
— 60+ minute commute: 13.2%
– Average commute time: 27.6 minutes
— 6.4 minutes longer than state average
– Left for work from 12 a.m. to 6 a.m.: 20.7%
– Worked outside county of residence: 53.6%
– Means of transportation: drove alone (72.4%), carpooled (12.3%), walked to work (4.5%), public transportation (0.5%), worked from home (9.4%)
Kristen Taylor // Wikimedia Commons
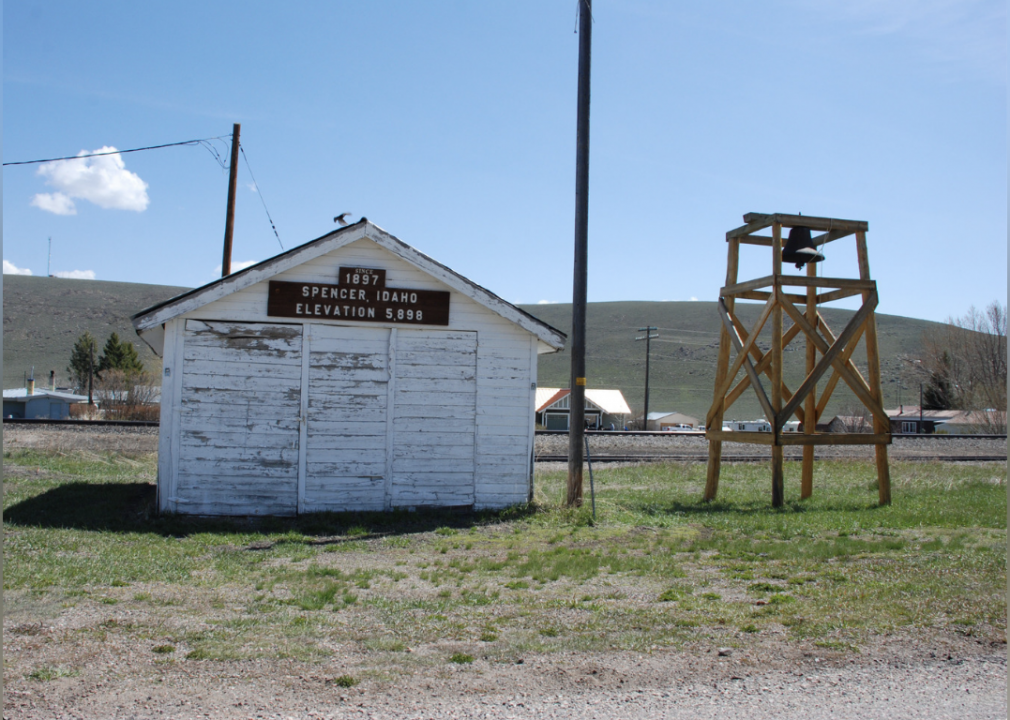
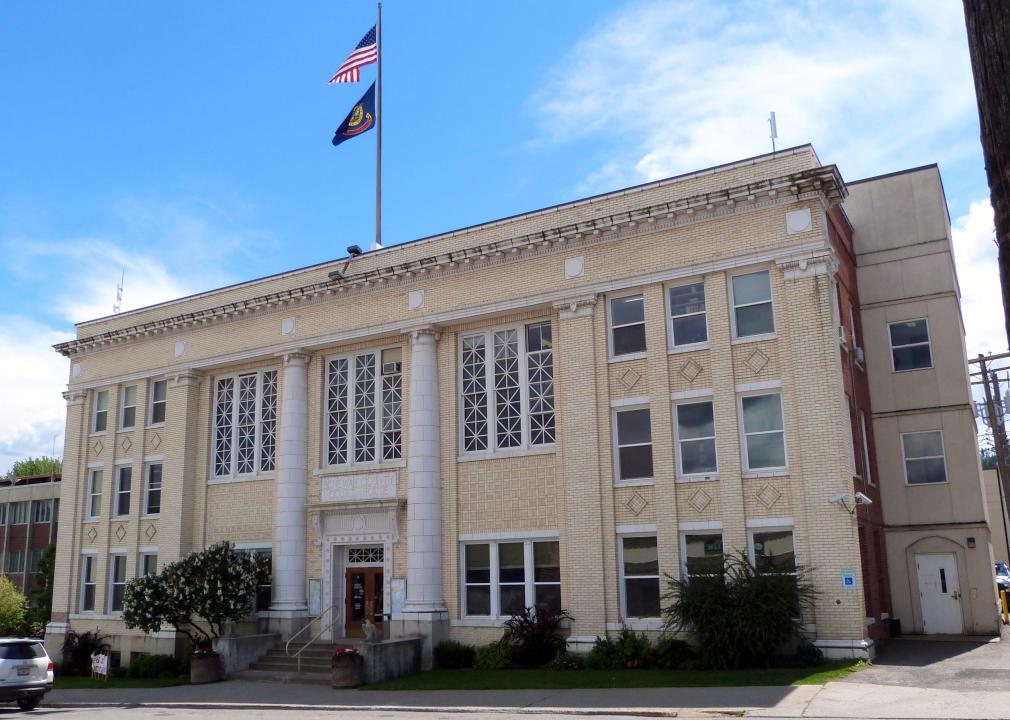
#12. Clark County
– Workers with 90+ minute commute: 2.9%
— 60+ minute commute: 12.6%
– Average commute time: 26.2 minutes
— 5.0 minutes longer than state average
– Left for work from 12 a.m. to 6 a.m.: 19.7%
– Worked outside county of residence: 37.2%
– Means of transportation: drove alone (70.7%), carpooled (12.6%), walked to work (7.3%), public transportation (0.0%), worked from home (9.4%)
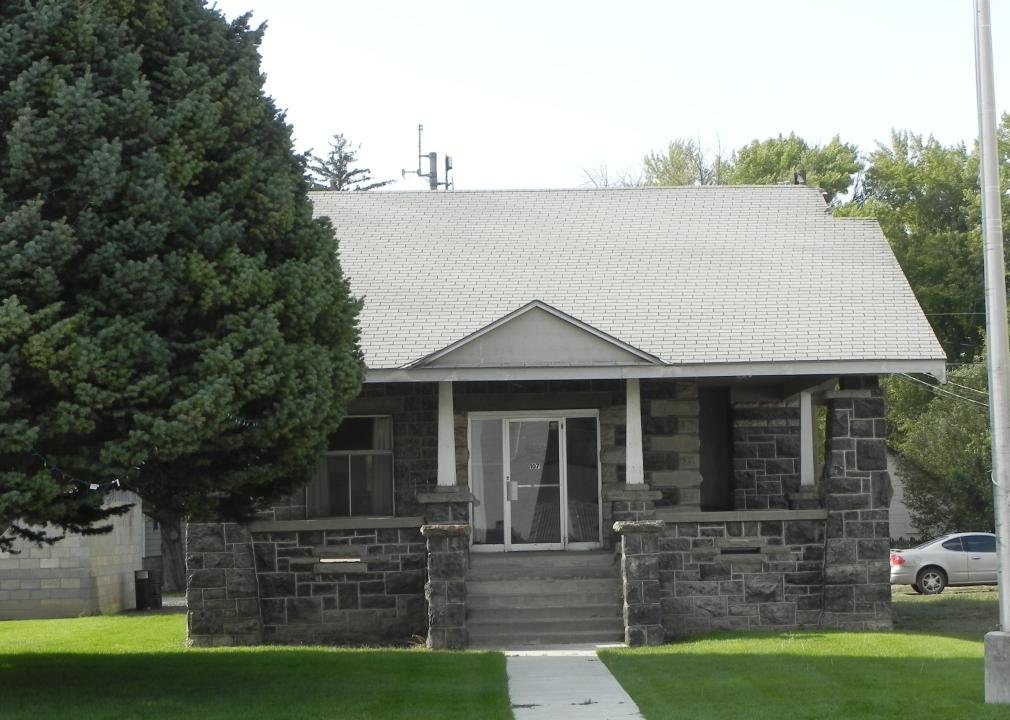
Tricia Simpson // Wikimedia Commons
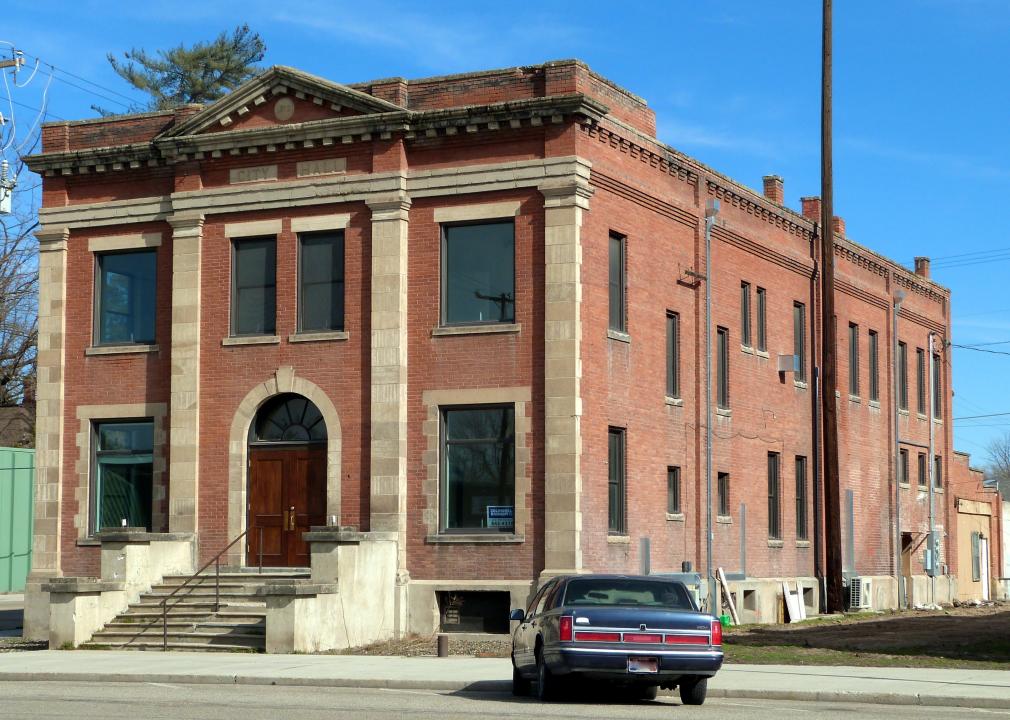
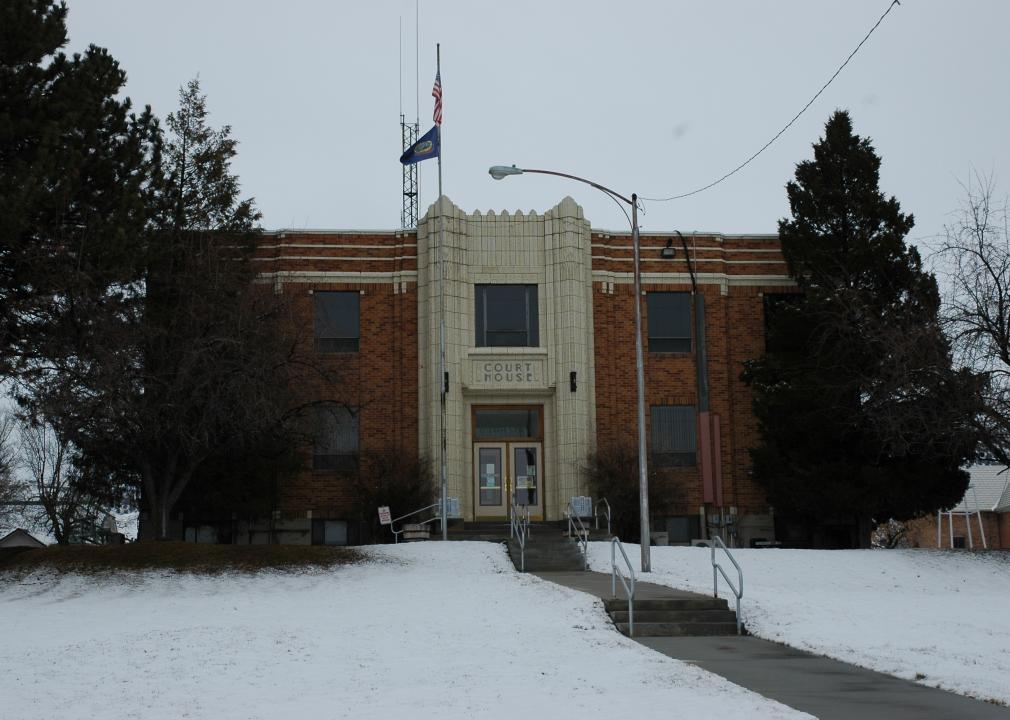
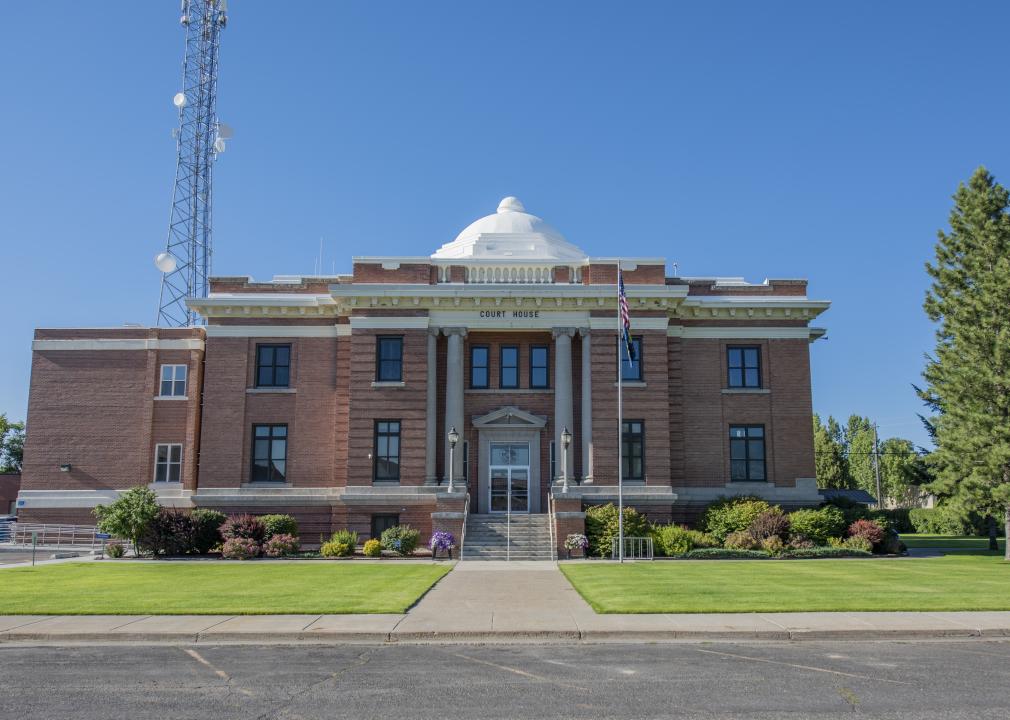
#11. Oneida County
– Workers with 90+ minute commute: 3.0%
— 60+ minute commute: 14.1%
– Average commute time: 24 minutes
— 2.8 minutes longer than state average
– Left for work from 12 a.m. to 6 a.m.: 32.3%
– Worked outside county of residence: 4.0%
– Means of transportation: drove alone (76.6%), carpooled (12.4%), walked to work (0.8%), public transportation (0.0%), worked from home (10.1%)

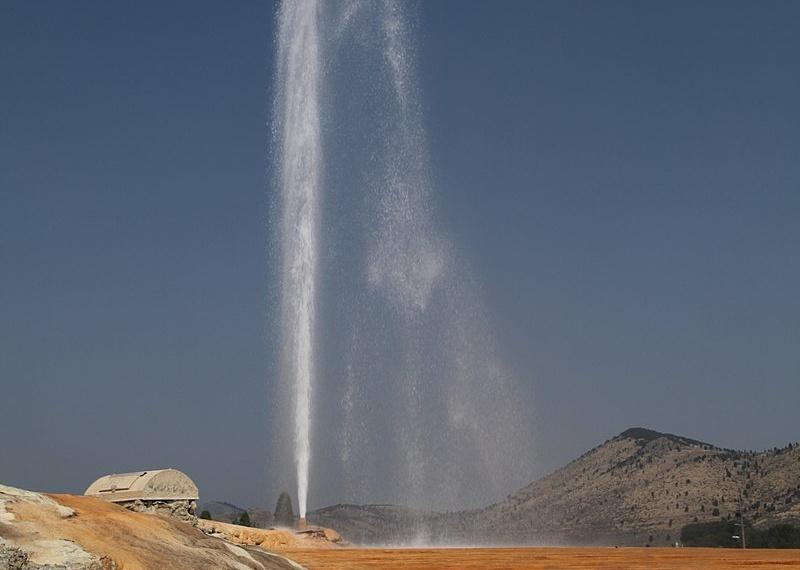
NPS photo // Wikimedia Commons
#10. Gooding County
– Workers with 90+ minute commute: 3.1%
— 60+ minute commute: 4.1%
– Average commute time: 21.8 minutes
— 0.6 minutes longer than state average
– Left for work from 12 a.m. to 6 a.m.: 11.1%
– Worked outside county of residence: 35.5%
– Means of transportation: drove alone (80.9%), carpooled (7.7%), walked to work (3.3%), public transportation (0.3%), worked from home (6.1%)
You may also like: Most popular baby names for boys of the last decade in Idaho
Sam Beebe // Wikimedia Commons
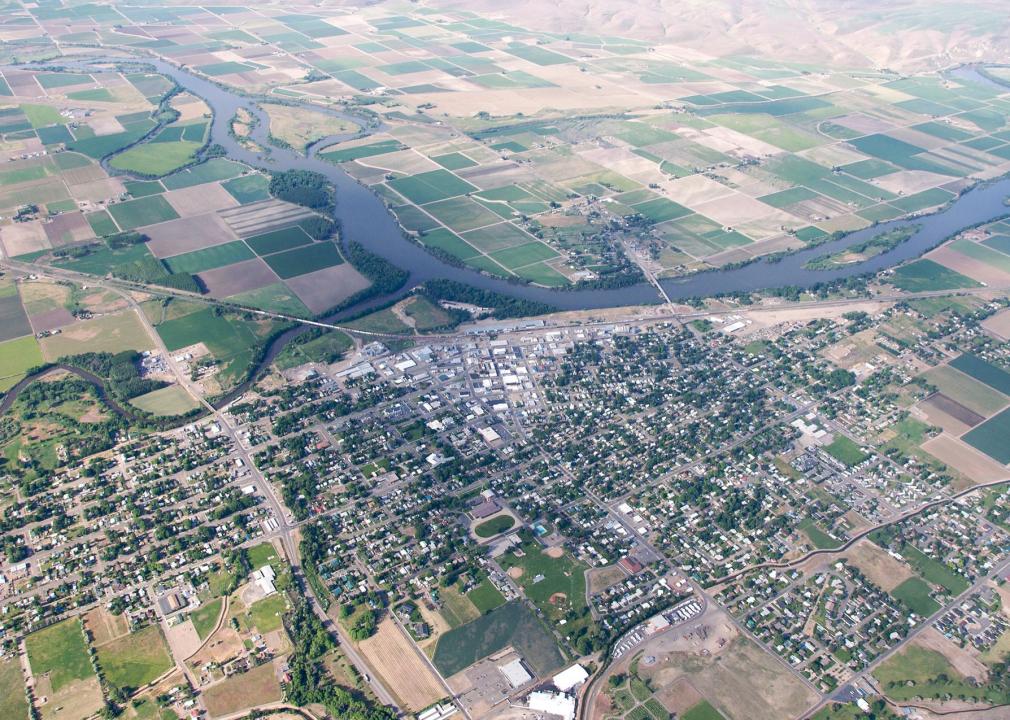
#9. Washington County
– Workers with 90+ minute commute: 3.1%
— 60+ minute commute: 6.0%
– Average commute time: 18 minutes
— 3.2 minutes shorter than state average
– Left for work from 12 a.m. to 6 a.m.: 15.7%
– Worked outside county of residence: 11.1%
– Means of transportation: drove alone (70.2%), carpooled (10.9%), walked to work (6.6%), public transportation (0.6%), worked from home (7.7%)
Ken Lund // Wikimedia Commons
#8. Adams County
– Workers with 90+ minute commute: 3.2%
— 60+ minute commute: 9.2%
– Average commute time: 22.9 minutes
— 1.7 minutes longer than state average
– Left for work from 12 a.m. to 6 a.m.: 12.5%
– Worked outside county of residence: 41.2%
– Means of transportation: drove alone (68.7%), carpooled (10.9%), walked to work (3.2%), public transportation (0.0%), worked from home (16.1%)
Aualliso // Wikimedia Commons
#7. Fremont County
– Workers with 90+ minute commute: 3.3%
— 60+ minute commute: 8.7%
– Average commute time: 22.9 minutes
— 1.7 minutes longer than state average
– Left for work from 12 a.m. to 6 a.m.: 9.6%
– Worked outside county of residence: 39.2%
– Means of transportation: drove alone (77.9%), carpooled (9.7%), walked to work (3.6%), public transportation (1.0%), worked from home (7.4%)
Federal Highway Administration // Wikimedia Commons
#6. Boundary County
– Workers with 90+ minute commute: 3.7%
— 60+ minute commute: 9.5%
– Average commute time: 24.3 minutes
— 3.1 minutes longer than state average
– Left for work from 12 a.m. to 6 a.m.: 23.8%
– Worked outside county of residence: 10.0%
– Means of transportation: drove alone (77.4%), carpooled (9.7%), walked to work (4.6%), public transportation (0.4%), worked from home (7.2%)
Ian Poellet // Wikimedia Commons
#5. Benewah County
– Workers with 90+ minute commute: 4.2%
— 60+ minute commute: 9.3%
– Average commute time: 21.2 minutes
— 0.0 minutes shorter than state average
– Left for work from 12 a.m. to 6 a.m.: 22.5%
– Worked outside county of residence: 19.6%
– Means of transportation: drove alone (78.8%), carpooled (10.2%), walked to work (4.0%), public transportation (0.8%), worked from home (4.2%)
You may also like: Best colleges in Idaho
PdxCobra // Wikimedia Commons
#4. Boise County
– Workers with 90+ minute commute: 4.4%
— 60+ minute commute: 17.9%
– Average commute time: 35.8 minutes
— 14.6 minutes longer than state average
– Left for work from 12 a.m. to 6 a.m.: 11.7%
– Worked outside county of residence: 50.3%
– Means of transportation: drove alone (67.9%), carpooled (13.1%), walked to work (5.5%), public transportation (0.0%), worked from home (10.7%)
![]()
Jon Roanhaus // Wikimedia Commons
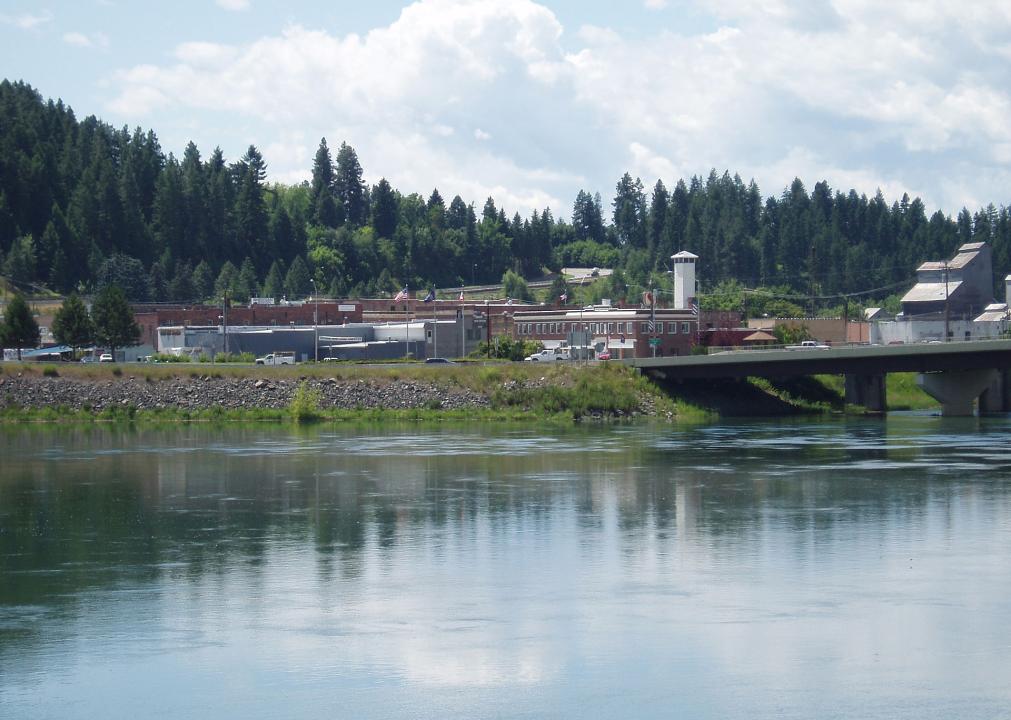
#3. Clearwater County
– Workers with 90+ minute commute: 4.8%
— 60+ minute commute: 15.4%
– Average commute time: 24 minutes
— 2.8 minutes longer than state average
– Left for work from 12 a.m. to 6 a.m.: 26.5%
– Worked outside county of residence: 15.5%
– Means of transportation: drove alone (76.0%), carpooled (9.0%), walked to work (4.9%), public transportation (0.2%), worked from home (7.1%)
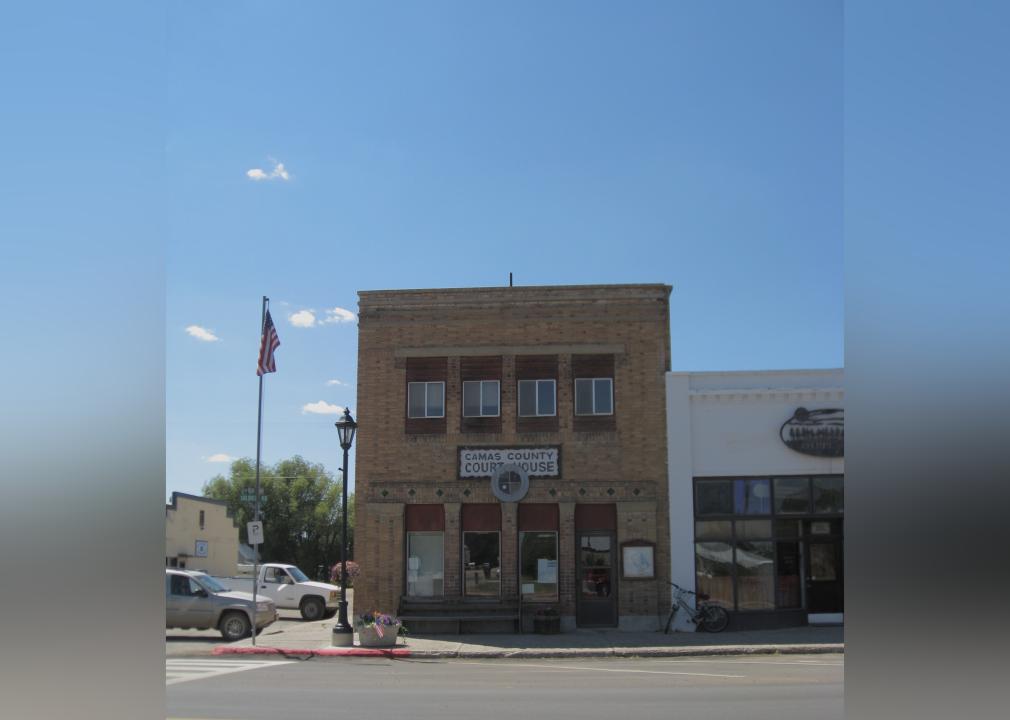
Cornellrockey04 // Wikimedia Commons
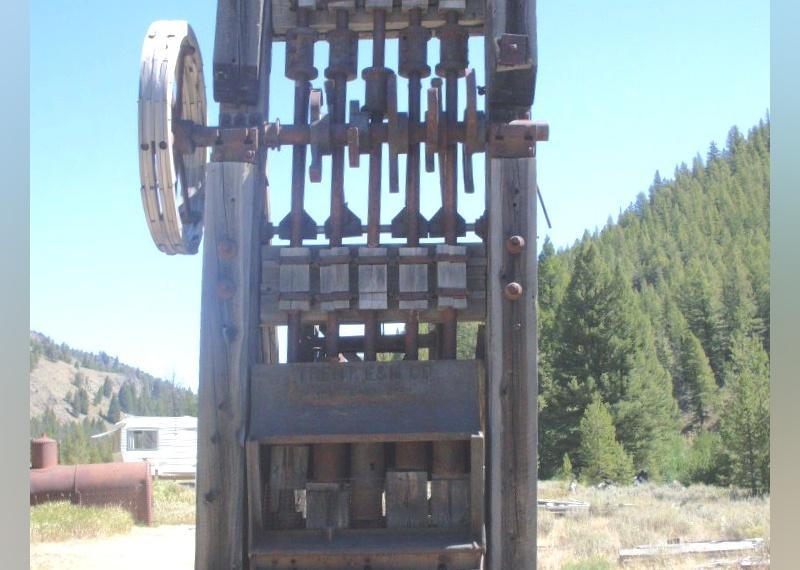
#2. Camas County
– Workers with 90+ minute commute: 8.4%
— 60+ minute commute: 30.6%
– Average commute time: 37.8 minutes
— 16.6 minutes longer than state average
– Left for work from 12 a.m. to 6 a.m.: 7.4%
– Worked outside county of residence: 54.2%
– Means of transportation: drove alone (73.9%), carpooled (8.8%), walked to work (0.0%), public transportation (0.0%), worked from home (16.9%)

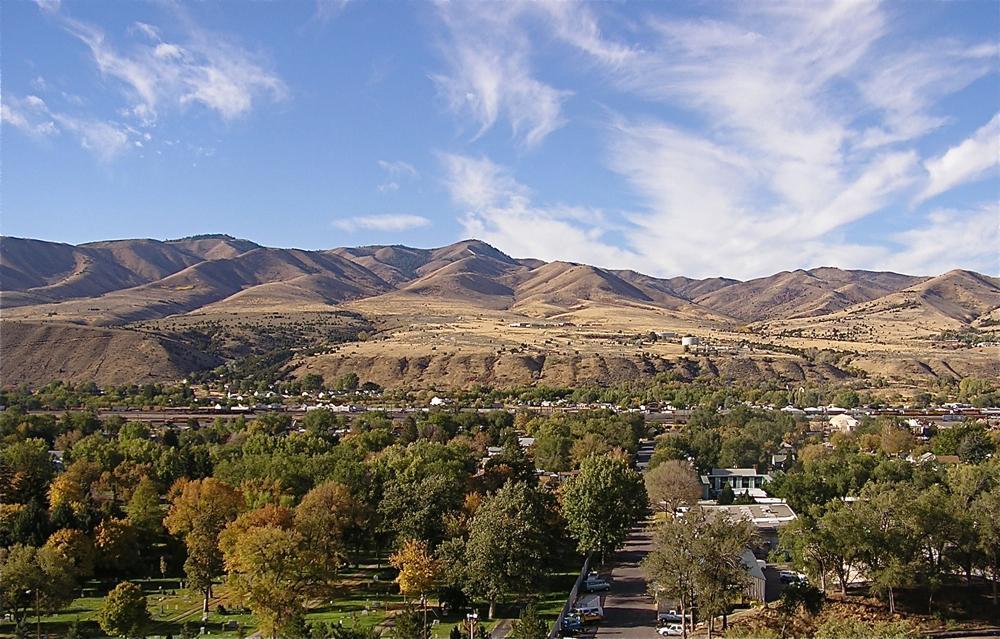
Tricia Simpson // Wikimedia Commons
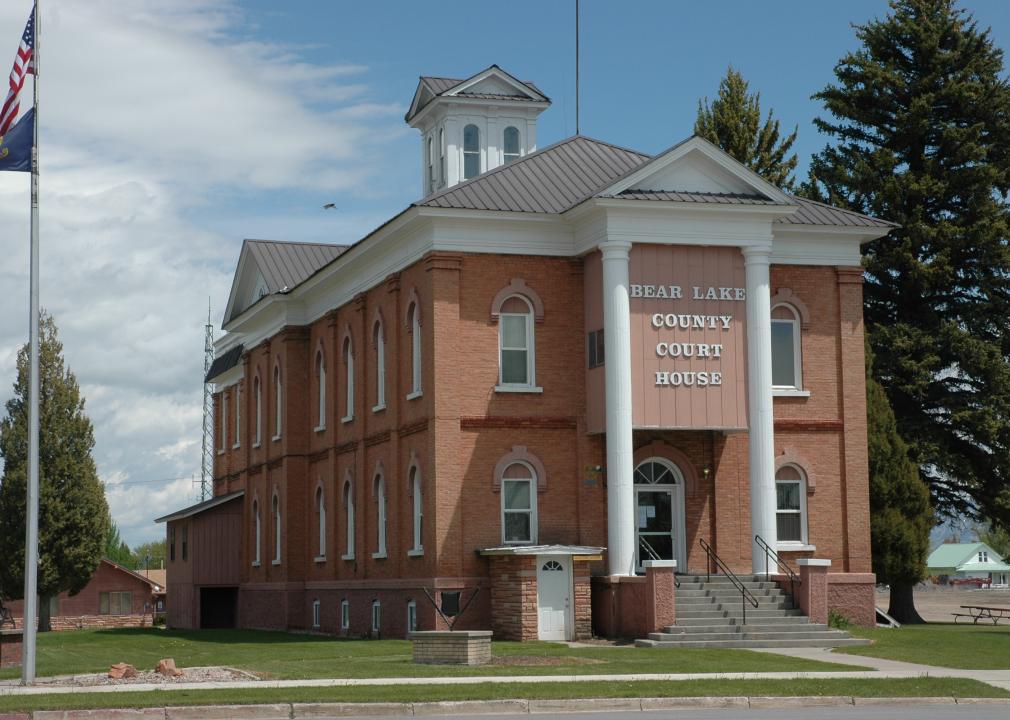
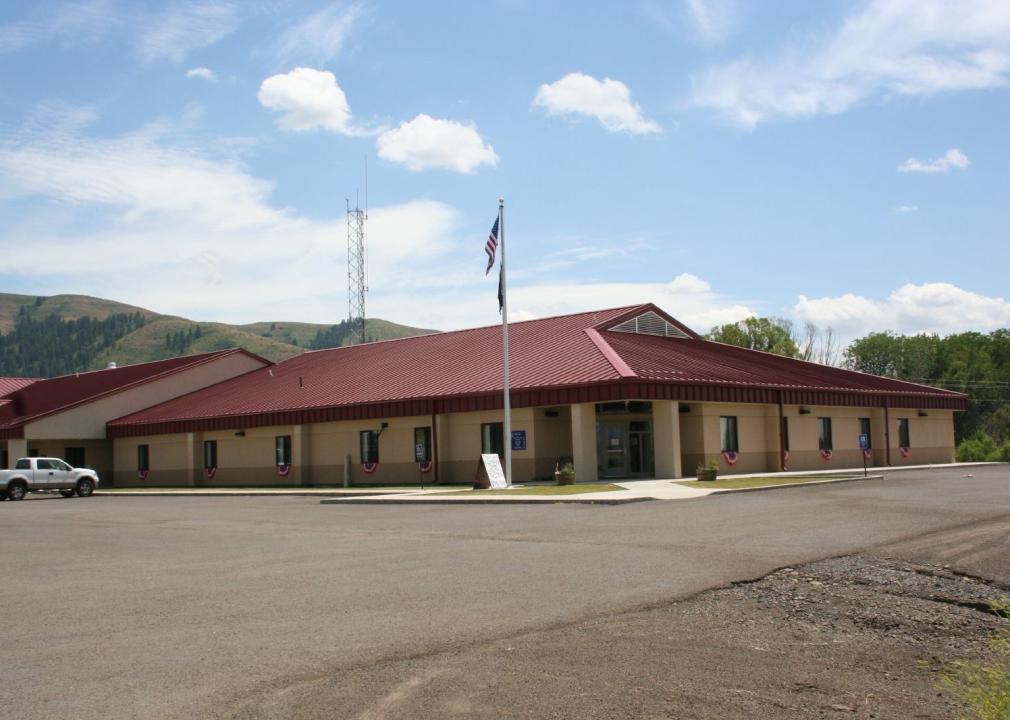
#1. Bear Lake County
– Workers with 90+ minute commute: 12.6%
— 60+ minute commute: 18.3%
– Average commute time: 30.8 minutes
— 9.6 minutes longer than state average
– Left for work from 12 a.m. to 6 a.m.: 24.6%
– Worked outside county of residence: 24.3%
– Means of transportation: drove alone (75.9%), carpooled (13.2%), walked to work (3.4%), public transportation (0.4%), worked from home (6.7%)