50 colleges where applications are on the rise compared to pre-COVID

Tero Vesalainen // Shutterstock
50 colleges where applications are on the rise compared to pre-COVID
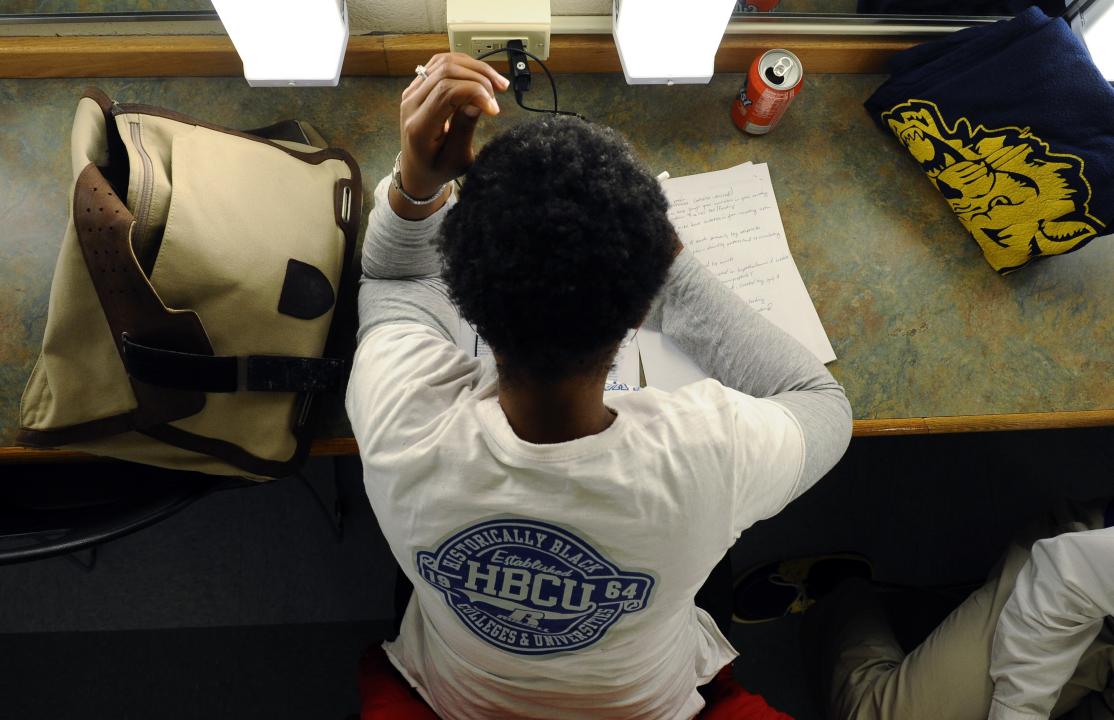
A student filling out a college application.
This summer, high school students worldwide will begin researching the colleges that best suit their ambitions for the future, sending millions of applications to their top schools by the fall.
Numerade analyzed National Center for Education Statistics data to rank the 50 colleges where applications are growing the fastest. To be included, colleges and universities had to receive at least 2,000 applications in the 2022-2023 school year and offer four-year degrees. They are ranked by the percent increase in applications from the 2019-2020 school year to the 2022-2023 school year, the latest data available.
College application volumes have grown steadily over the past decade, plateauing in 2020 and rising again the following year. The COVID-19 pandemic presented a blow to the college experience, altering it completely and pushing enrollees into online courses they didn’t intend to take. Applications have seen growth, but by 2022, around 1.5 million fewer students were enrolled in college than before the pandemic.
Some schools have continued to grow their applications by more than 100% from 2019-2022 despite survey data suggesting that the overall enrollment decline is primarily due to the belief that a college degree holds less value today than in previous decades. That’s despite evidence of a growing earnings gap between young people with college degrees and those without. The typical college degree recipient can earn $20,000 more annually when entering the workforce than their peers without a degree, according to the Bureau of Labor Statistics.
In the fall of 2022, prospective first-time undergraduate students sent more than 13 million applications to U.S. schools. Technical schools, as well as those focused on nursing and private Christian colleges, made up a number of the top schools for post-COVID application growth, according to NCES data.
Read on to see which U.S. colleges and universities saw the largest growth in applications, as well as their admissions growth.
![]()
James R. Martin // Shutterstock
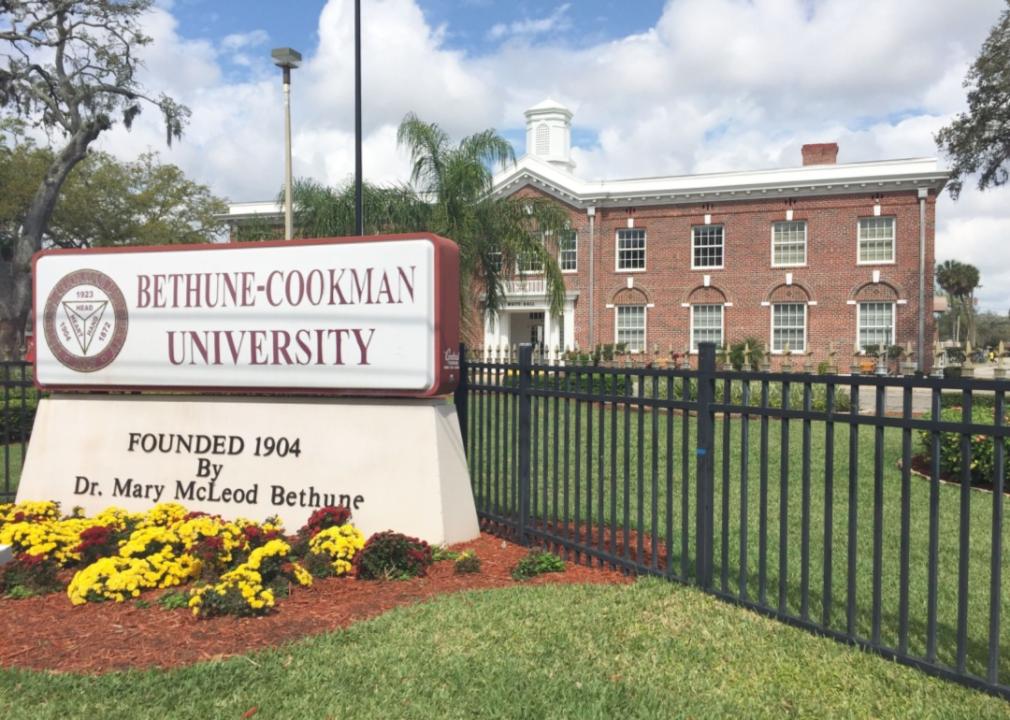
#50. Bethune-Cookman University
James R. Martin // Shutterstock
Located in Daytona Beach, Florida
-Total applicants in the 2022-23 school year: 12,818
— 81.0% more than in 2019
— 138.3% change from 2012
– Students admitted in the 2022-23 school year: 10,891
— 83.0% change from 2019
— 175.5% change from 2012
Canva
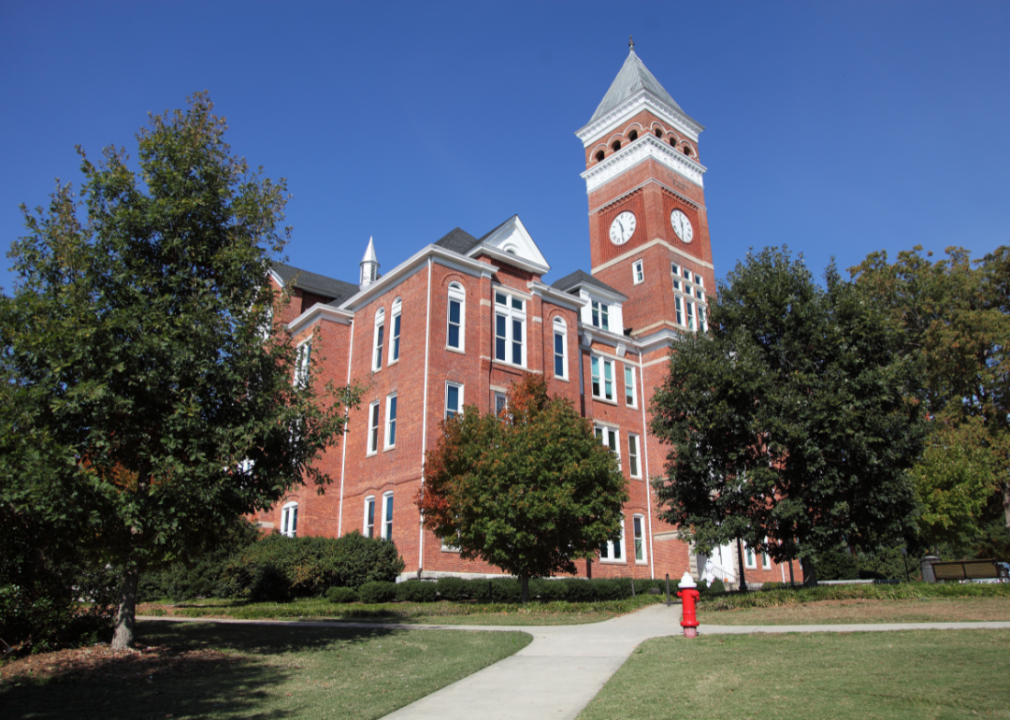
#49. Clemson University
Canva
Located in Clemson, South Carolina
-Total applicants in the 2022-23 school year: 52,819
— 81.7% more than in 2019
— 209.4% change from 2012
– Students admitted in the 2022-23 school year: 22,704
— 52.4% change from 2019
— 110.2% change from 2012
Wirestock Creators // Shutterstock
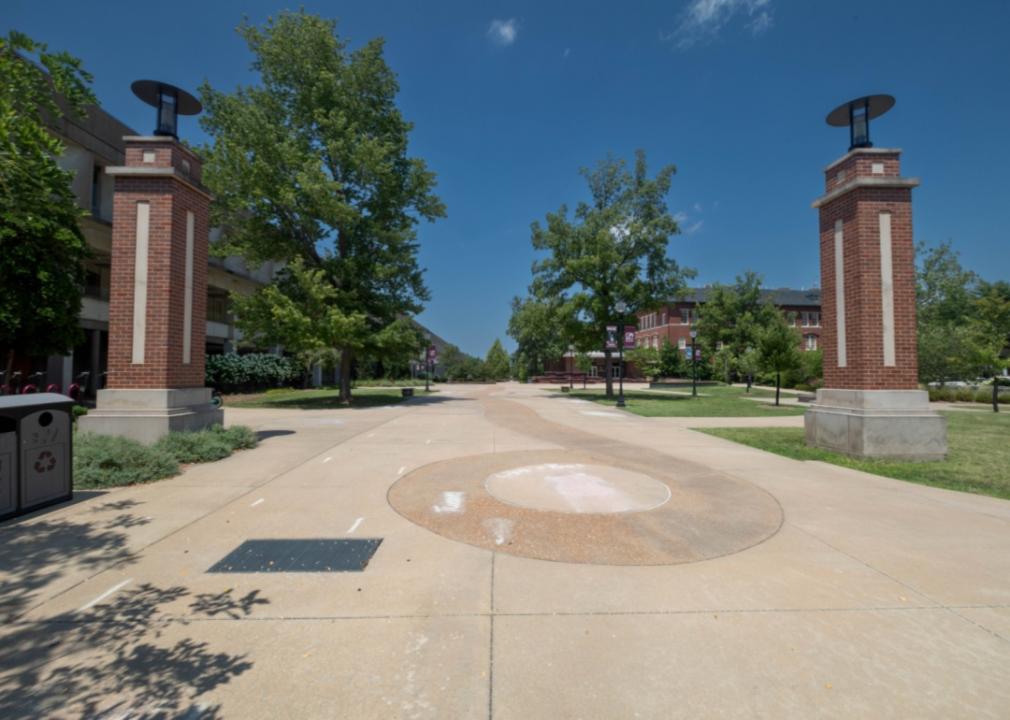
#48. Southern Illinois University-Carbondale
Wirestock Creators // Shutterstock
Located in Carbondale, Illinois
-Total applicants in the 2022-23 school year: 9,771
— 81.7% more than in 2019
— -32.8% change from 2012
– Students admitted in the 2022-23 school year: 8,940
— 150.5% change from 2019
— 19.6% change from 2012
Canva
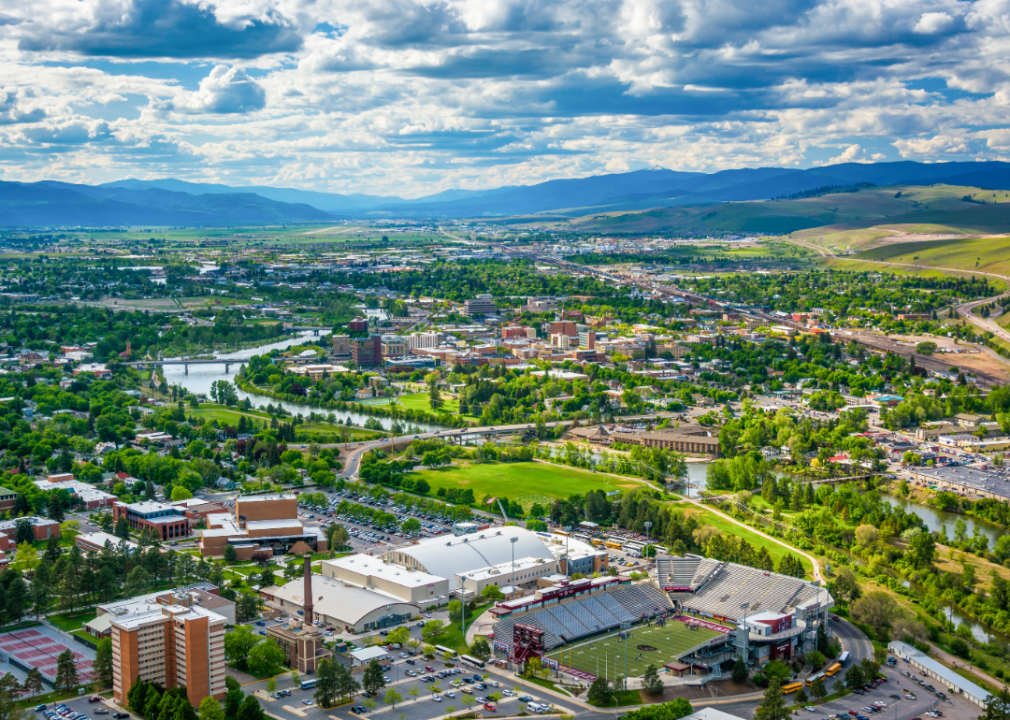
#47. The University of Montana
Canva
Located in Missoula, Montana
-Total applicants in the 2022-23 school year: 8,943
— 82.1% more than in 2019
— 67.9% change from 2012
– Students admitted in the 2022-23 school year: 8,530
— 84.9% change from 2019
— 70.4% change from 2012
Canva
#46. Schreiner University
Canva
Located in Kerrville, Texas
-Total applicants in the 2022-23 school year: 2,202
— 84.4% more than in 2019
— 187.1% change from 2012
– Students admitted in the 2022-23 school year: 1,876
— 68.6% change from 2019
— 156.6% change from 2012
Canva
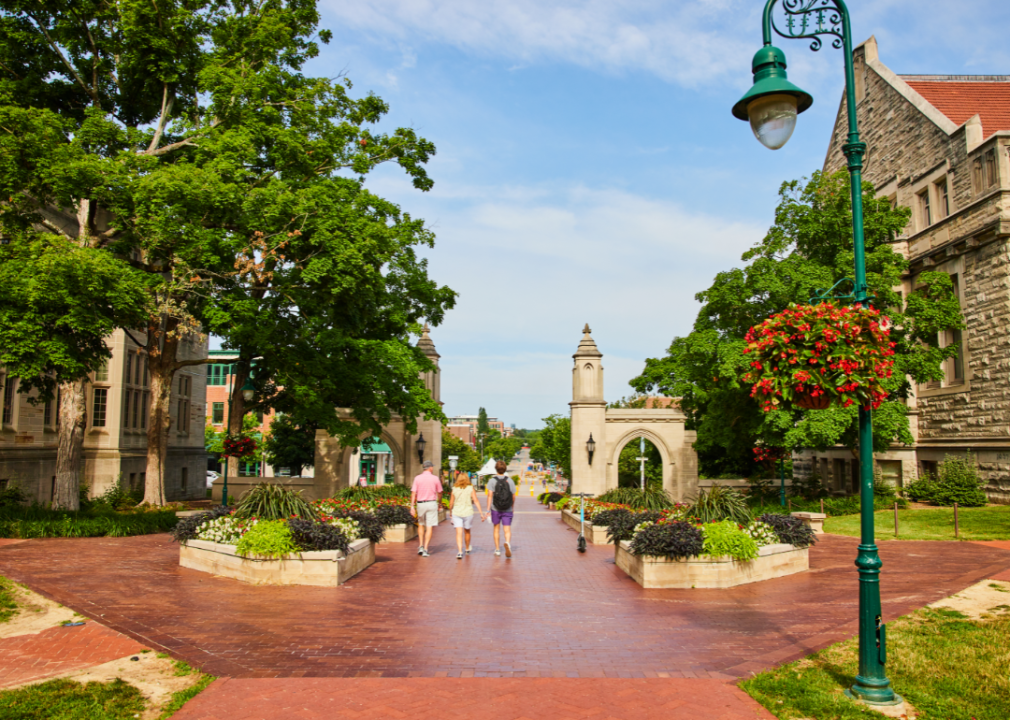
#45. Indiana State University
Canva
Located in Terre Haute, Indiana
-Total applicants in the 2022-23 school year: 18,531
— 85.2% more than in 2019
— 73.0% change from 2012
– Students admitted in the 2022-23 school year: 17,105
— 90.8% change from 2019
— 85.0% change from 2012
Susan Montgomery // Shutterstock
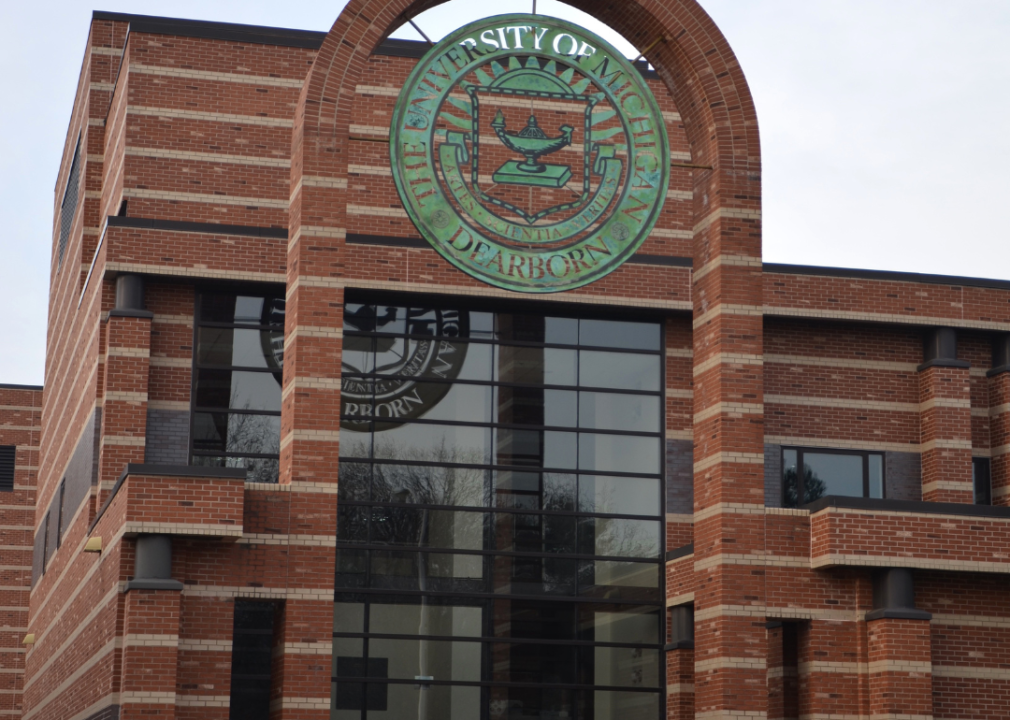
#44. University of Michigan-Dearborn
Susan Montgomery // Shutterstock
Located in Dearborn, Michigan
-Total applicants in the 2022-23 school year: 12,026
— 85.9% more than in 2019
— 158.5% change from 2012
– Students admitted in the 2022-23 school year: 6,506
— 62.3% change from 2019
— 124.3% change from 2012
Canva
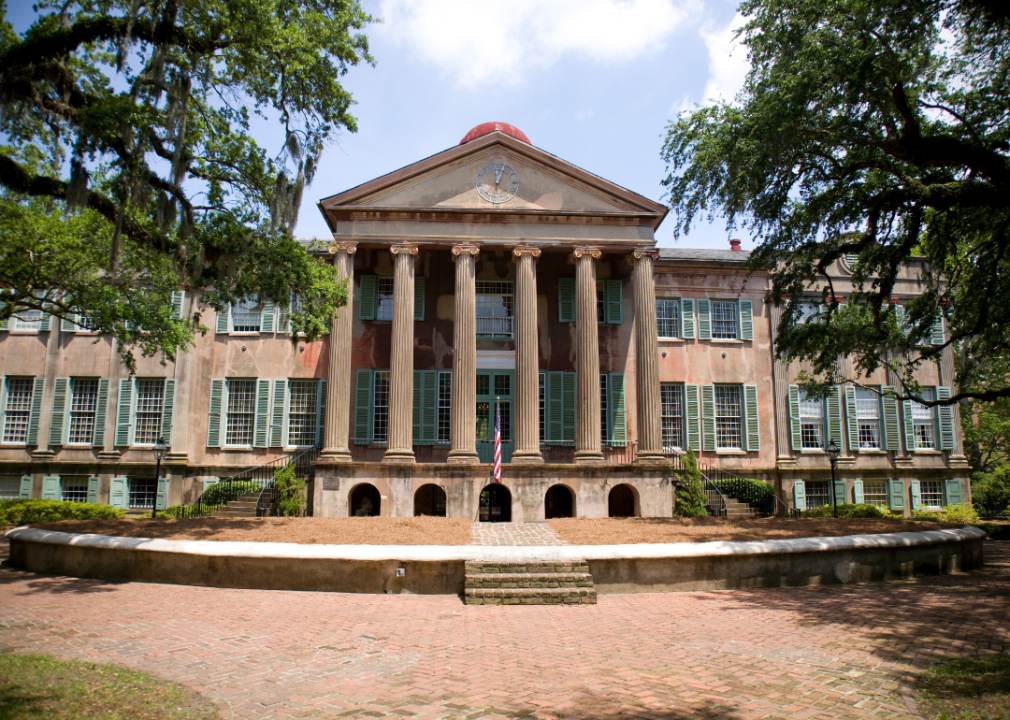
#43. College of Charleston
Canva
Located in Charleston, South Carolina
-Total applicants in the 2022-23 school year: 22,020
— 86.9% more than in 2019
— 98.6% change from 2012
– Students admitted in the 2022-23 school year: 16,666
— 80.6% change from 2019
— 104.5% change from 2012

Canva
#42. The College of Idaho
Canva
Located in Caldwell, Idaho
-Total applicants in the 2022-23 school year: 4,490
— 87.2% more than in 2019
— 223.5% change from 2012
– Students admitted in the 2022-23 school year: 2,044
— 75.3% change from 2019
— 126.9% change from 2012
quiggyt4 // Shutterstock
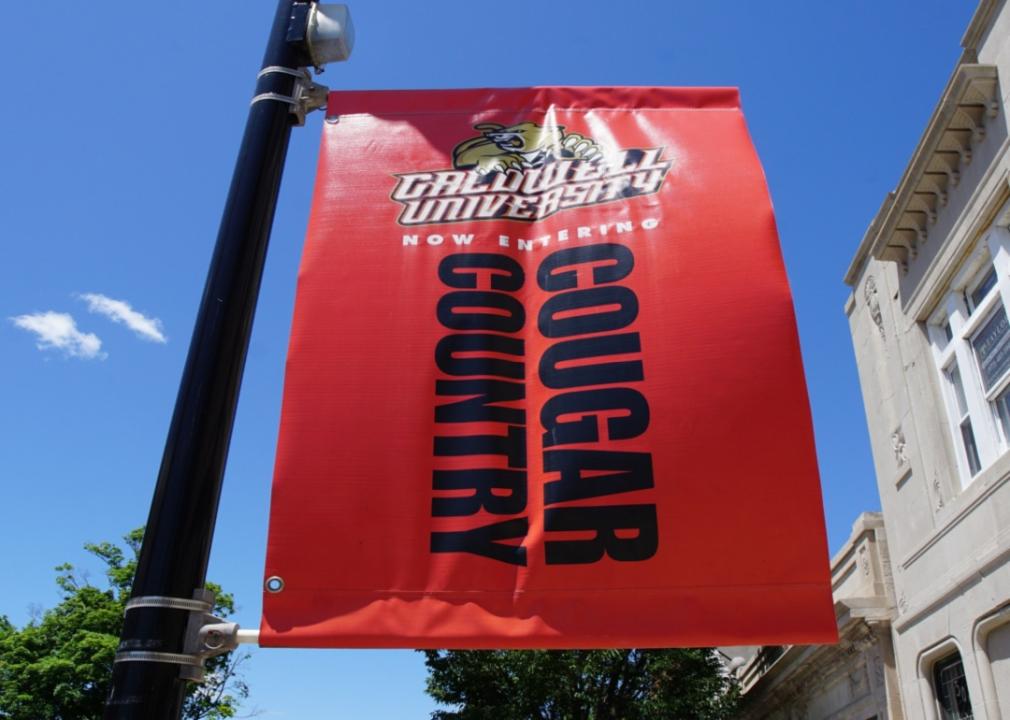
#41. Caldwell University
quiggyt4 // Shutterstock
Located in Caldwell, New Jersey
-Total applicants in the 2022-23 school year: 6,649
— 88.5% more than in 2019
— 153.3% change from 2012
– Students admitted in the 2022-23 school year: 4,413
— 34.2% change from 2019
— 174.4% change from 2012
Canva
#40. Grace College and Theological Seminary
Canva
Located in Winona Lake, Indiana
-Total applicants in the 2022-23 school year: 4,071
— 89.4% more than in 2019
— 64.8% change from 2012
– Students admitted in the 2022-23 school year: 3,445
— 100.6% change from 2019
— 53.2% change from 2012
John Arehart // Shutterstock
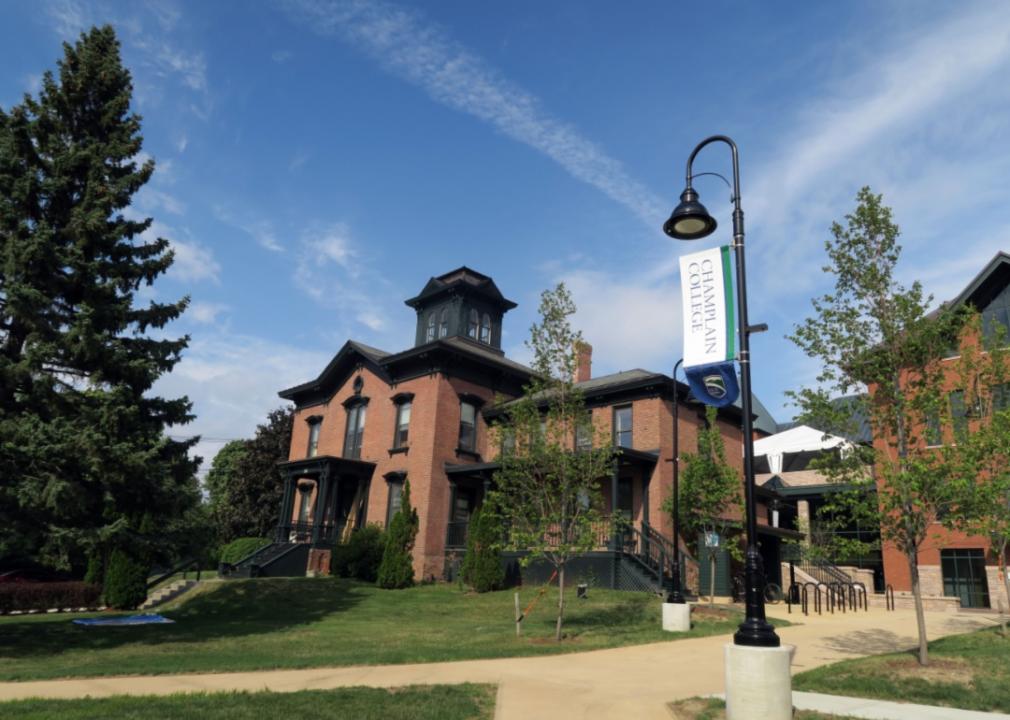
#39. Champlain College
John Arehart // Shutterstock
Located in Burlington, Vermont
-Total applicants in the 2022-23 school year: 6,940
— 91.2% more than in 2019
— 56.2% change from 2012
– Students admitted in the 2022-23 school year: 3,864
— 25.0% change from 2019
— 17.6% change from 2012
Joe Koshollek/NCAA Photos // Getty Images
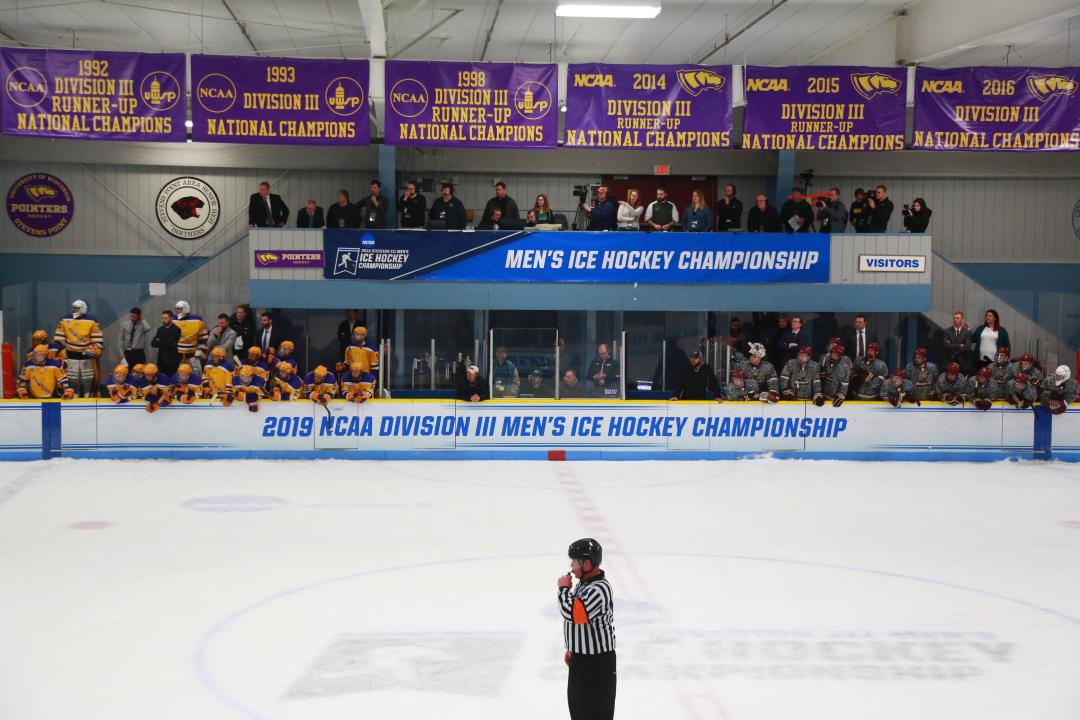
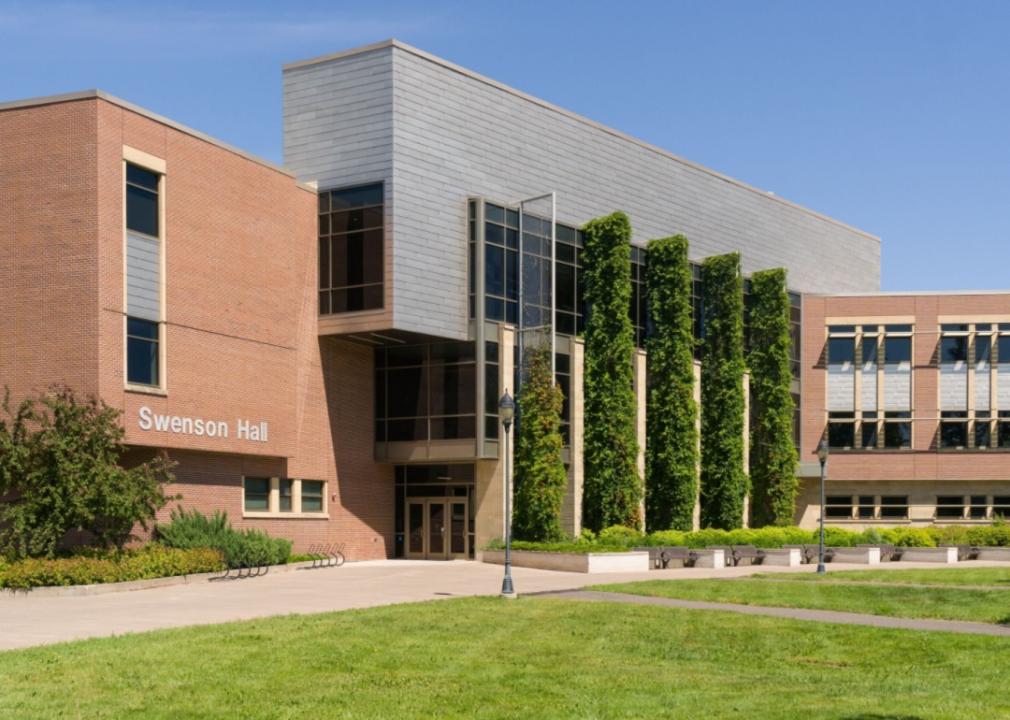
#38. University of Wisconsin-Stevens Point
Joe Koshollek/NCAA Photos // Getty Images
Located in Stevens Point, Wisconsin
-Total applicants in the 2022-23 school year: 8,120
— 94.0% more than in 2019
— 59.4% change from 2012
– Students admitted in the 2022-23 school year: 7,231
— 104.4% change from 2019
— 87.8% change from 2012
Ken Wolter // Shutterstock
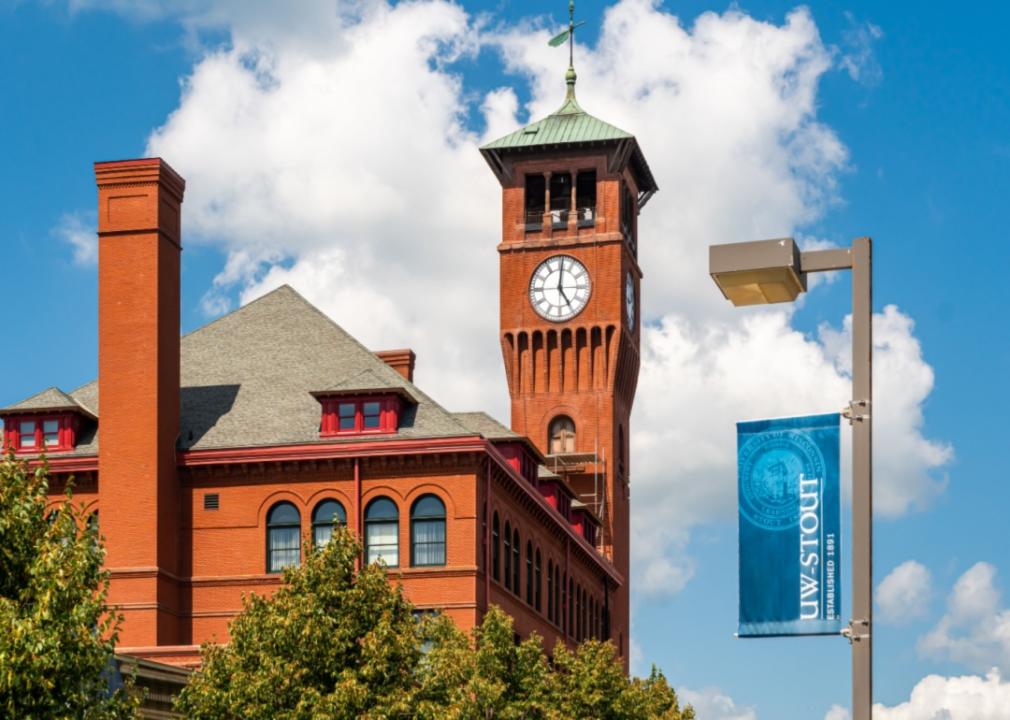
#37. University of Wisconsin-Stout
Ken Wolter // Shutterstock
Located in Menomonie, Wisconsin
-Total applicants in the 2022-23 school year: 6,231
— 94.6% more than in 2019
— 83.8% change from 2012
– Students admitted in the 2022-23 school year: 5,378
— 85.5% change from 2019
— 79.5% change from 2012
Chad Robertson Media // Shutterstock
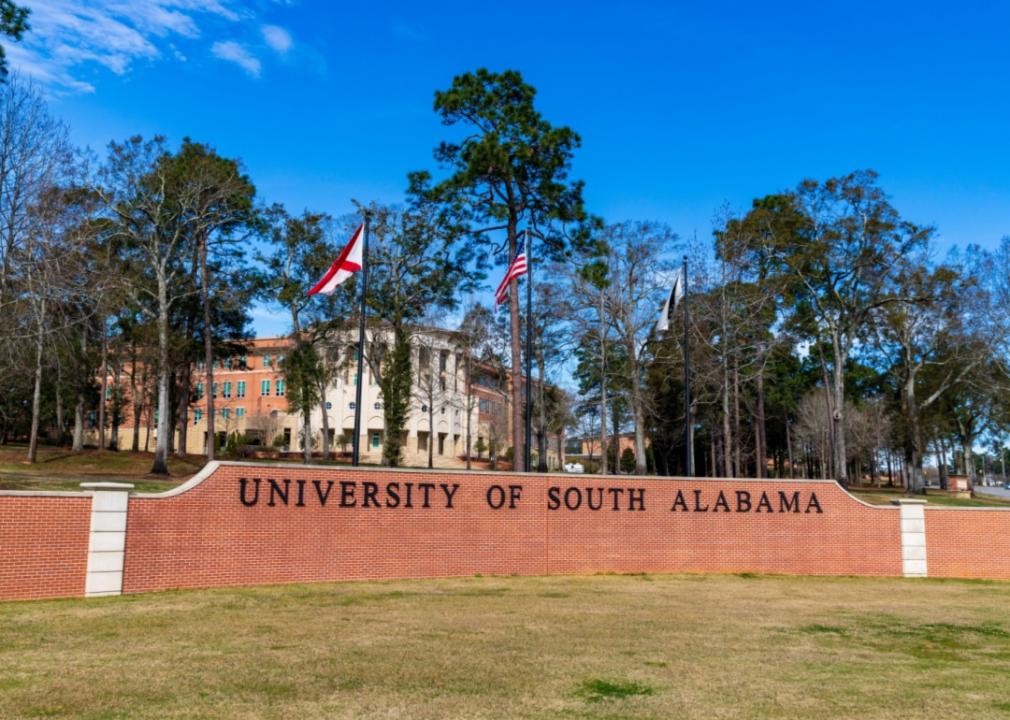
#36. University of South Alabama
Chad Robertson Media // Shutterstock
Located in Mobile, Alabama
-Total applicants in the 2022-23 school year: 12,550
— 97.6% more than in 2019
— 163.1% change from 2012
– Students admitted in the 2022-23 school year: 8,203
— 64.2% change from 2019
— 97.2% change from 2012
Ken Wolter // Shutterstock
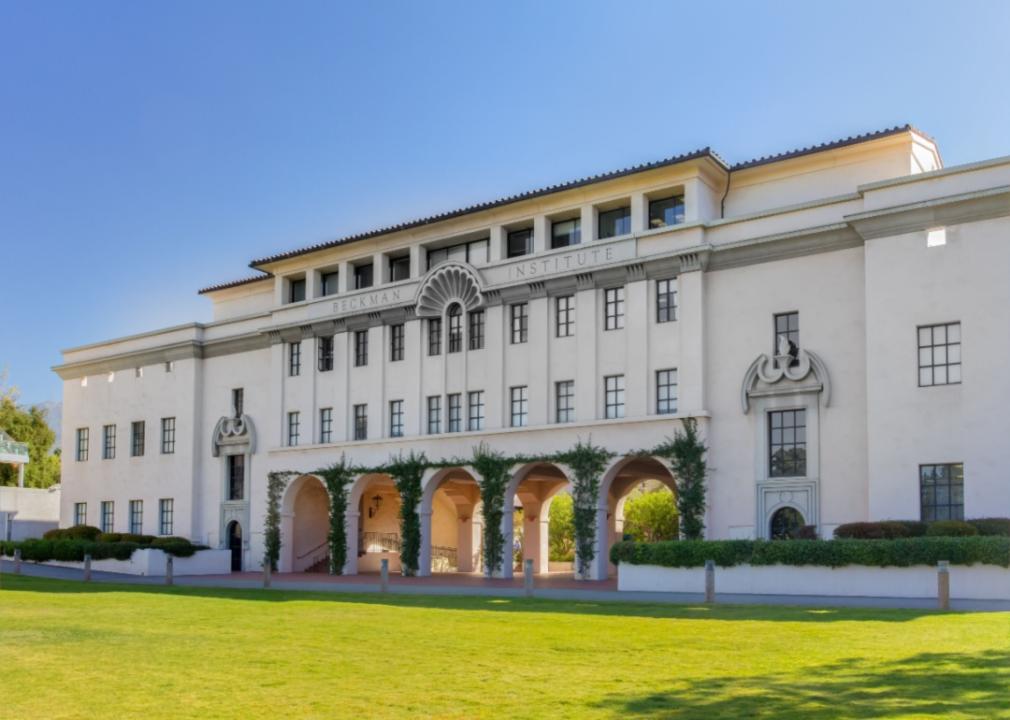
#35. California Institute of Technology
Ken Wolter // Shutterstock
Located in Pasadena, California
-Total applicants in the 2022-23 school year: 16,626
— 98.7% more than in 2019
— 218.2% change from 2012
– Students admitted in the 2022-23 school year: 448
— -16.6% change from 2019
— -32.8% change from 2012
Ken Wolter // Shutterstock
#34. University of Wisconsin-Superior
Ken Wolter // Shutterstock
Located in Superior, Wisconsin
-Total applicants in the 2022-23 school year: 2,319
— 98.9% more than in 2019
— 139.3% change from 2012
– Students admitted in the 2022-23 school year: 2,217
— 131.9% change from 2019
— 156.0% change from 2012
University of College // Shutterstock
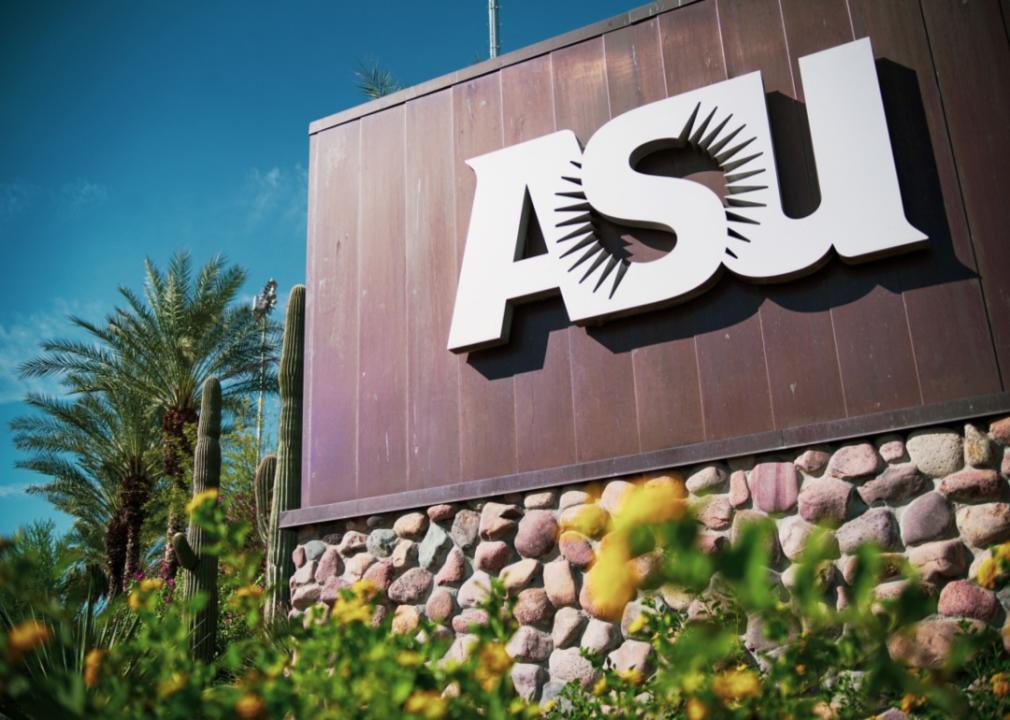
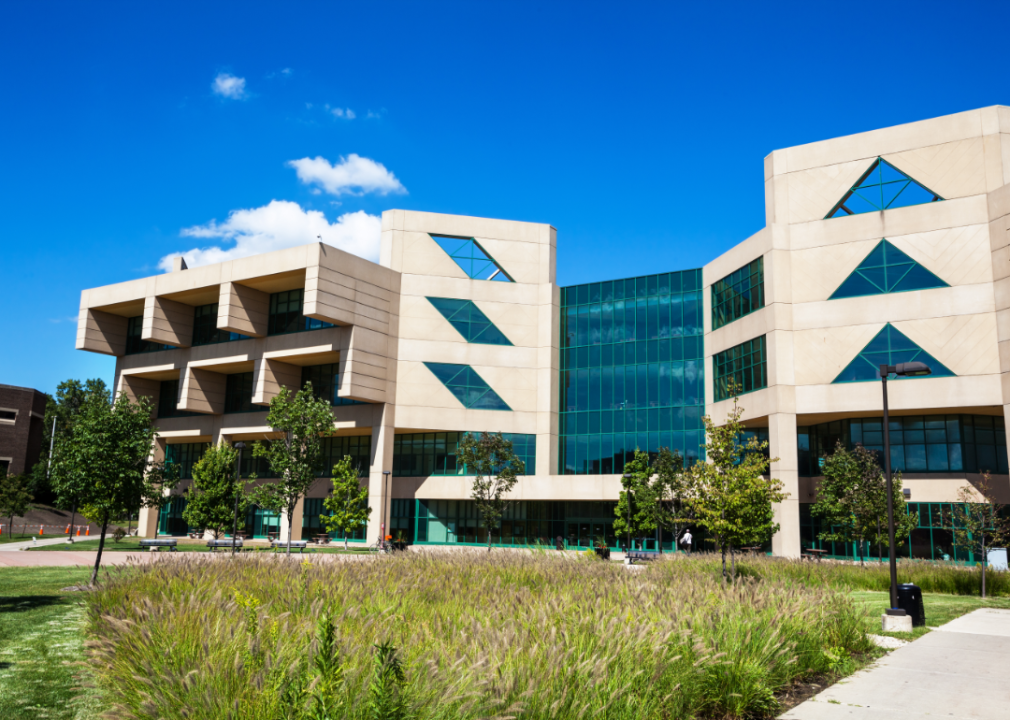
#33. Arizona State University Campus Immersion
University of College // Shutterstock
Located in Tempe, Arizona
-Total applicants in the 2022-23 school year: 68,789
— 101.2% more than in 2019
— 131.4% change from 2012
– Students admitted in the 2022-23 school year: 61,739
— 108.8% change from 2019
— 133.6% change from 2012
Scott Taetsch/NCAA Photos // Getty Images
#32. Northwest Nazarene University
Scott Taetsch/NCAA Photos // Getty Images
Located in Nampa, Idaho
-Total applicants in the 2022-23 school year: 3,394
— 103.7% more than in 2019
— 241.8% change from 2012
– Students admitted in the 2022-23 school year: 2,993
— 110.0% change from 2019
— 348.7% change from 2012
Jahi Chikwendiu/The Washington Post // Getty Images
#31. Fort Valley State University
Jahi Chikwendiu/The Washington Post // Getty Images
Located in Fort Valley, Georgia
-Total applicants in the 2022-23 school year: 6,247
— 104.2% more than in 2019
— -14.9% change from 2012
– Students admitted in the 2022-23 school year: 2,692
— 69.8% change from 2019
— 14.9% change from 2012
Anna Moneymaker // Getty Images
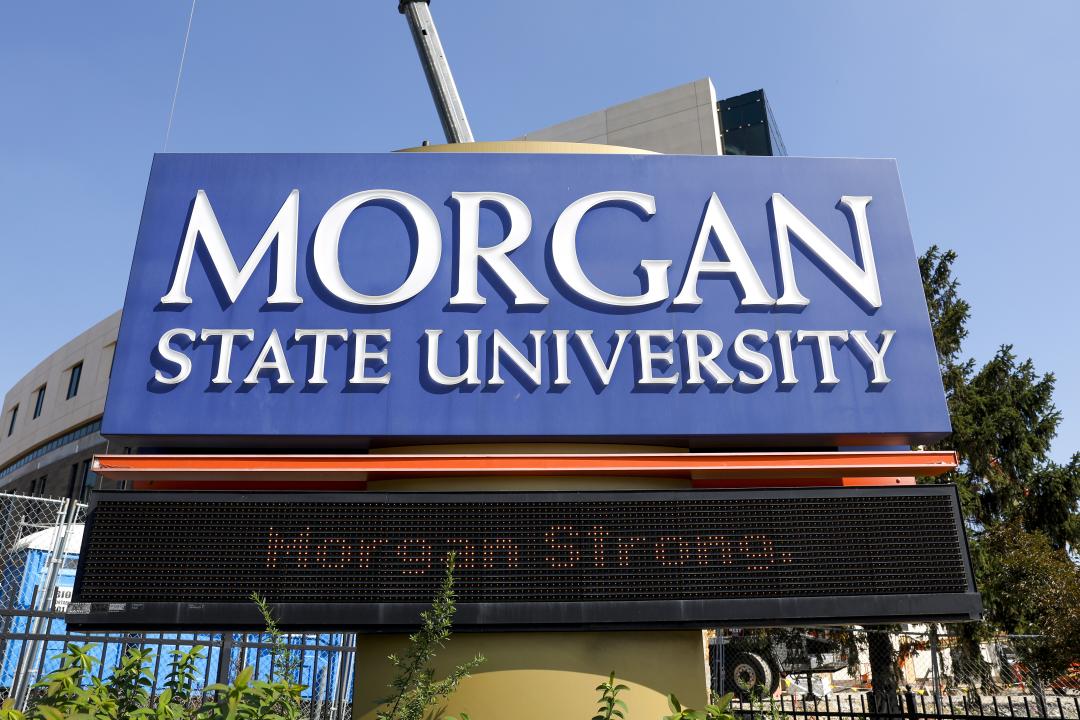
#30. Morgan State University
Anna Moneymaker // Getty Images
Located in Baltimore
-Total applicants in the 2022-23 school year: 16,845
— 106.6% more than in 2019
— 233.5% change from 2012
– Students admitted in the 2022-23 school year: 14,382
— 160.0% change from 2019
— 383.6% change from 2012
denton.loving // Shutterstock
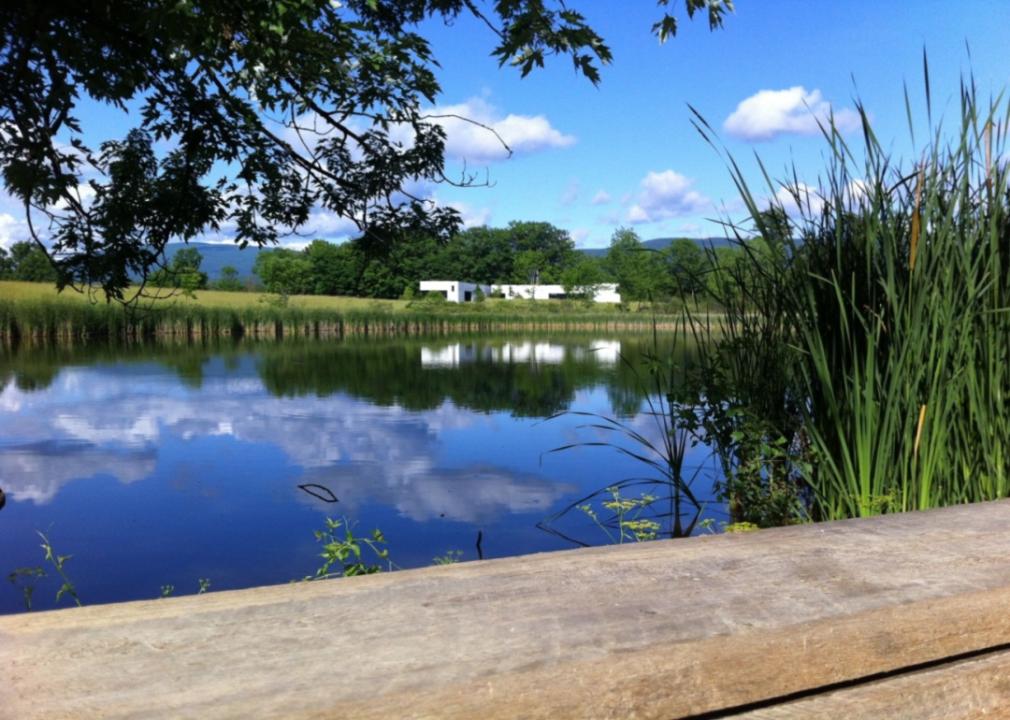
#29. Bennington College
denton.loving // Shutterstock
Located in Bennington, Vermont
-Total applicants in the 2022-23 school year: 2,801
— 108.4% more than in 2019
— 126.6% change from 2012
– Students admitted in the 2022-23 school year: 1,269
— 55.3% change from 2019
— 62.9% change from 2012
James Aloysius Mahan V // Shutterstock
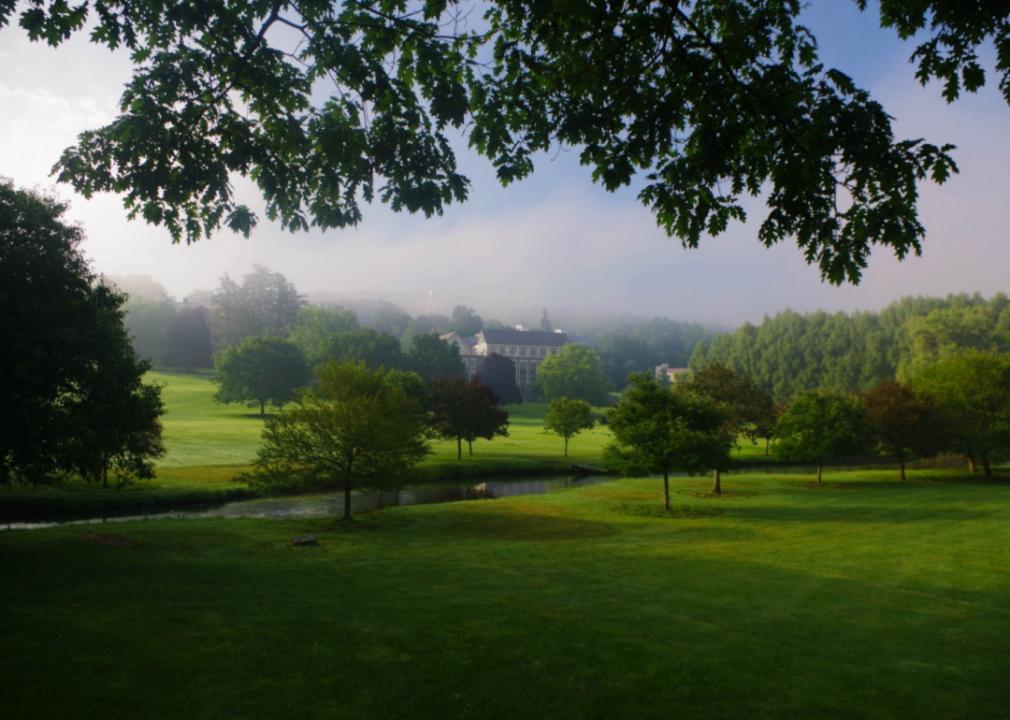
#28. Colgate University
James Aloysius Mahan V // Shutterstock
Located in Hamilton, New York
-Total applicants in the 2022-23 school year: 21,109
— 112.1% more than in 2019
— 170.7% change from 2012
– Students admitted in the 2022-23 school year: 2,624
— 16.8% change from 2019
— 14.6% change from 2012
Spiroview Inc // Shutterstock
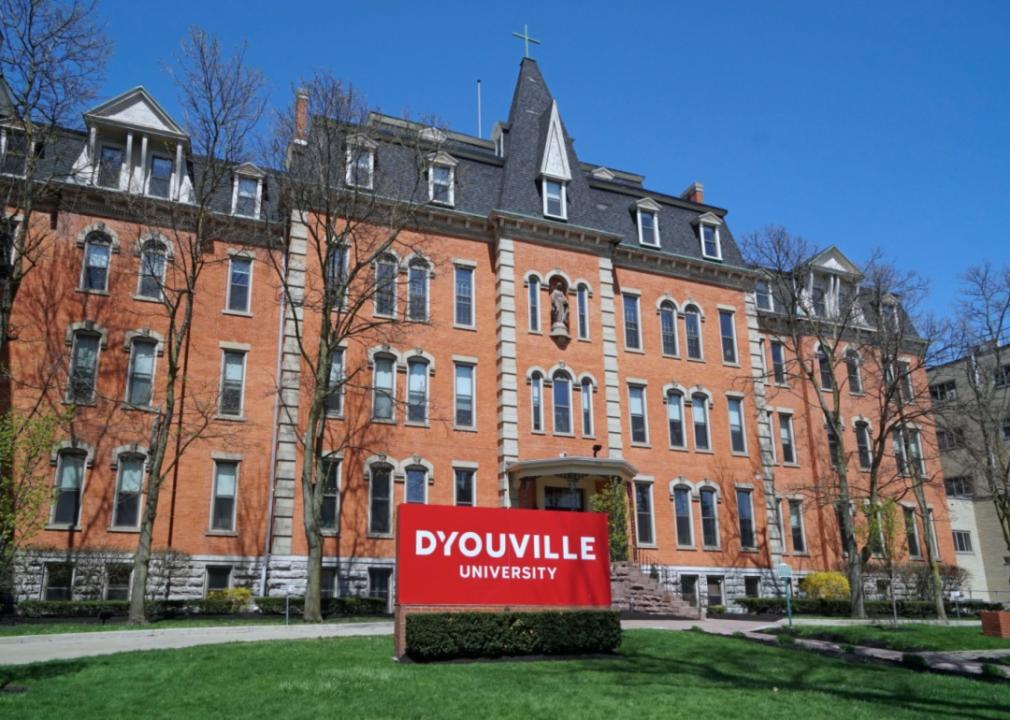
#27. D’Youville University
Spiroview Inc // Shutterstock
Located in Buffalo, New York
-Total applicants in the 2022-23 school year: 3,115
— 116.5% more than in 2019
— 174.4% change from 2012
– Students admitted in the 2022-23 school year: 2,618
— 106.6% change from 2019
— 180.6% change from 2012
Rosemarie Mosteller // Shutterstock
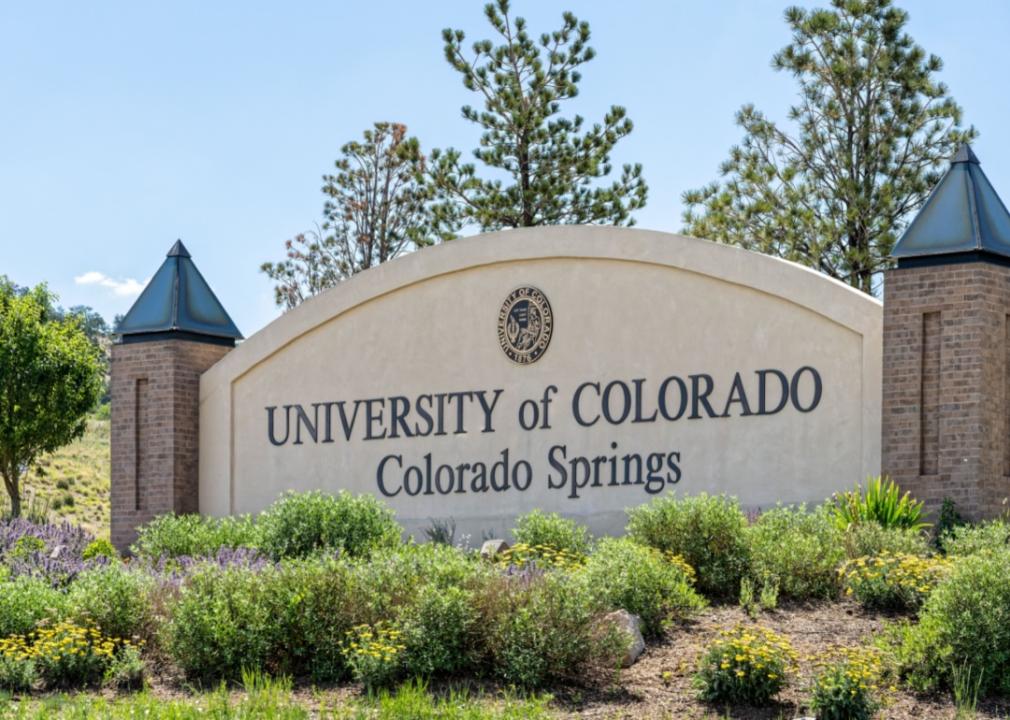
#26. University of Colorado Colorado Springs
Rosemarie Mosteller // Shutterstock
Located in Colorado Springs, Colorado
-Total applicants in the 2022-23 school year: 14,751
— 119.2% more than in 2019
— 66.7% change from 2012
– Students admitted in the 2022-23 school year: 12,504
— 113.2% change from 2019
— 137.1% change from 2012

Canva
#25. Anderson University
Canva
Located in Anderson, South Carolina
-Total applicants in the 2022-23 school year: 5,043
— 121.5% more than in 2019
— 188.2% change from 2012
– Students admitted in the 2022-23 school year: 2,289
— 46.3% change from 2019
— 83.7% change from 2012
Rob Hainer // Shutterstock
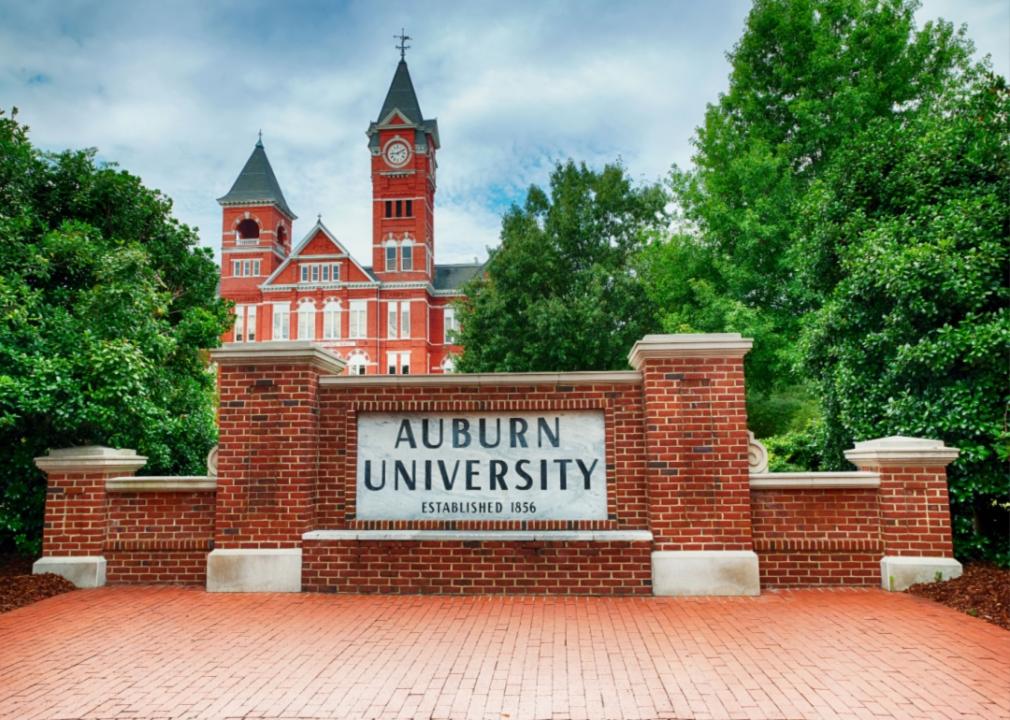
#24. Auburn University
Rob Hainer // Shutterstock
Located in Auburn, Alabama
-Total applicants in the 2022-23 school year: 45,693
— 126.1% more than in 2019
— 161.7% change from 2012
– Students admitted in the 2022-23 school year: 19,988
— 22.6% change from 2019
— 48.2% change from 2012

Canva
#23. Bethany College
Canva
Located in Bethany, West Virginia
-Total applicants in the 2022-23 school year: 2,651
— 130.5% more than in 2019
— 74.1% change from 2012
– Students admitted in the 2022-23 school year: 1,721
— 57.0% change from 2019
— 162.7% change from 2012
Education Images/Universal Images Group // Getty Images
#22. Lewis-Clark State College
Education Images/Universal Images Group // Getty Images
Located in Lewiston, Idaho
-Total applicants in the 2022-23 school year: 3,938
— 134.0% more than in 2019
— 291.1% change from 2012
– Students admitted in the 2022-23 school year: 3,417
— 103.5% change from 2019
— 242.4% change from 2012
Canva
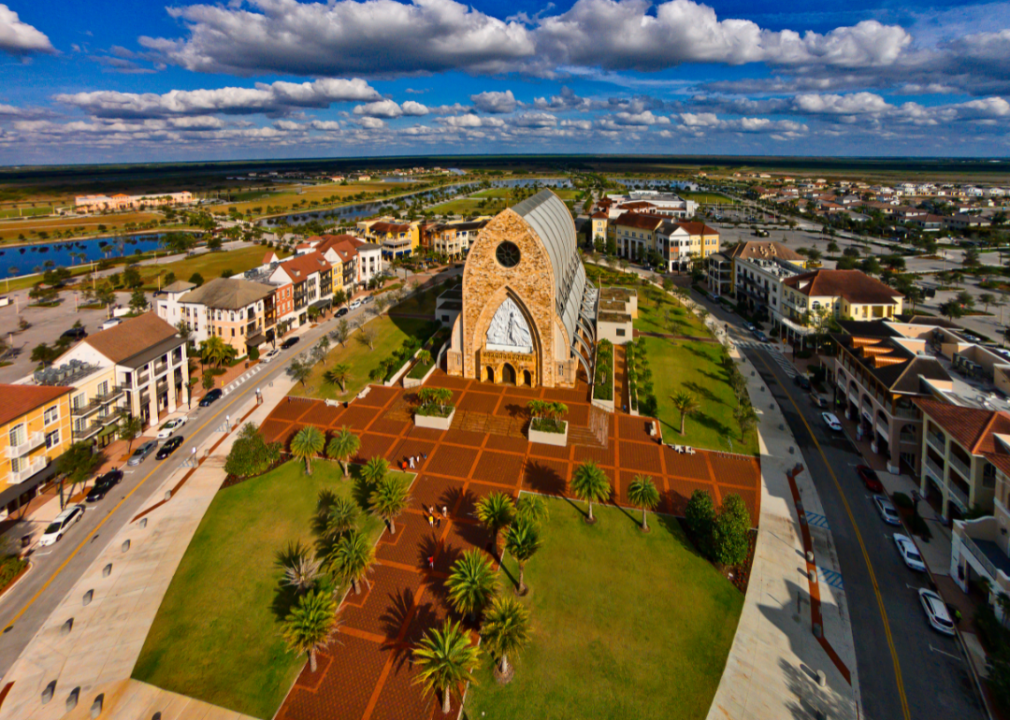
#21. Ave Maria University
Canva
Located in Ave Maria, Florida
-Total applicants in the 2022-23 school year: 3,404
— 135.4% more than in 2019
— 174.1% change from 2012
– Students admitted in the 2022-23 school year: 1,505
— 22.7% change from 2019
— 85.8% change from 2012
Canva
#20. Chicago State University
Canva
Located in Chicago
-Total applicants in the 2022-23 school year: 7,404
— 136.9% more than in 2019
— 88.0% change from 2012
– Students admitted in the 2022-23 school year: 3,592
— 81.4% change from 2019
— 141.6% change from 2012
KennStilger47 // Shutterstock
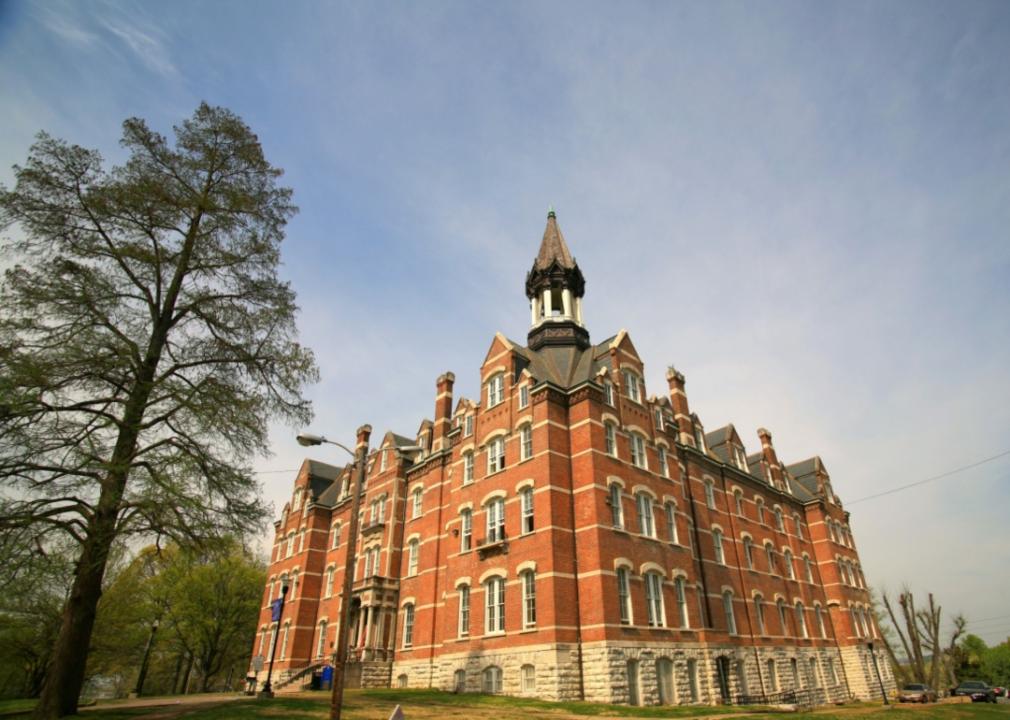
#19. Fisk University
KennStilger47 // Shutterstock
Located in Nashville, Tennessee
-Total applicants in the 2022-23 school year: 7,268
— 139.6% more than in 2019
— 163.5% change from 2012
– Students admitted in the 2022-23 school year: 5,158
— 82.0% change from 2019
— 1,678.6% change from 2012
PiXel Perfect PiX // Shutterstock
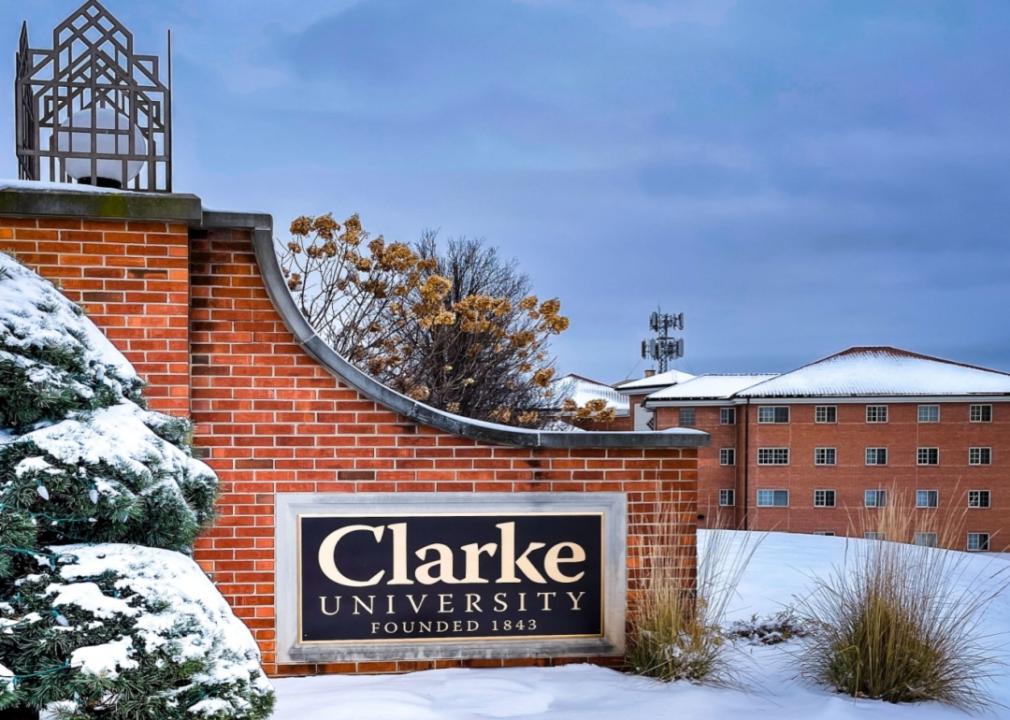
#18. Clarke University
PiXel Perfect PiX // Shutterstock
Located in Dubuque, Iowa
-Total applicants in the 2022-23 school year: 2,665
— 148.1% more than in 2019
— 157.7% change from 2012
– Students admitted in the 2022-23 school year: 2,260
— 124.2% change from 2019
— 196.2% change from 2012

Canva
#17. Converse University
Canva
Located in Spartanburg, South Carolina
-Total applicants in the 2022-23 school year: 2,917
— 150.8% more than in 2019
— 110.9% change from 2012
– Students admitted in the 2022-23 school year: 1,621
— 56.0% change from 2019
— 128.3% change from 2012
Erik S. Lesser // Getty Images
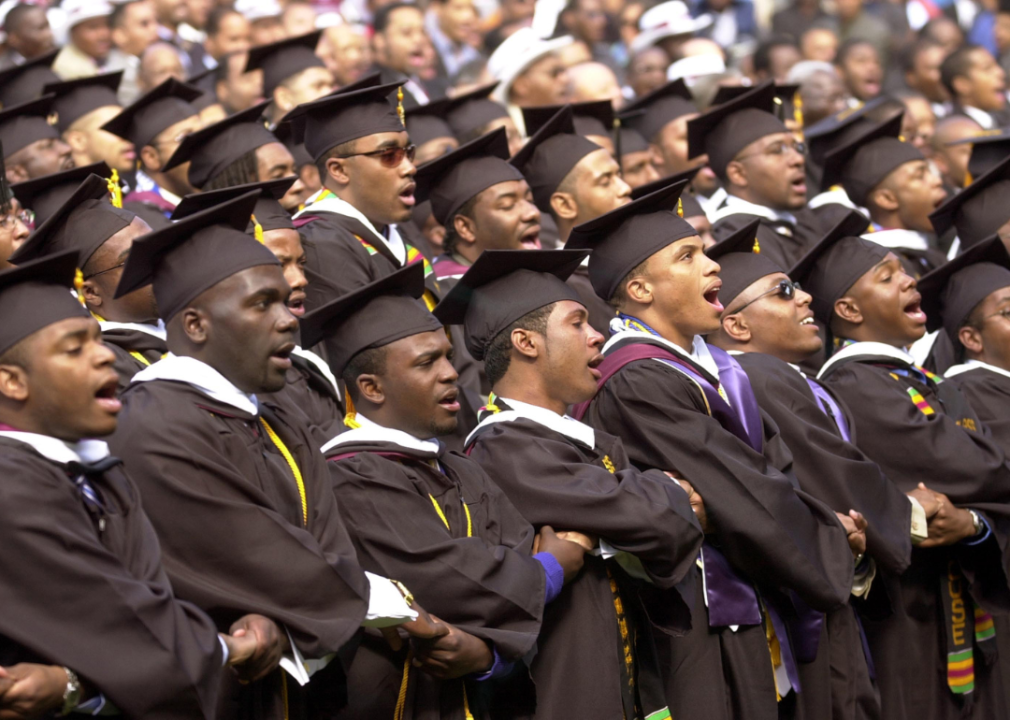
#16. Morehouse College
Erik S. Lesser // Getty Images
Located in Atlanta
-Total applicants in the 2022-23 school year: 5,221
— 157.2% more than in 2019
— 102.8% change from 2012
– Students admitted in the 2022-23 school year: 3,133
— 54.6% change from 2019
— 83.1% change from 2012
Canva
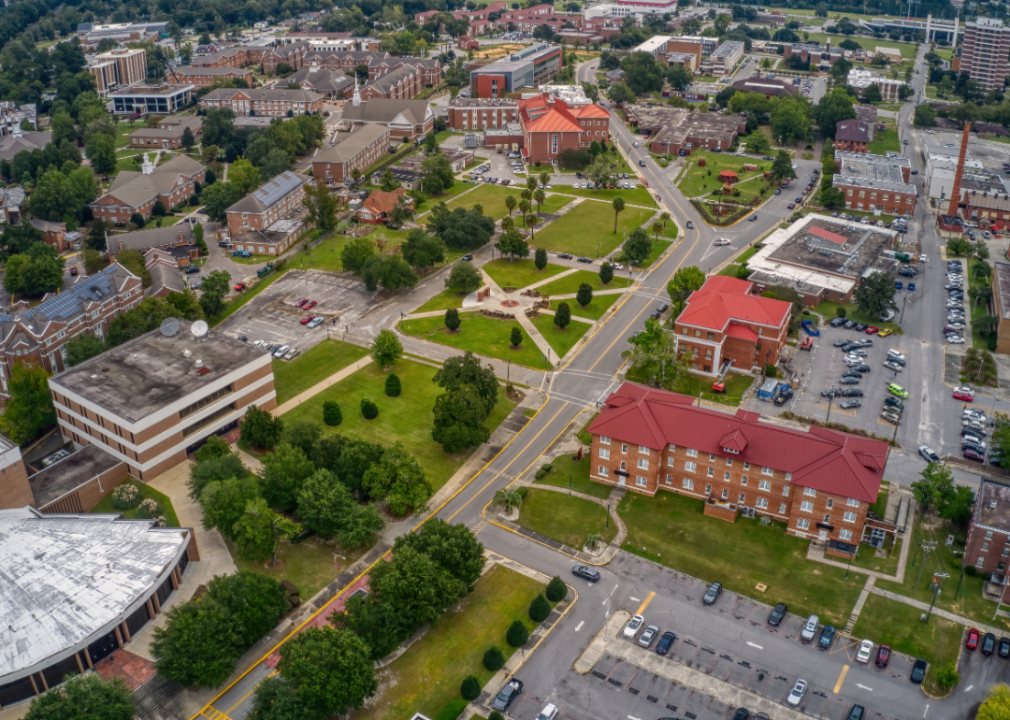
#15. South Carolina State University
Canva
Located in Orangeburg, South Carolina
-Total applicants in the 2022-23 school year: 6,833
— 159.7% more than in 2019
— 124.8% change from 2012
– Students admitted in the 2022-23 school year: 5,733
— 228.0% change from 2019
— 94.2% change from 2012

CrispyPork // Shutterstock
#14. Westminster College
CrispyPork // Shutterstock
Located in Fulton, Missouri
-Total applicants in the 2022-23 school year: 2,051
— 160.3% more than in 2019
— 44.4% change from 2012
– Students admitted in the 2022-23 school year: 1,544
— 103.4% change from 2019
— 51.2% change from 2012
Sean Rayford // Getty Images
#13. Edward Waters University
Sean Rayford // Getty Images
Located in Jacksonville, Florida
-Total applicants in the 2022-23 school year: 8,988
— 161.0% more than in 2019
— 363.8% change from 2012
– Students admitted in the 2022-23 school year: 7,509
— 256.7% change from 2019
— 1,240.9% change from 2012
Philip Lange // Shutterstock
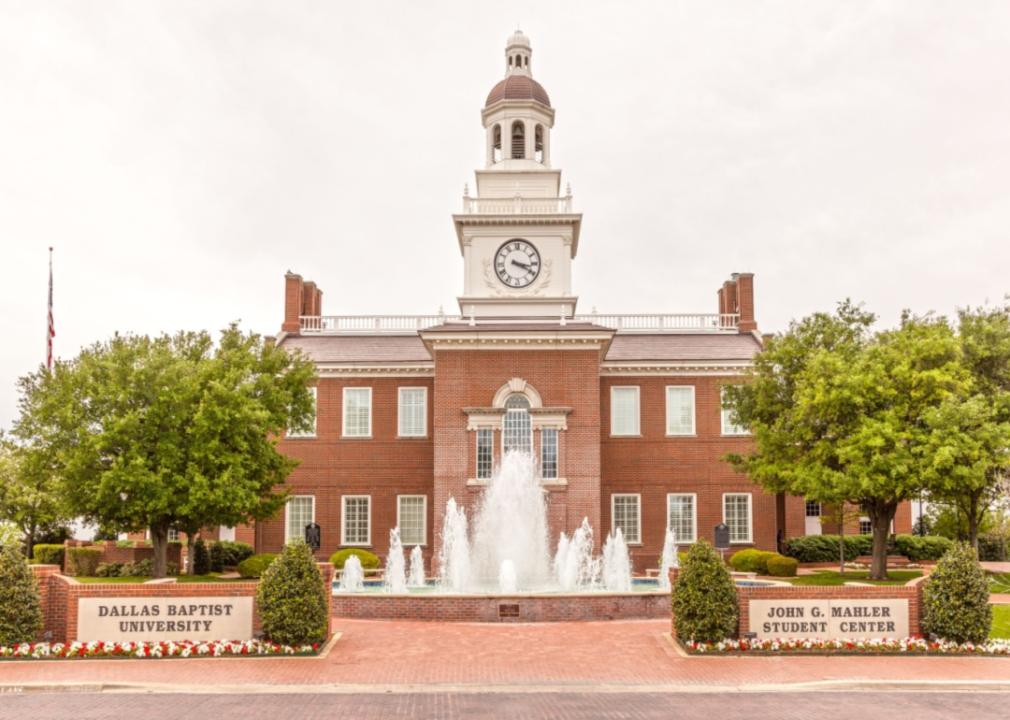
#12. Dallas Baptist University
Philip Lange // Shutterstock
Located in Dallas
-Total applicants in the 2022-23 school year: 8,519
— 162.9% more than in 2019
— 216.5% change from 2012
– Students admitted in the 2022-23 school year: 7,784
— 167.3% change from 2019
— 600.6% change from 2012

Matej Kastelic // Shutterstock
#11. La Roche University
Matej Kastelic // Shutterstock
Located in Pittsburgh
-Total applicants in the 2022-23 school year: 3,222
— 164.1% more than in 2019
— 103.0% change from 2012
– Students admitted in the 2022-23 school year: 3,137
— 158.6% change from 2019
— 280.2% change from 2012

Matej Kastelic // Shutterstock
#10. Columbia College
Matej Kastelic // Shutterstock
Located in Columbia, South Carolina
-Total applicants in the 2022-23 school year: 2,176
— 166.3% more than in 2019
— 181.9% change from 2012
– Students admitted in the 2022-23 school year: 2,135
— 170.6% change from 2019
— 327.9% change from 2012
Theodore Trimmer // Shutterstock
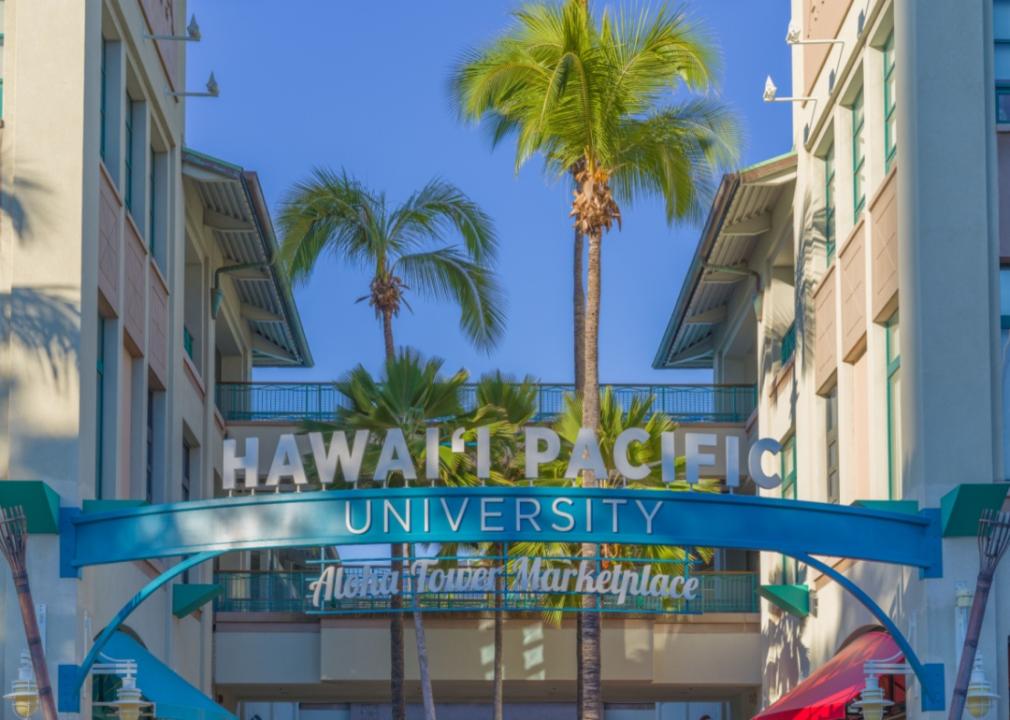
#9. Hawai’i Pacific University
Theodore Trimmer // Shutterstock
Located in Honolulu
-Total applicants in the 2022-23 school year: 13,354
— 179.0% more than in 2019
— 223.4% change from 2012
– Students admitted in the 2022-23 school year: 11,631
— 224.7% change from 2019
— 290.3% change from 2012

Canva
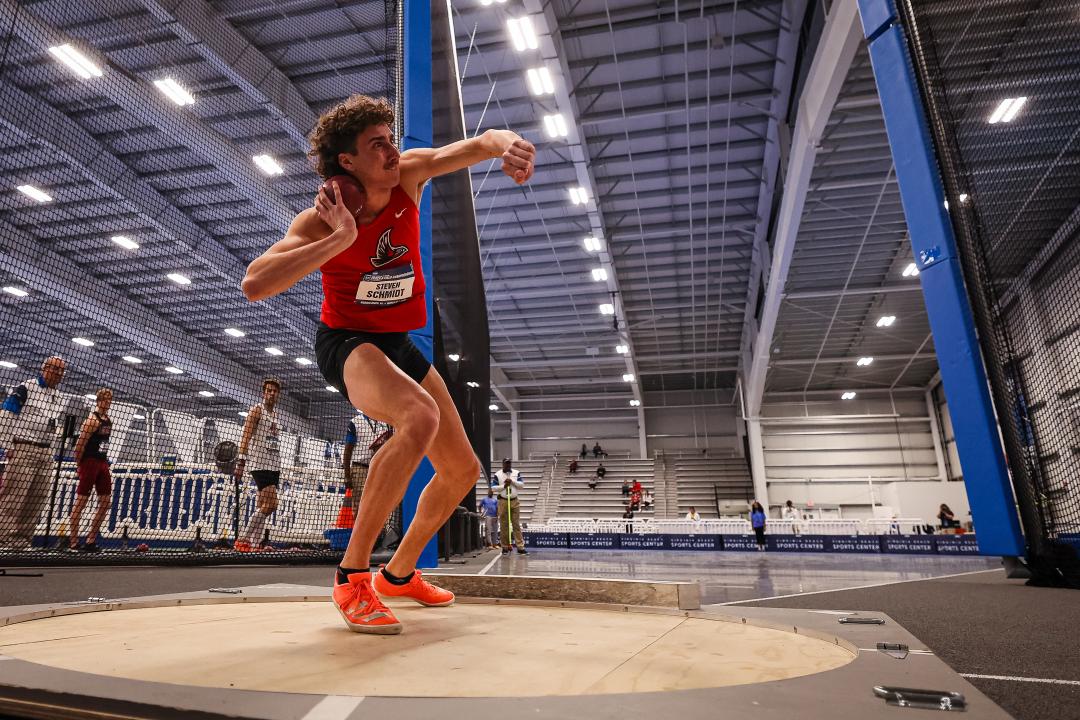
#8. Regent University
Canva
Located in Virginia Beach, Virginia
-Total applicants in the 2022-23 school year: 6,989
— 198.2% more than in 2019
— 362.8% change from 2012
– Students admitted in the 2022-23 school year: 2,260
— 12.7% change from 2019
— 82.0% change from 2012

Canva
#7. Bethany College
Canva
Located in Lindsborg, Kansas
-Total applicants in the 2022-23 school year: 3,521
— 202.8% more than in 2019
— 420.9% change from 2012
– Students admitted in the 2022-23 school year: 2,325
— 195.4% change from 2019
— 491.6% change from 2012

Canva
#6. Paul Quinn College
Canva
Located in Dallas
-Total applicants in the 2022-23 school year: 2,048
— 207.0% more than in 2019
— 857.0% change from 2012
– Students admitted in the 2022-23 school year: 1,173
— 122.2% change from 2019
— 541.0% change from 2012
Kurtis Toliver // Shutterstock
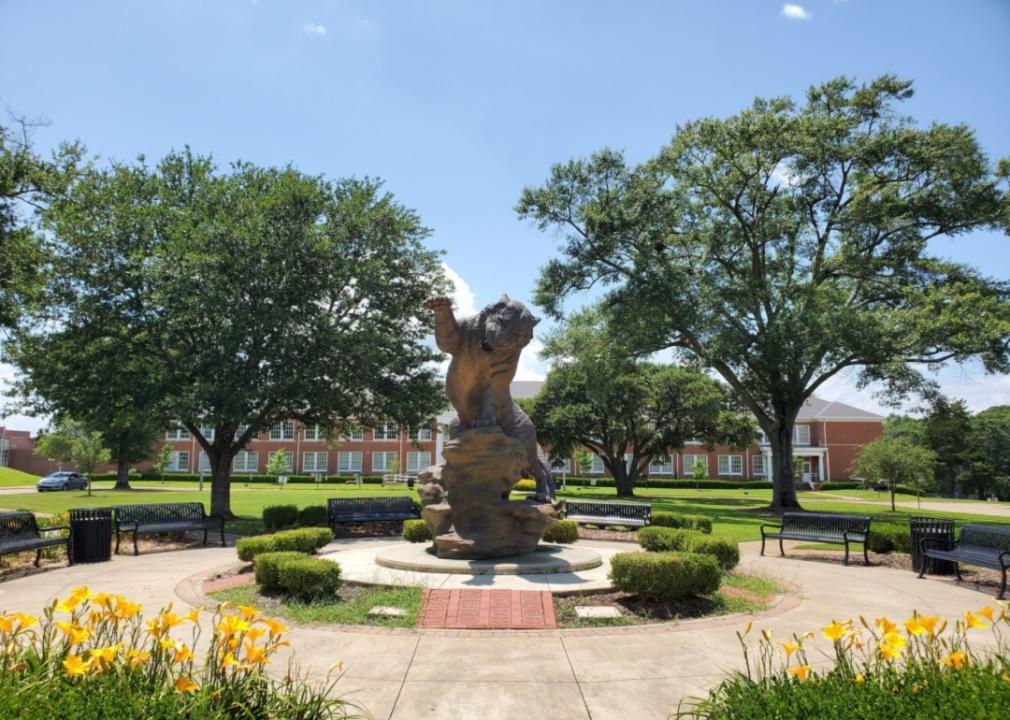
#5. Grambling State University
Kurtis Toliver // Shutterstock
Located in Grambling, Louisiana
-Total applicants in the 2022-23 school year: 10,732
— 245.2% more than in 2019
— 108.2% change from 2012
– Students admitted in the 2022-23 school year: 4,547
— 50.4% change from 2019
— 109.5% change from 2012
Tada Images // Shutterstock
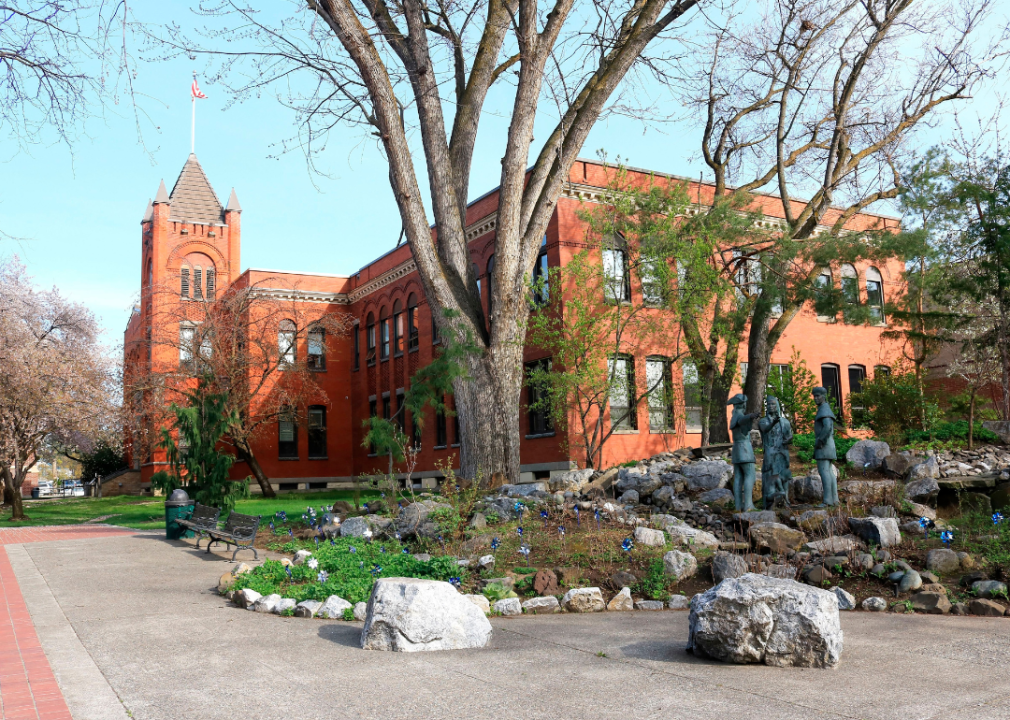
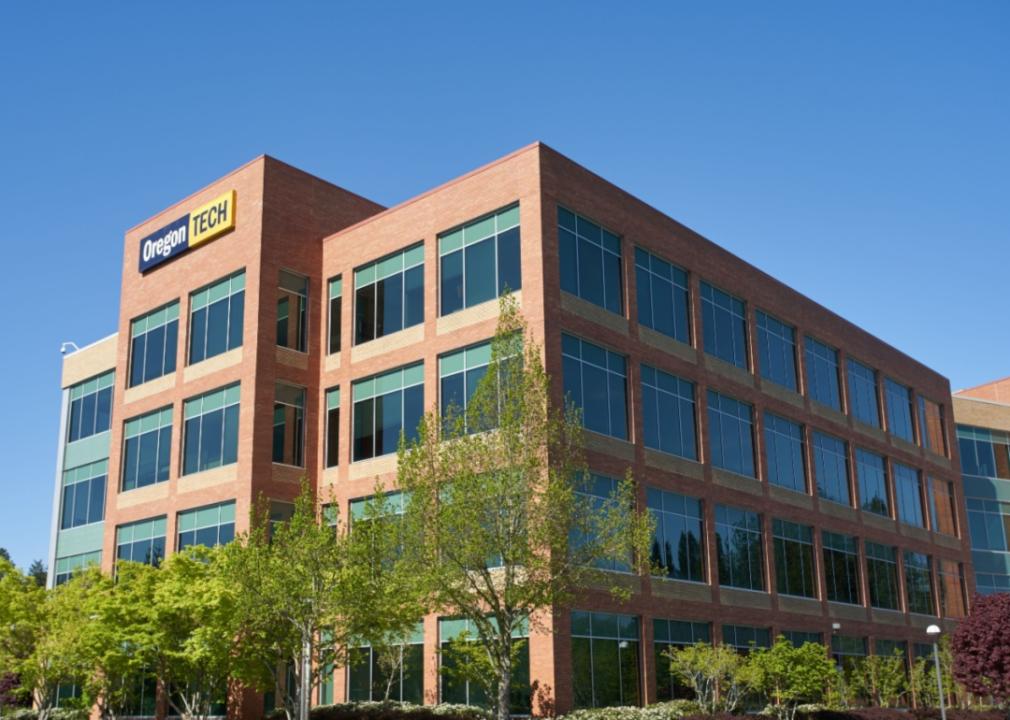
#4. Oregon Institute of Technology
Tada Images // Shutterstock
Located in Klamath Falls, Oregon
-Total applicants in the 2022-23 school year: 4,570
— 278.9% more than in 2019
— 364.4% change from 2012
– Students admitted in the 2022-23 school year: 4,231
— 261.3% change from 2019
— 570.5% change from 2012
Canva
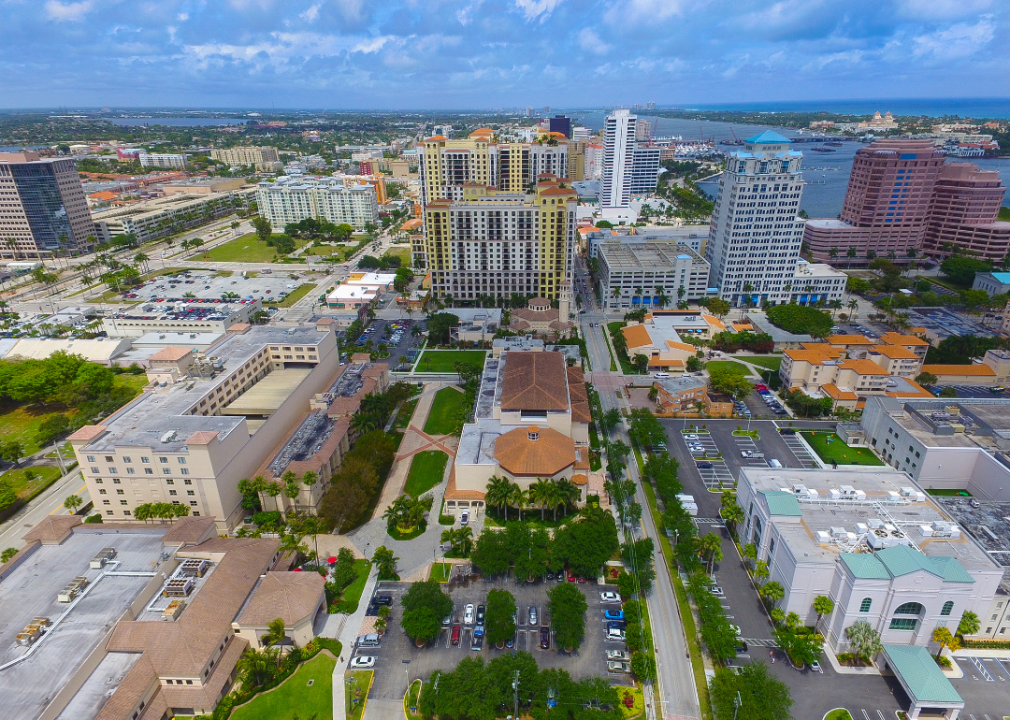
#3. Palm Beach Atlantic University
Canva
Located in West Palm Beach, Florida
-Total applicants in the 2022-23 school year: 6,220
— 305.5% more than in 2019
— 350.4% change from 2012
– Students admitted in the 2022-23 school year: 5,888
— 302.2% change from 2019
— 345.0% change from 2012

Canva
#2. Unity College
Canva
Located in New Gloucester, Maine
-Total applicants in the 2022-23 school year: 6,312
— 542.1% more than in 2019
— 1,470.1% change from 2012
– Students admitted in the 2022-23 school year: 5,953
— 516.3% change from 2019
— 1,586.4% change from 2012

Ground Picture // Shutterstock
#1. Stanbridge University
Ground Picture // Shutterstock
Located in Irvine, California
-Total applicants in the 2022-23 school year: 2,500
— 1,090.5% more than in 2019
— 733.3% change from 2012
– Students admitted in the 2022-23 school year: 253
— 90.2% change from 2019
— -1.9% change from 2012
Story editing by Nicole Caldwell. Copy editing by Paris Close. Photo selection by Lacy Kerrick.
This story originally appeared on Numerade and was produced and
distributed in partnership with Stacker Studio.