Counties with the most emergency shelters in Idaho
Cornellrockey04 // Wikimedia Commons
Counties with the most emergency shelters in Idaho
As climate change drives weather to greater extremes, and devastating hurricanes, wildfires, droughts, and blizzards preoccupy an increasing number of Americans, it is hard to avoid comparing the reality of everyday news coverage to the computer-generated images seen in disaster movies.
Over the last 50 years, natural disasters have become five times more common due to climate change, according to the World Meteorological Organization. They’ve also become more economically debilitating—the five most expensive climate disasters in American history have all taken place over the last two decades.
The increasing frequency and severity of natural disasters means that the need for emergency evacuation and shelter plans has never been greater. According to the Federal Emergency Management Association, understanding your climate risk, or proximity to probable natural disaster, is an important first step for making a plan. Tools like the Climate Mapping for Resilience and Adaptation allow you to assess your risk by location.
Knowing where nearby emergency shelters are located is another way to prepare for the worst. In the event of flooding, hurricane-level winds, or other disasters, emergency shelters offer a place to sleep, and also often provide food, water, and first aid services. Stacker examined the Department of Homeland Security’s National Shelter System Facilities database to identify the counties with the most emergency shelters in Idaho. Counties are ranked by emergency shelters per 100K people, with total capacity per 100K people serving as a tiebreaker.
![]()
Ian Poellet // Wikimedia Commons
#41. Payette County
– Emergency shelters per 100K people: 4.0 (1 shelters in database)
– Emergency shelter capacity per 100K: 555,777 people (138,544 total capacity)
– Shelters with generators: 0
– Shelters in 100-year floodplain: 0
wilson44691 // Wikimedia Commons
#40. Cassia County
– Emergency shelters per 100K people: 4.1 (1 shelters in database)
– Emergency shelter capacity per 100K: 565,777 people (138,440 total capacity)
– Shelters with generators: 0
– Shelters in 100-year floodplain: 0

Jcarr29 // Wikimedia Commons
#39. Bonneville County
– Emergency shelters per 100K people: 5.7 (7 shelters in database)
– Emergency shelter capacity per 100K: 1,857,776 people (2,262,233 total capacity)
– Shelters with generators: 0
– Shelters in 100-year floodplain: 1
Tamanoeconomico // Wikimedia Commons
#38. Canyon County
– Emergency shelters per 100K people: 7.9 (18 shelters in database)
– Emergency shelter capacity per 100K: 1,096,673 people (2,493,473 total capacity)
– Shelters with generators: 0
– Shelters in 100-year floodplain: 0
United States Department of Agriculture // Wikimedia Commons
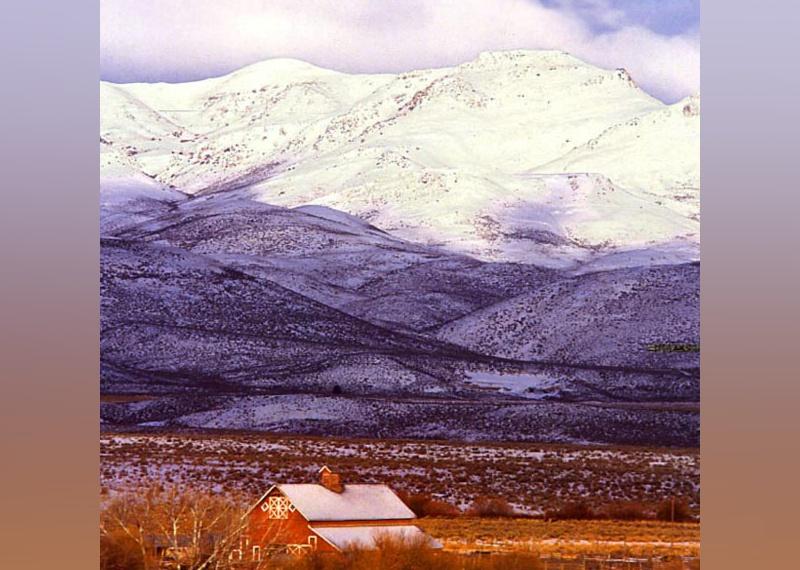
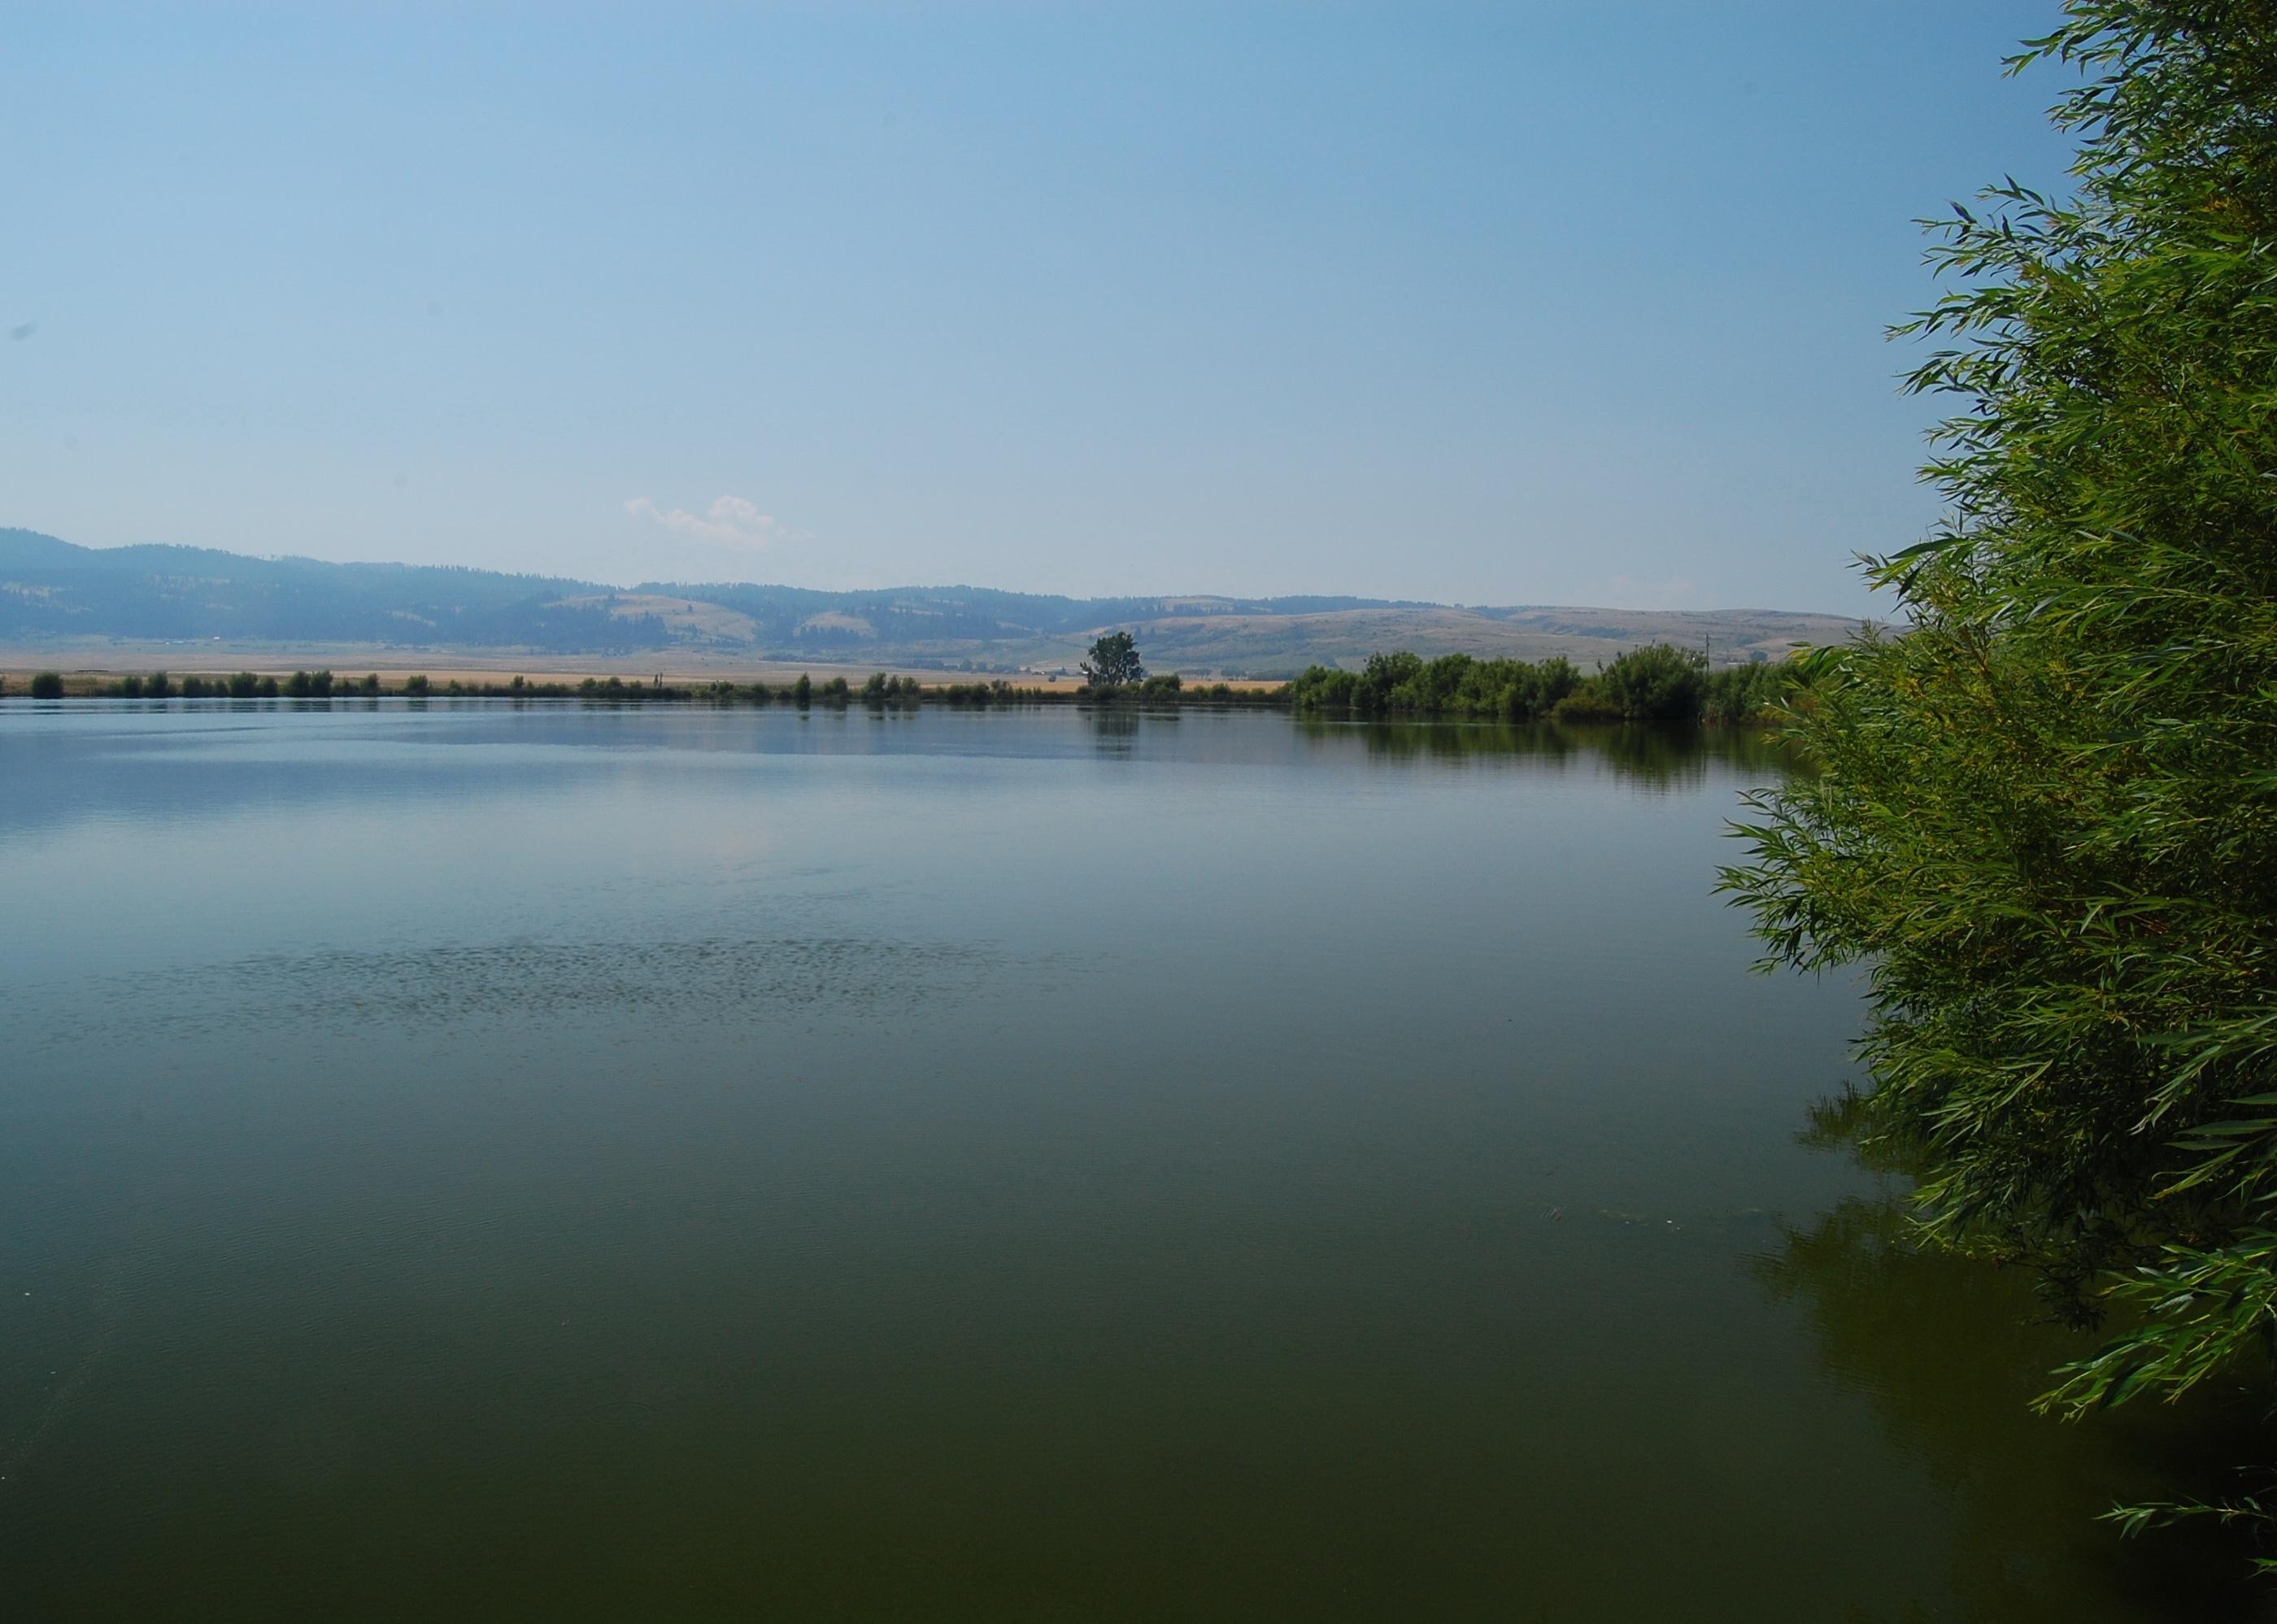
#37. Owyhee County
– Emergency shelters per 100K people: 8.5 (1 shelters in database)
– Emergency shelter capacity per 100K: 1,172,323 people (138,510 total capacity)
– Shelters with generators: 0
– Shelters in 100-year floodplain: 0
Ken Lund // Wikimedia Commons
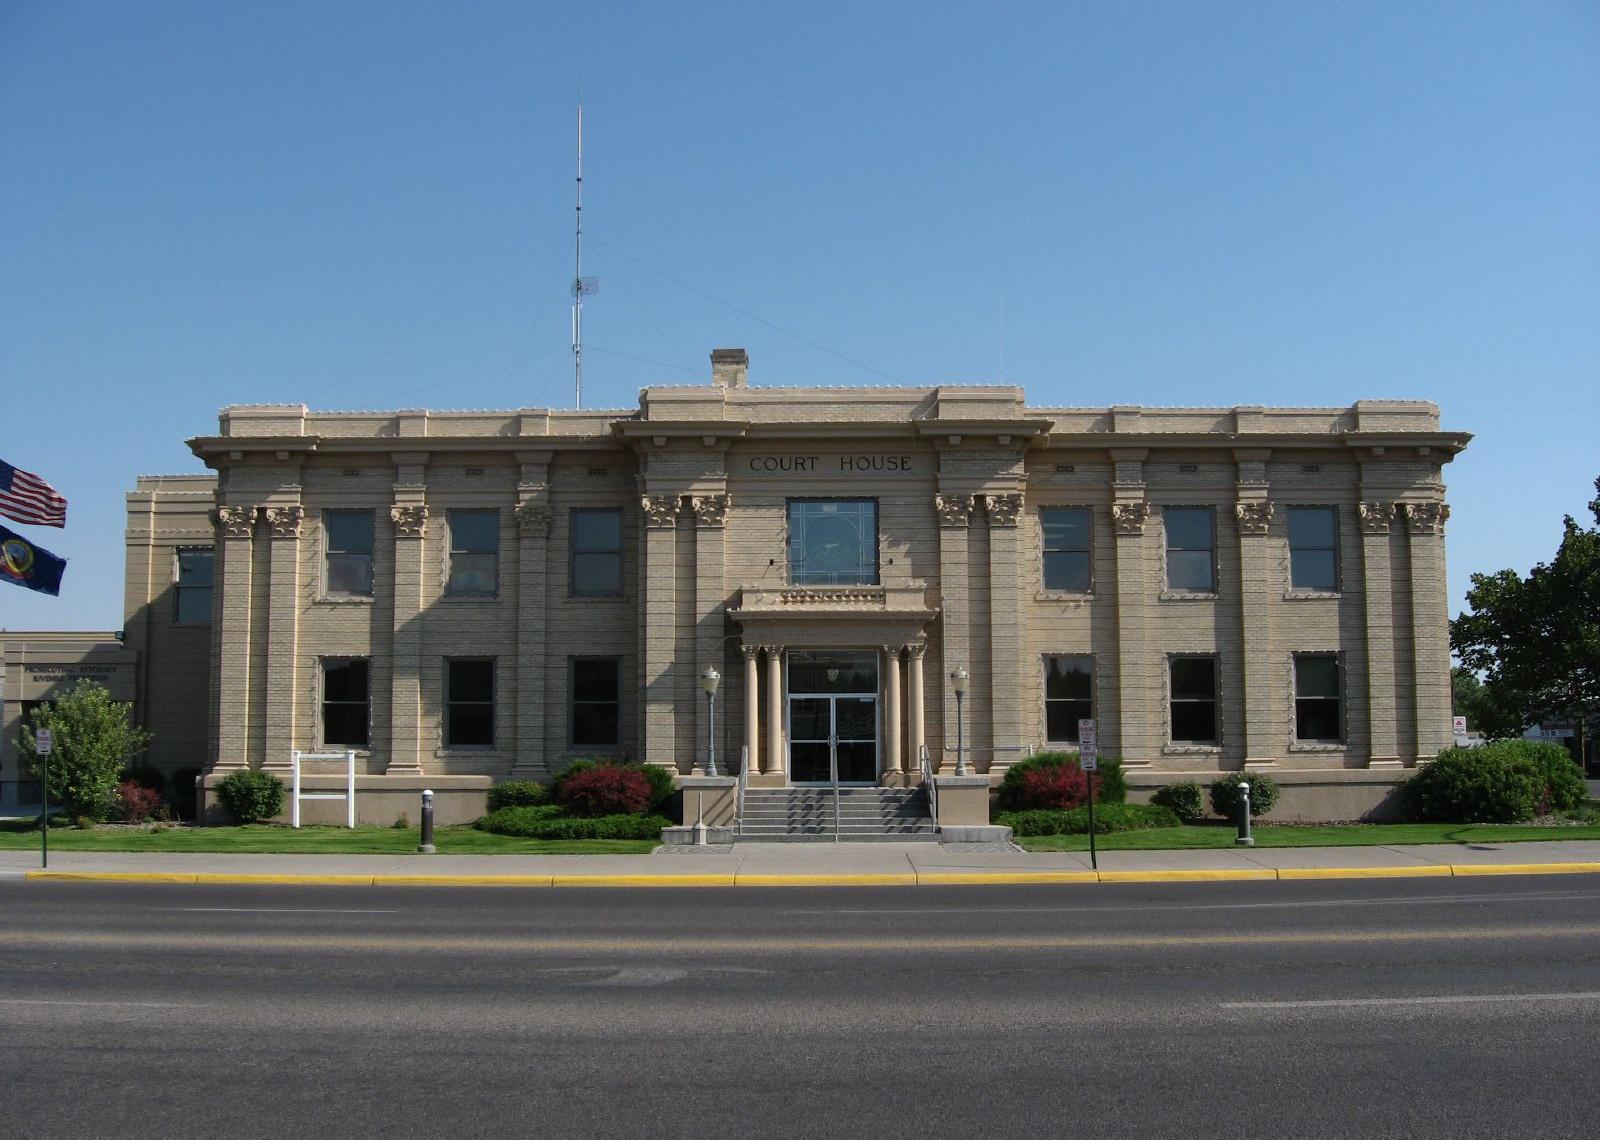
#36. Madison County
– Emergency shelters per 100K people: 9.8 (5 shelters in database)
– Emergency shelter capacity per 100K: 3,347,170 people (1,706,354 total capacity)
– Shelters with generators: 2
– Shelters in 100-year floodplain: 0
John D // Wikimedia Commons
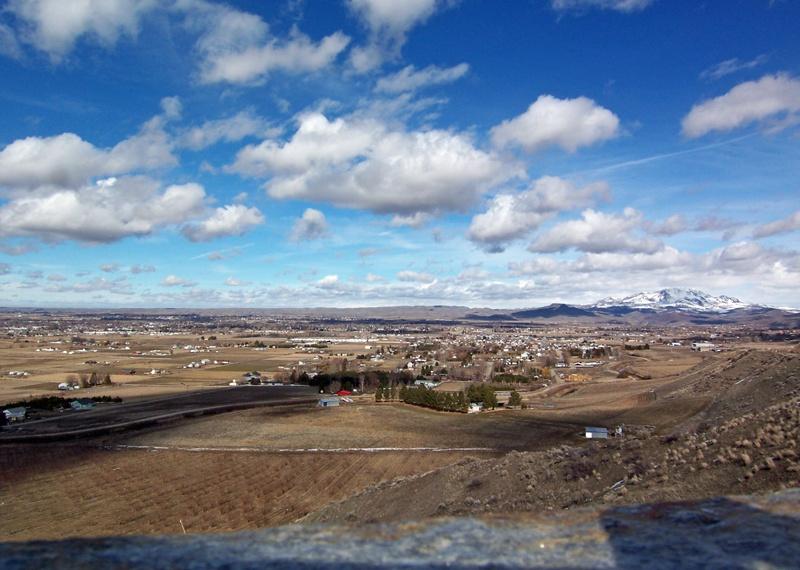
#35. Gem County
– Emergency shelters per 100K people: 10.7 (2 shelters in database)
– Emergency shelter capacity per 100K: 1,481,955 people (277,007 total capacity)
– Shelters with generators: 0
– Shelters in 100-year floodplain: 0
KRRK // Wikimedia Commons
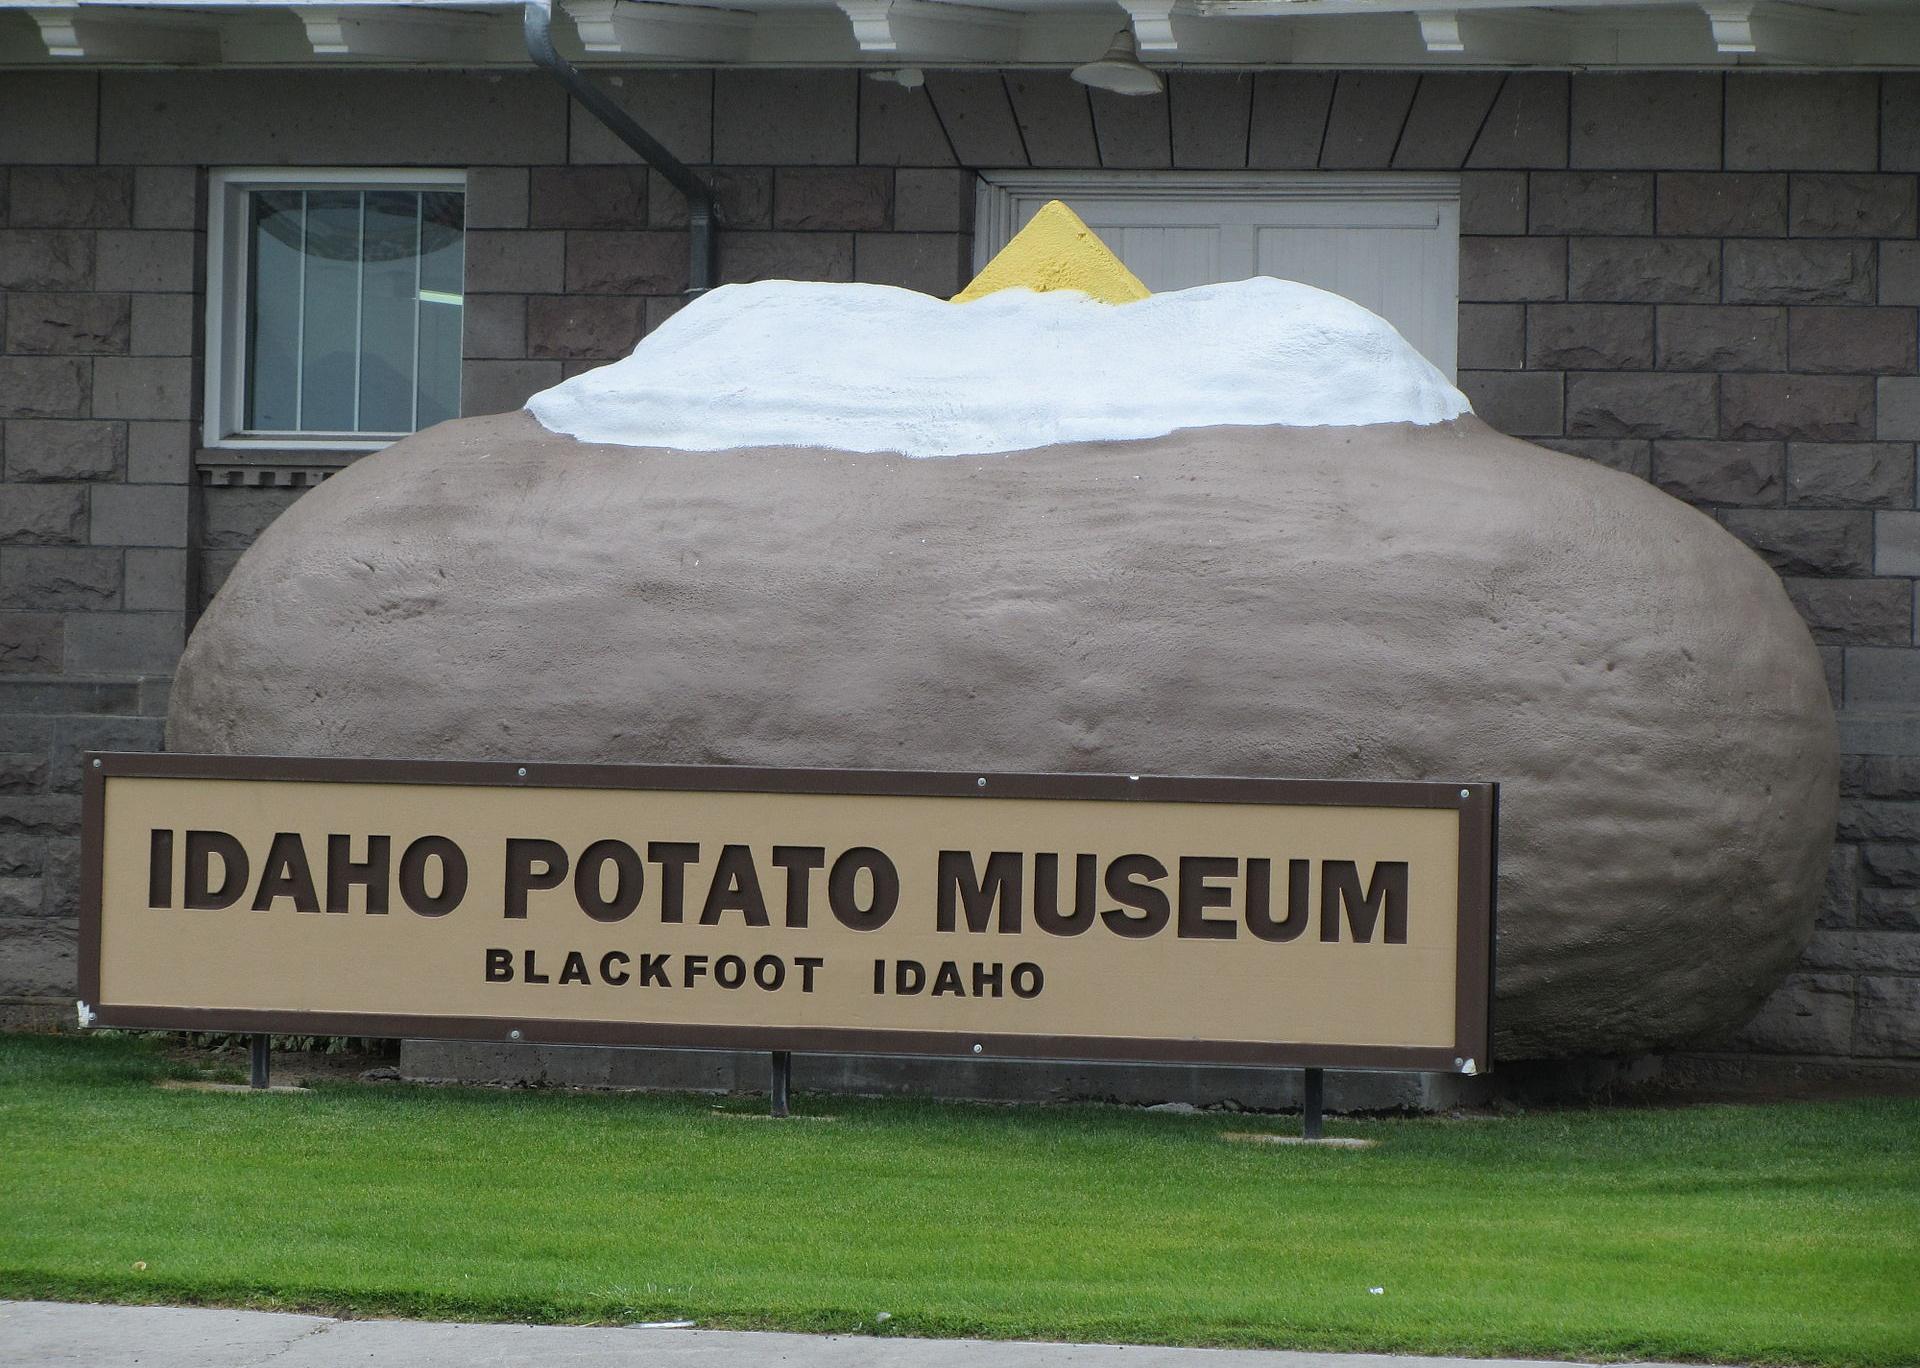
#34. Bingham County
– Emergency shelters per 100K people: 12.6 (6 shelters in database)
– Emergency shelter capacity per 100K: 4,018,679 people (1,910,480 total capacity)
– Shelters with generators: 0
– Shelters in 100-year floodplain: 0
JERRYE & ROY KLOTZ MD // Wikimedia Commons
#33. Power County
– Emergency shelters per 100K people: 12.7 (1 shelters in database)
– Emergency shelter capacity per 100K: 1,762,287 people (138,410 total capacity)
– Shelters with generators: 0
– Shelters in 100-year floodplain: 0
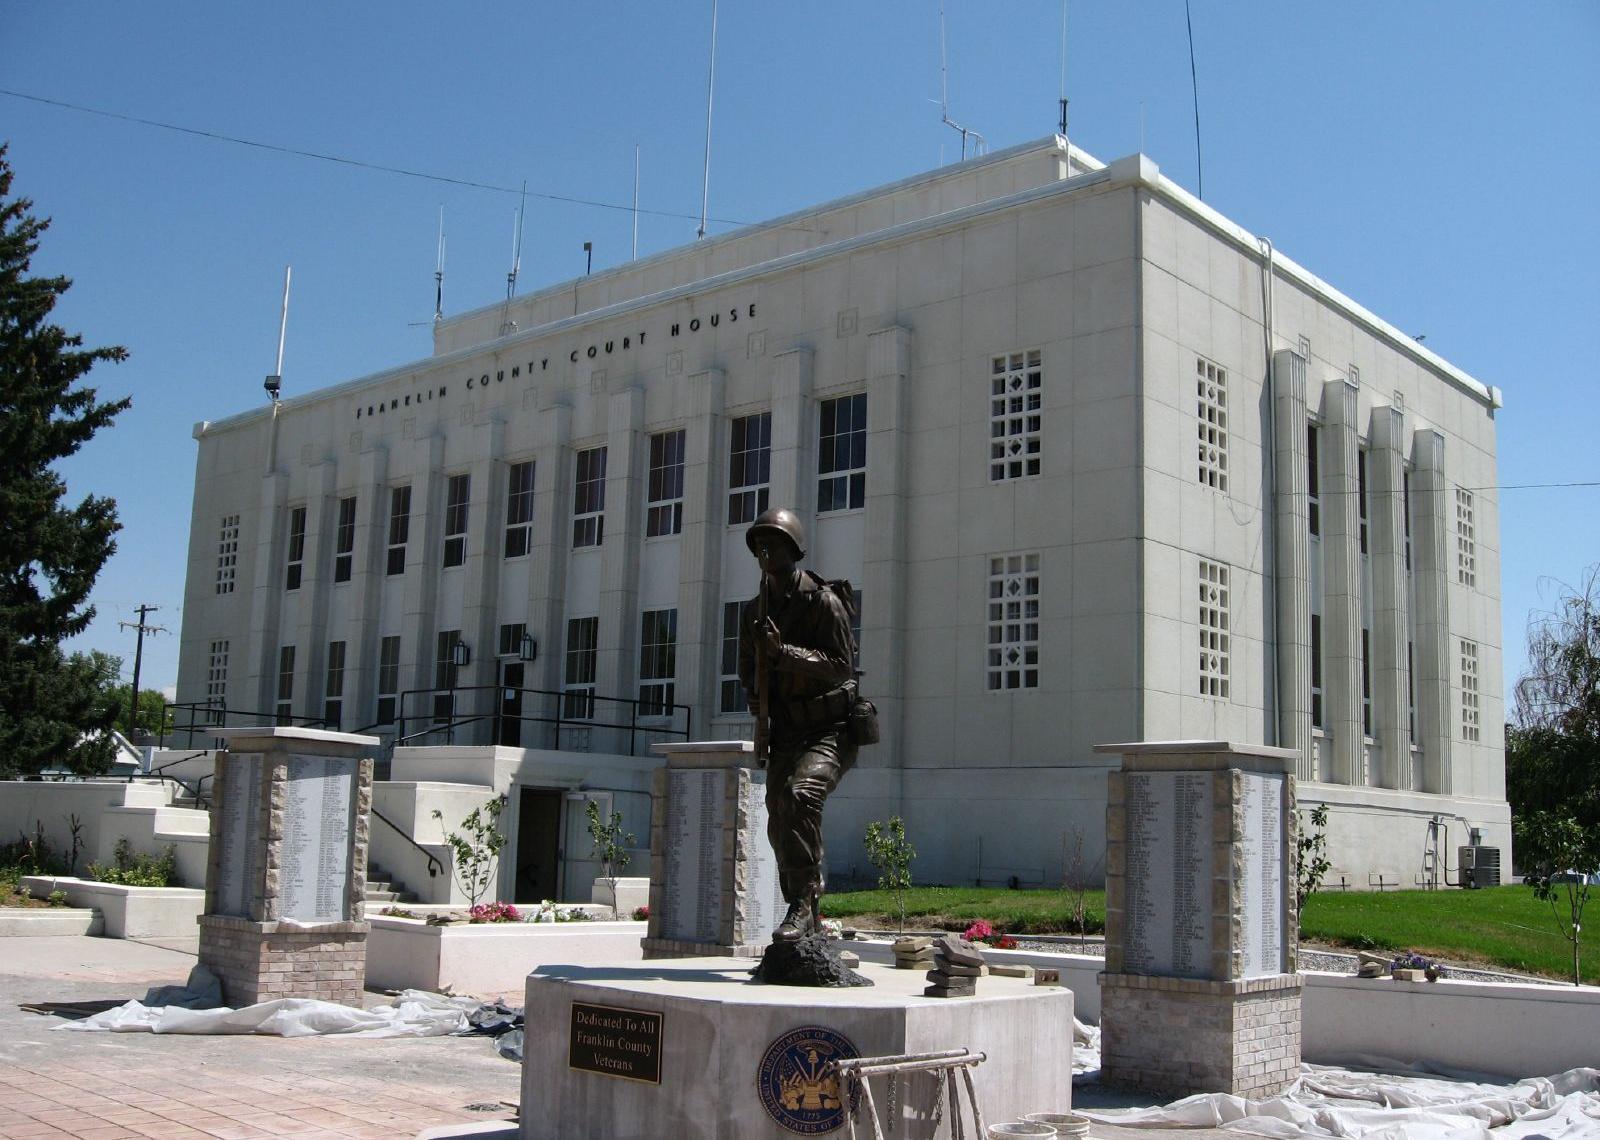
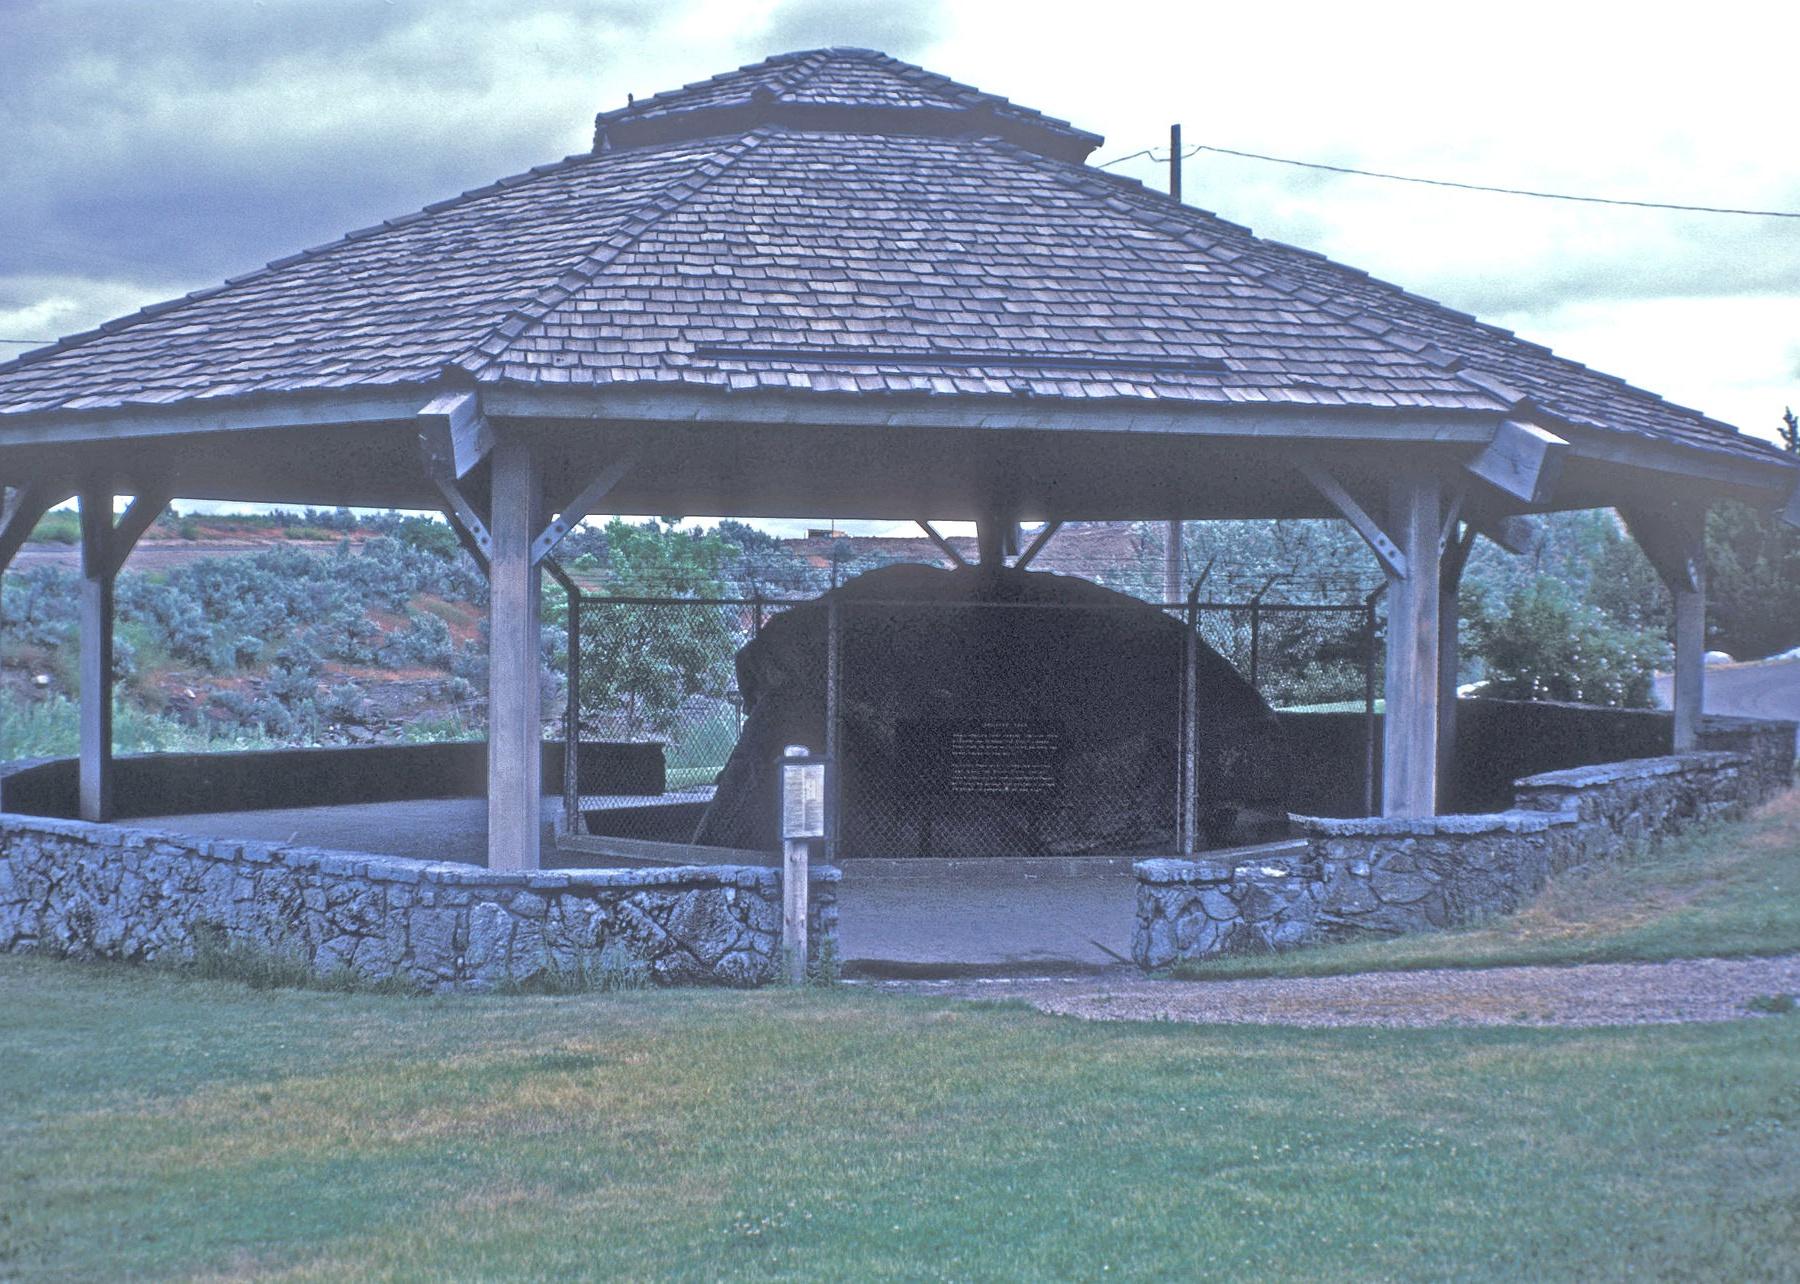
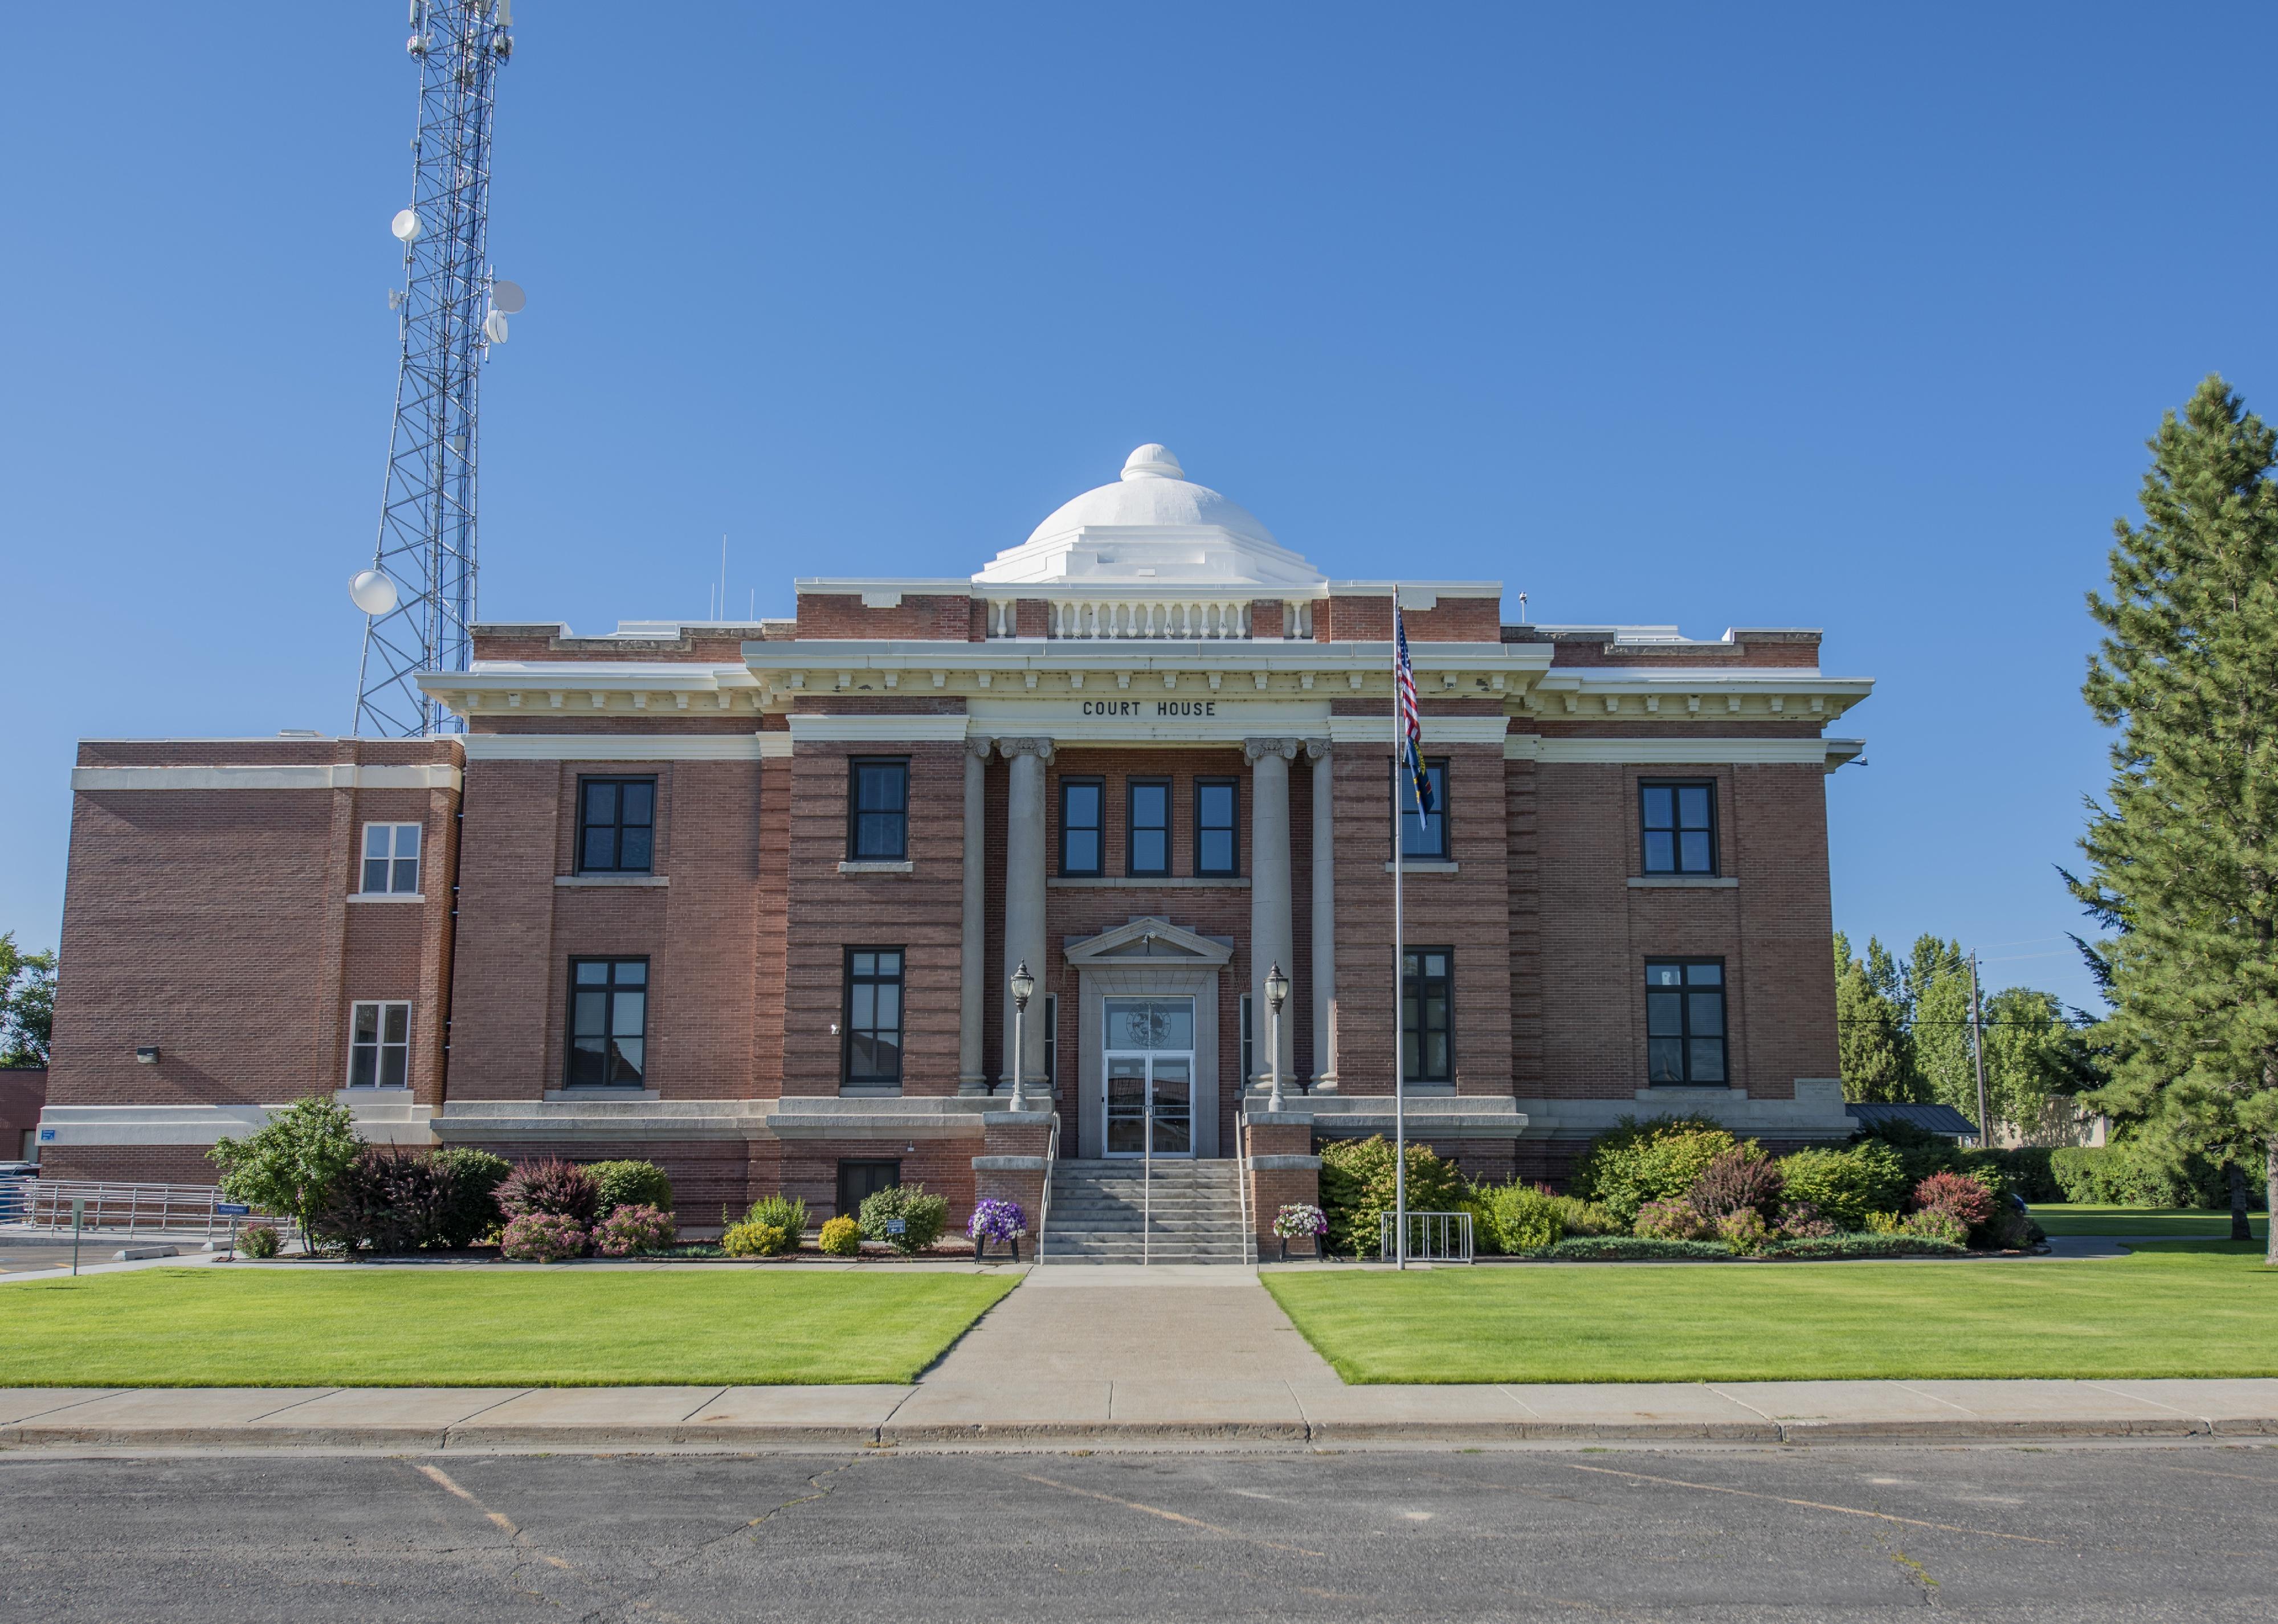
Ken Lund // Wikimedia Commons
#32. Franklin County
– Emergency shelters per 100K people: 14.2 (2 shelters in database)
– Emergency shelter capacity per 100K: 1,972,293 people (276,831 total capacity)
– Shelters with generators: 0
– Shelters in 100-year floodplain: 0
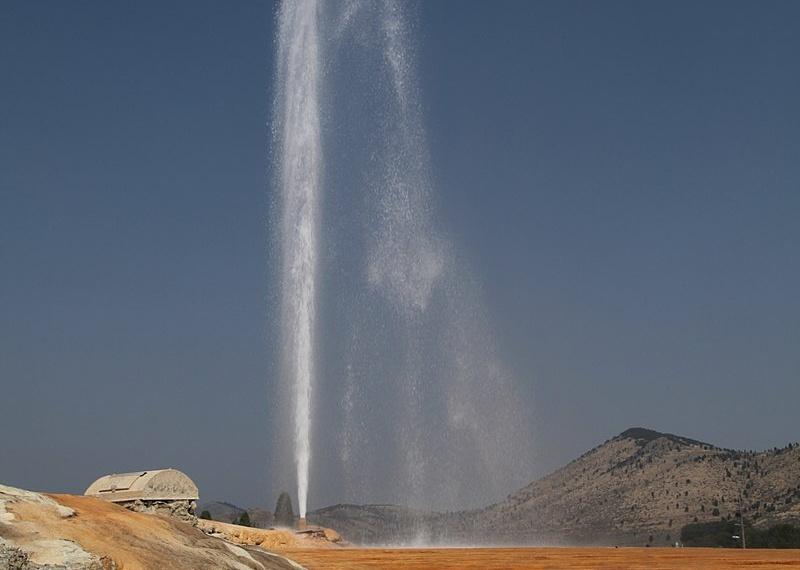
Dschwen // Wikimedia Commons
#31. Caribou County
– Emergency shelters per 100K people: 14.3 (1 shelters in database)
– Emergency shelter capacity per 100K: 1,976,539 people (138,417 total capacity)
– Shelters with generators: 0
– Shelters in 100-year floodplain: 0
Aualliso // Wikimedia Commons
#30. Fremont County
– Emergency shelters per 100K people: 15.0 (2 shelters in database)
– Emergency shelter capacity per 100K: 5,084,779 people (679,835 total capacity)
– Shelters with generators: 0
– Shelters in 100-year floodplain: 0
Tom Young // Wikimedia Commons
#29. Lincoln County
– Emergency shelters per 100K people: 19.3 (1 shelters in database)
– Emergency shelter capacity per 100K: 2,670,814 people (138,455 total capacity)
– Shelters with generators: 0
– Shelters in 100-year floodplain: 0
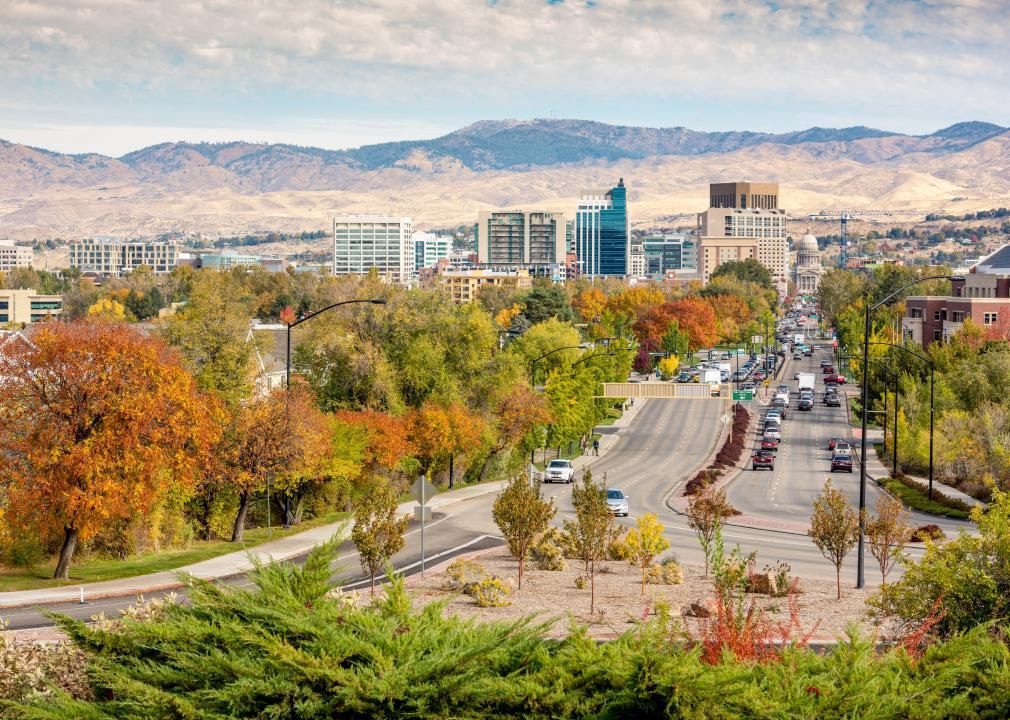
Charles Knowles // Shutterstock
#28. Ada County
– Emergency shelters per 100K people: 20.0 (97 shelters in database)
– Emergency shelter capacity per 100K: 5,648,273 people (27,408,021 total capacity)
– Shelters with generators: 7
– Shelters in 100-year floodplain: 1
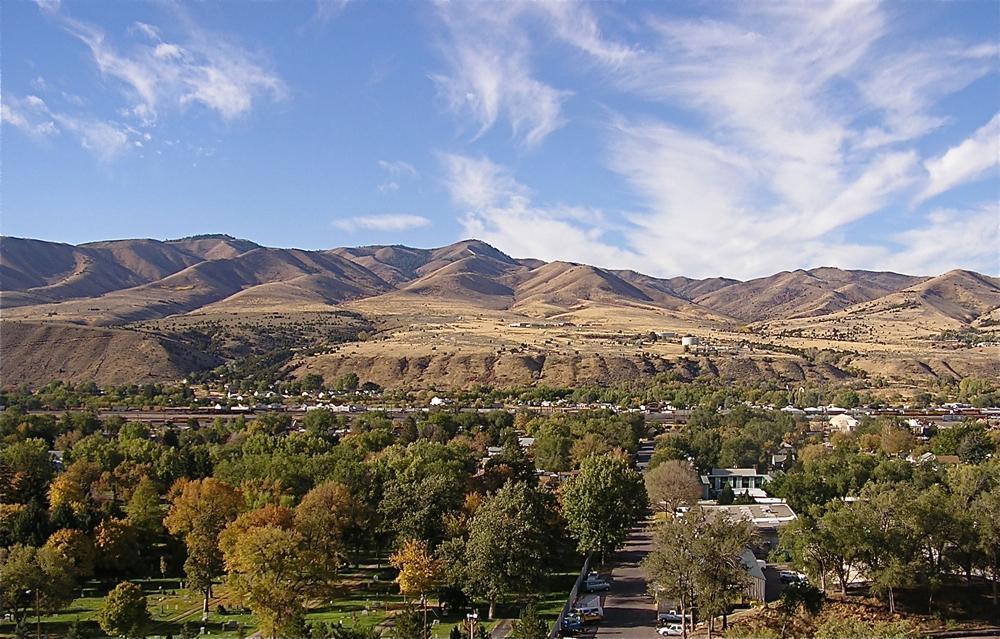
Michlaovic // Wikimedia
#27. Bannock County
– Emergency shelters per 100K people: 22.0 (19 shelters in database)
– Emergency shelter capacity per 100K: 4,507,015 people (3,892,348 total capacity)
– Shelters with generators: 2
– Shelters in 100-year floodplain: 0
Tricia Simpson // Wikimedia Commons
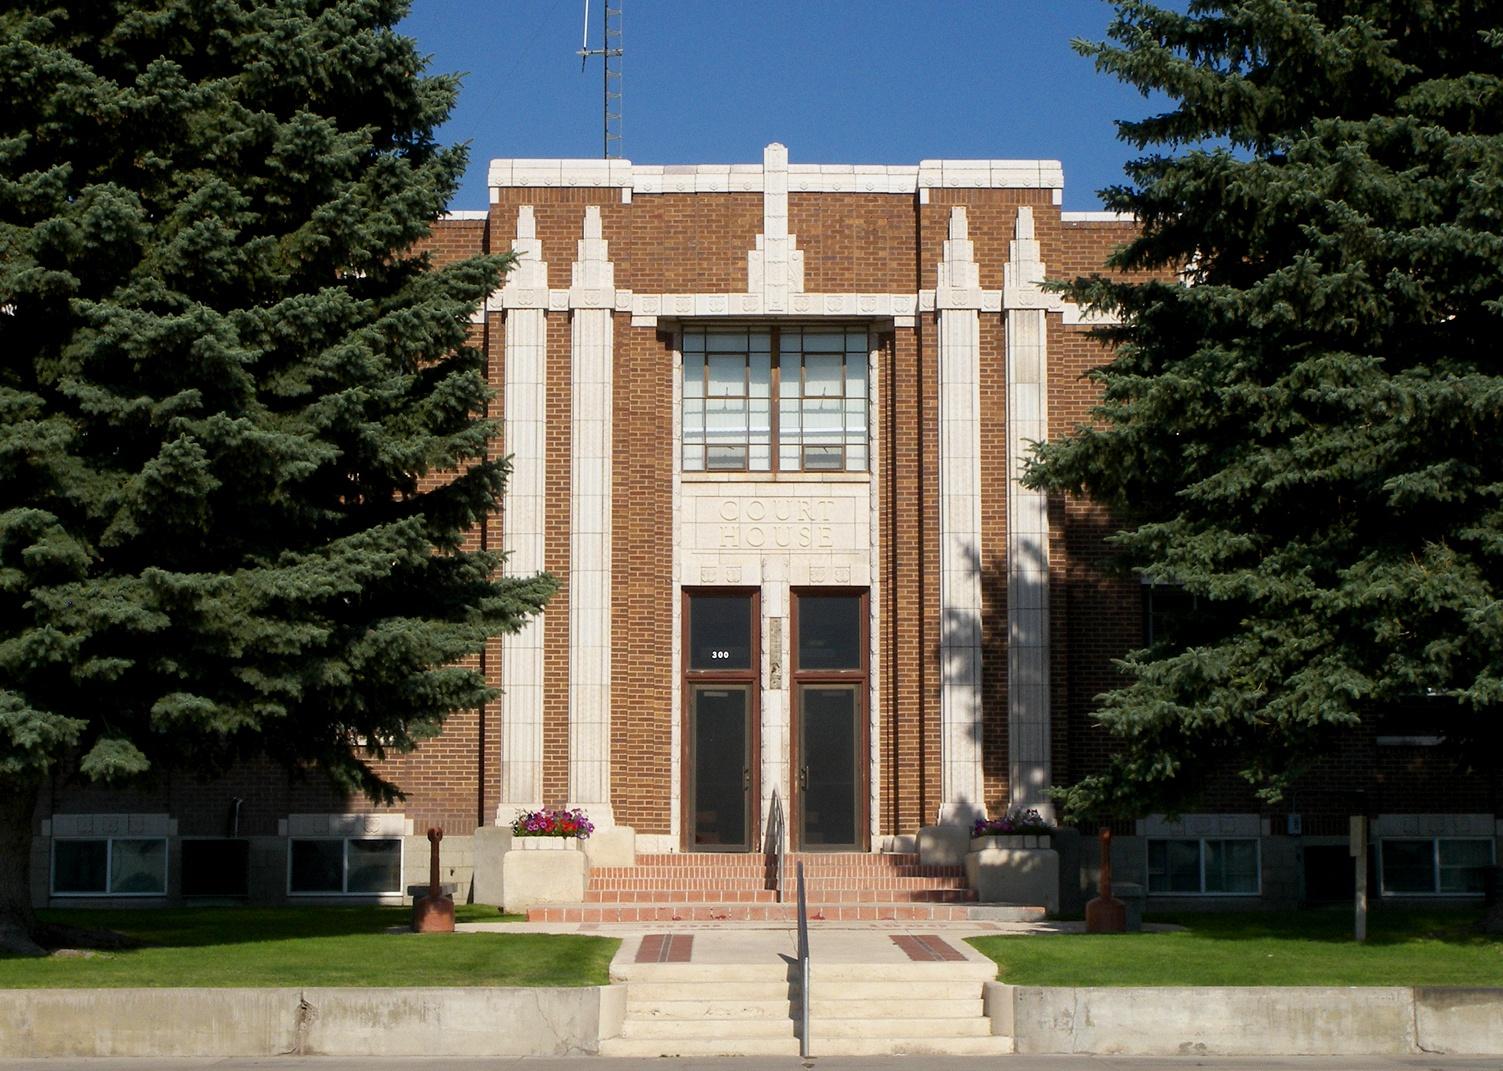
#26. Oneida County
– Emergency shelters per 100K people: 22.2 (1 shelters in database)
– Emergency shelter capacity per 100K: 3,066,283 people (138,412 total capacity)
– Shelters with generators: 0
– Shelters in 100-year floodplain: 0
John Stanton // Wikimedia Commons
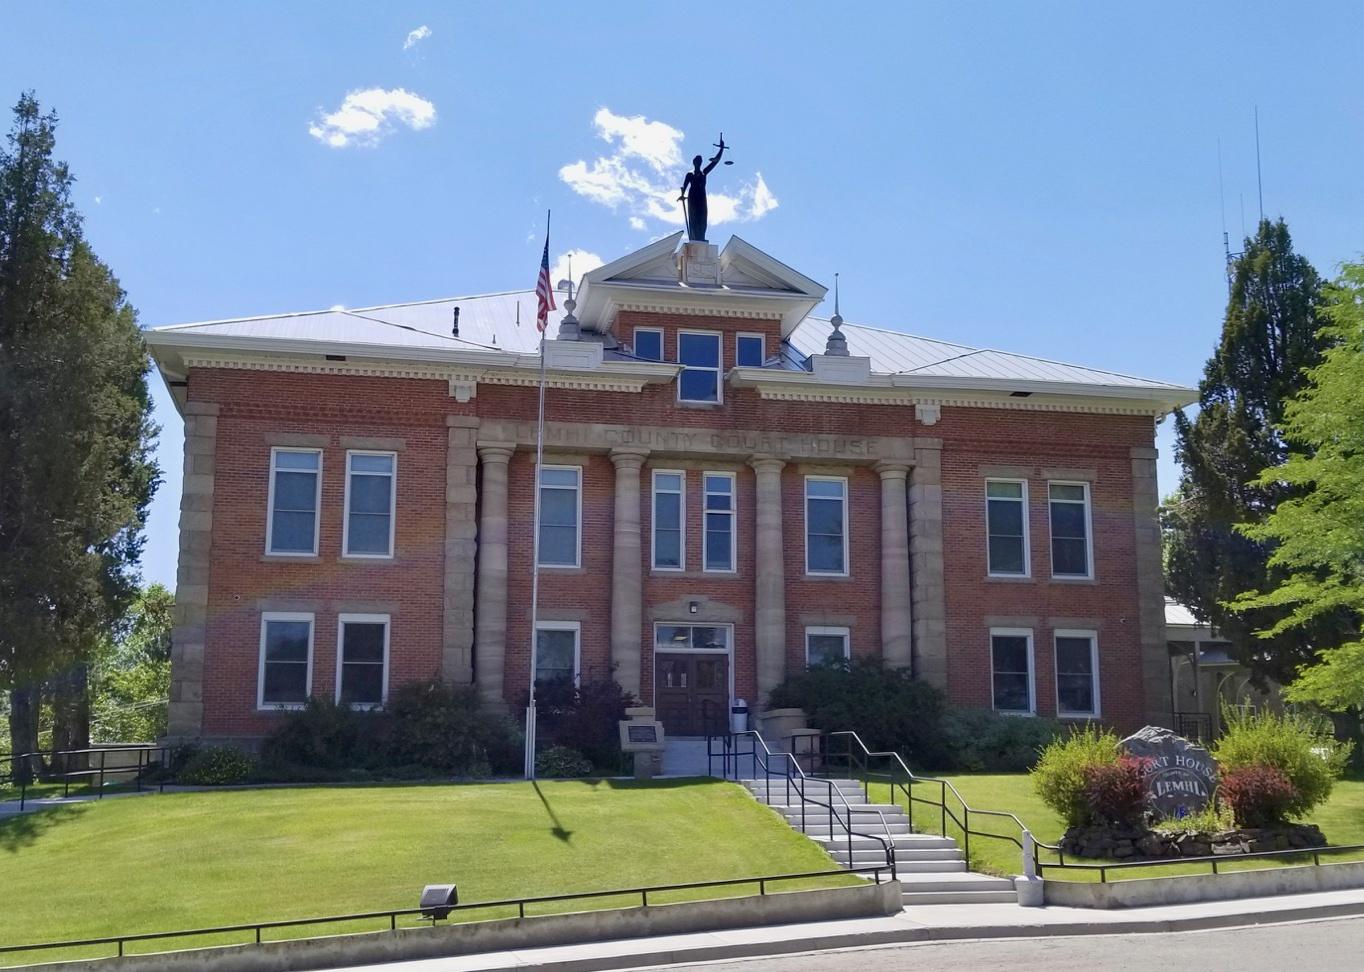
#25. Lemhi County
– Emergency shelters per 100K people: 25.2 (2 shelters in database)
– Emergency shelter capacity per 100K: 8,873,352 people (705,254 total capacity)
– Shelters with generators: 0
– Shelters in 100-year floodplain: 0
rustejunk // Wikimedia Commons
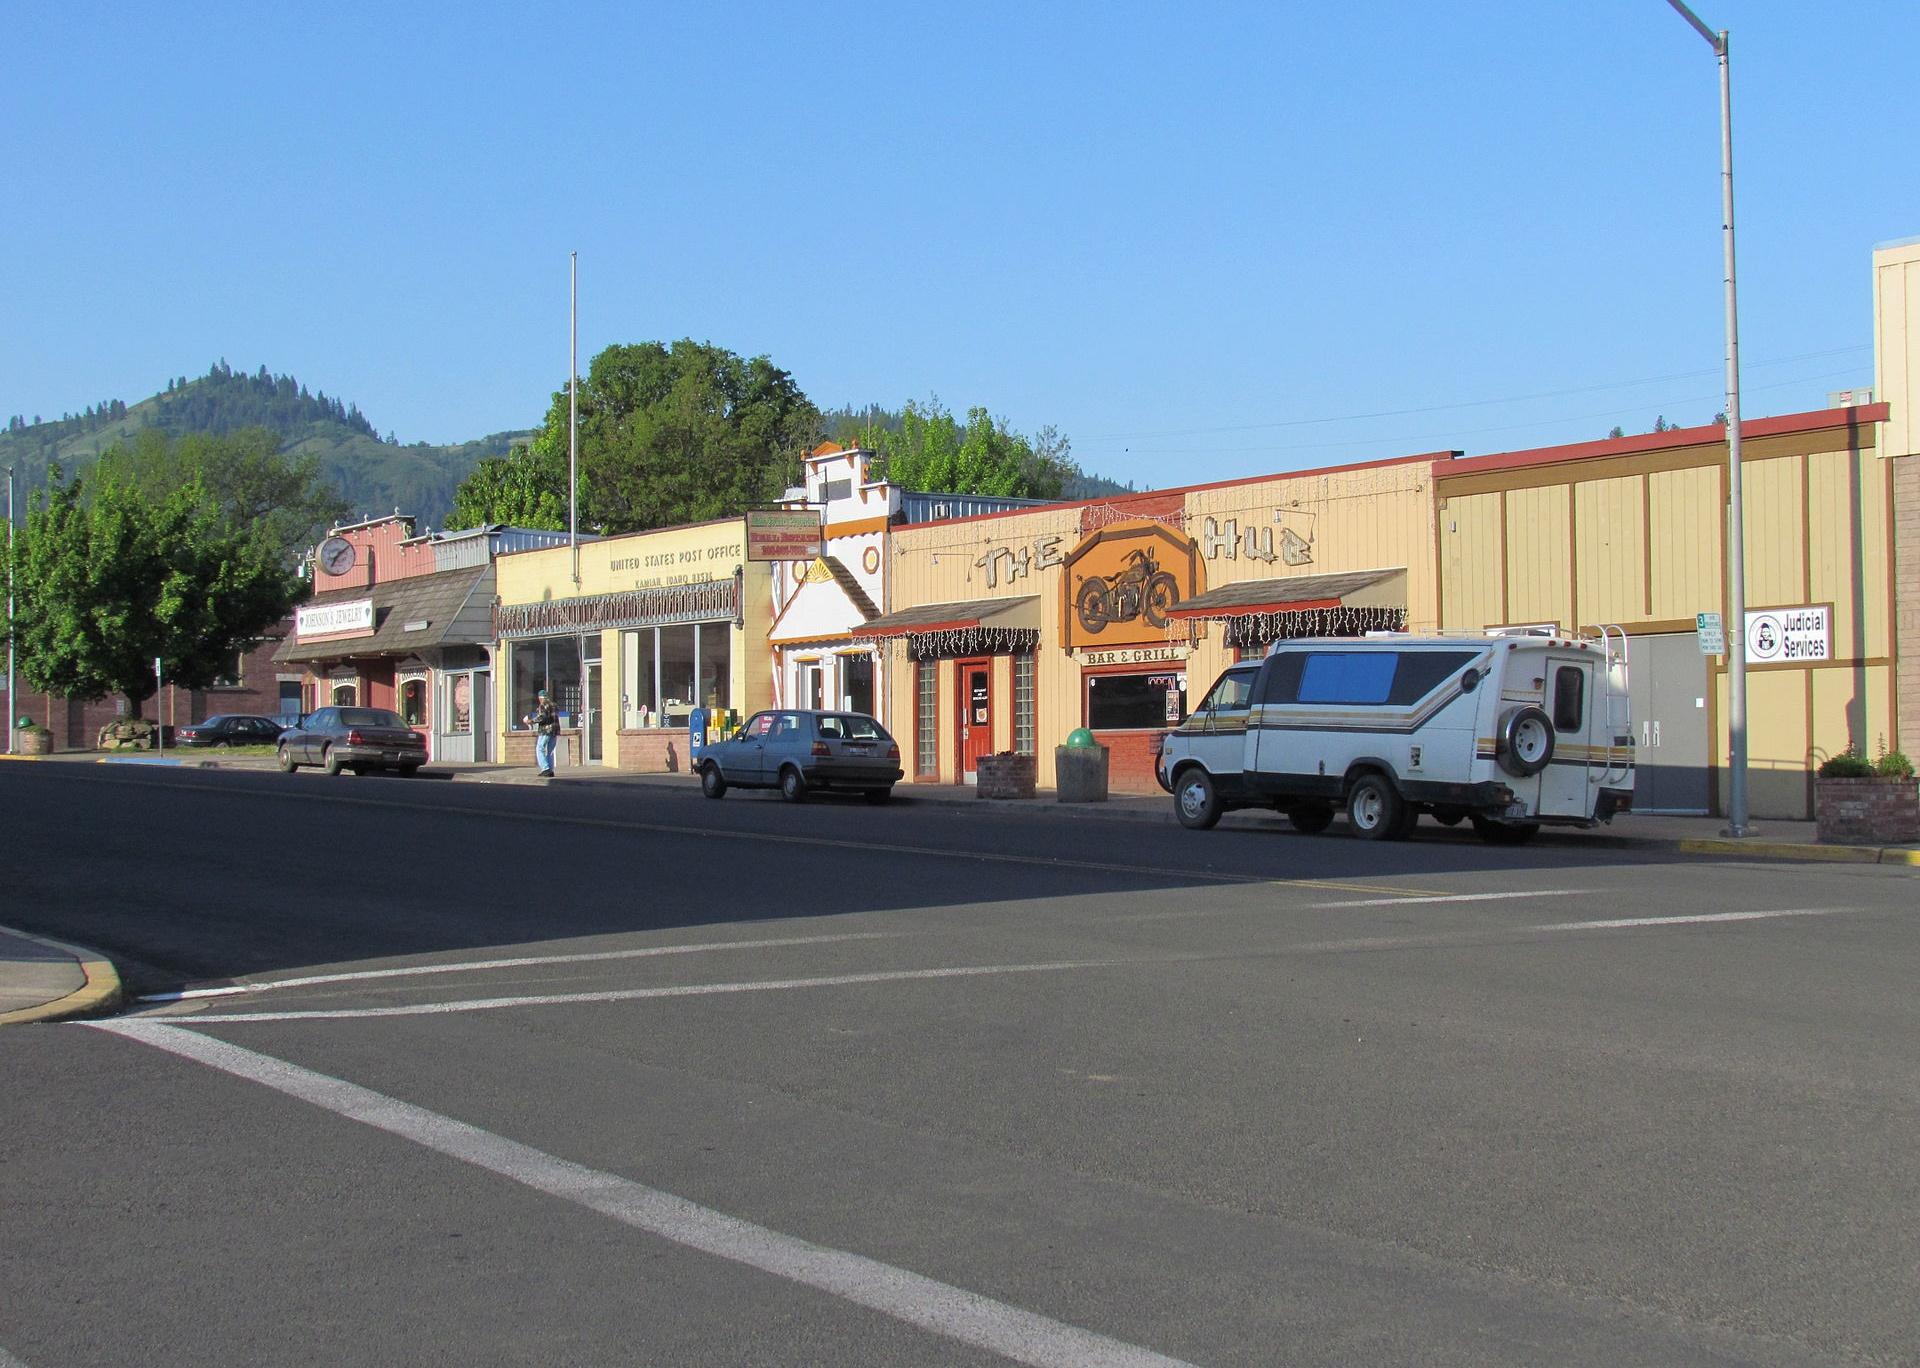
#24. Lewis County
– Emergency shelters per 100K people: 27.7 (1 shelters in database)
– Emergency shelter capacity per 100K: 9,458,428 people (341,733 total capacity)
– Shelters with generators: 0
– Shelters in 100-year floodplain: 0
Tricia Simpson // Wikimedia Commons
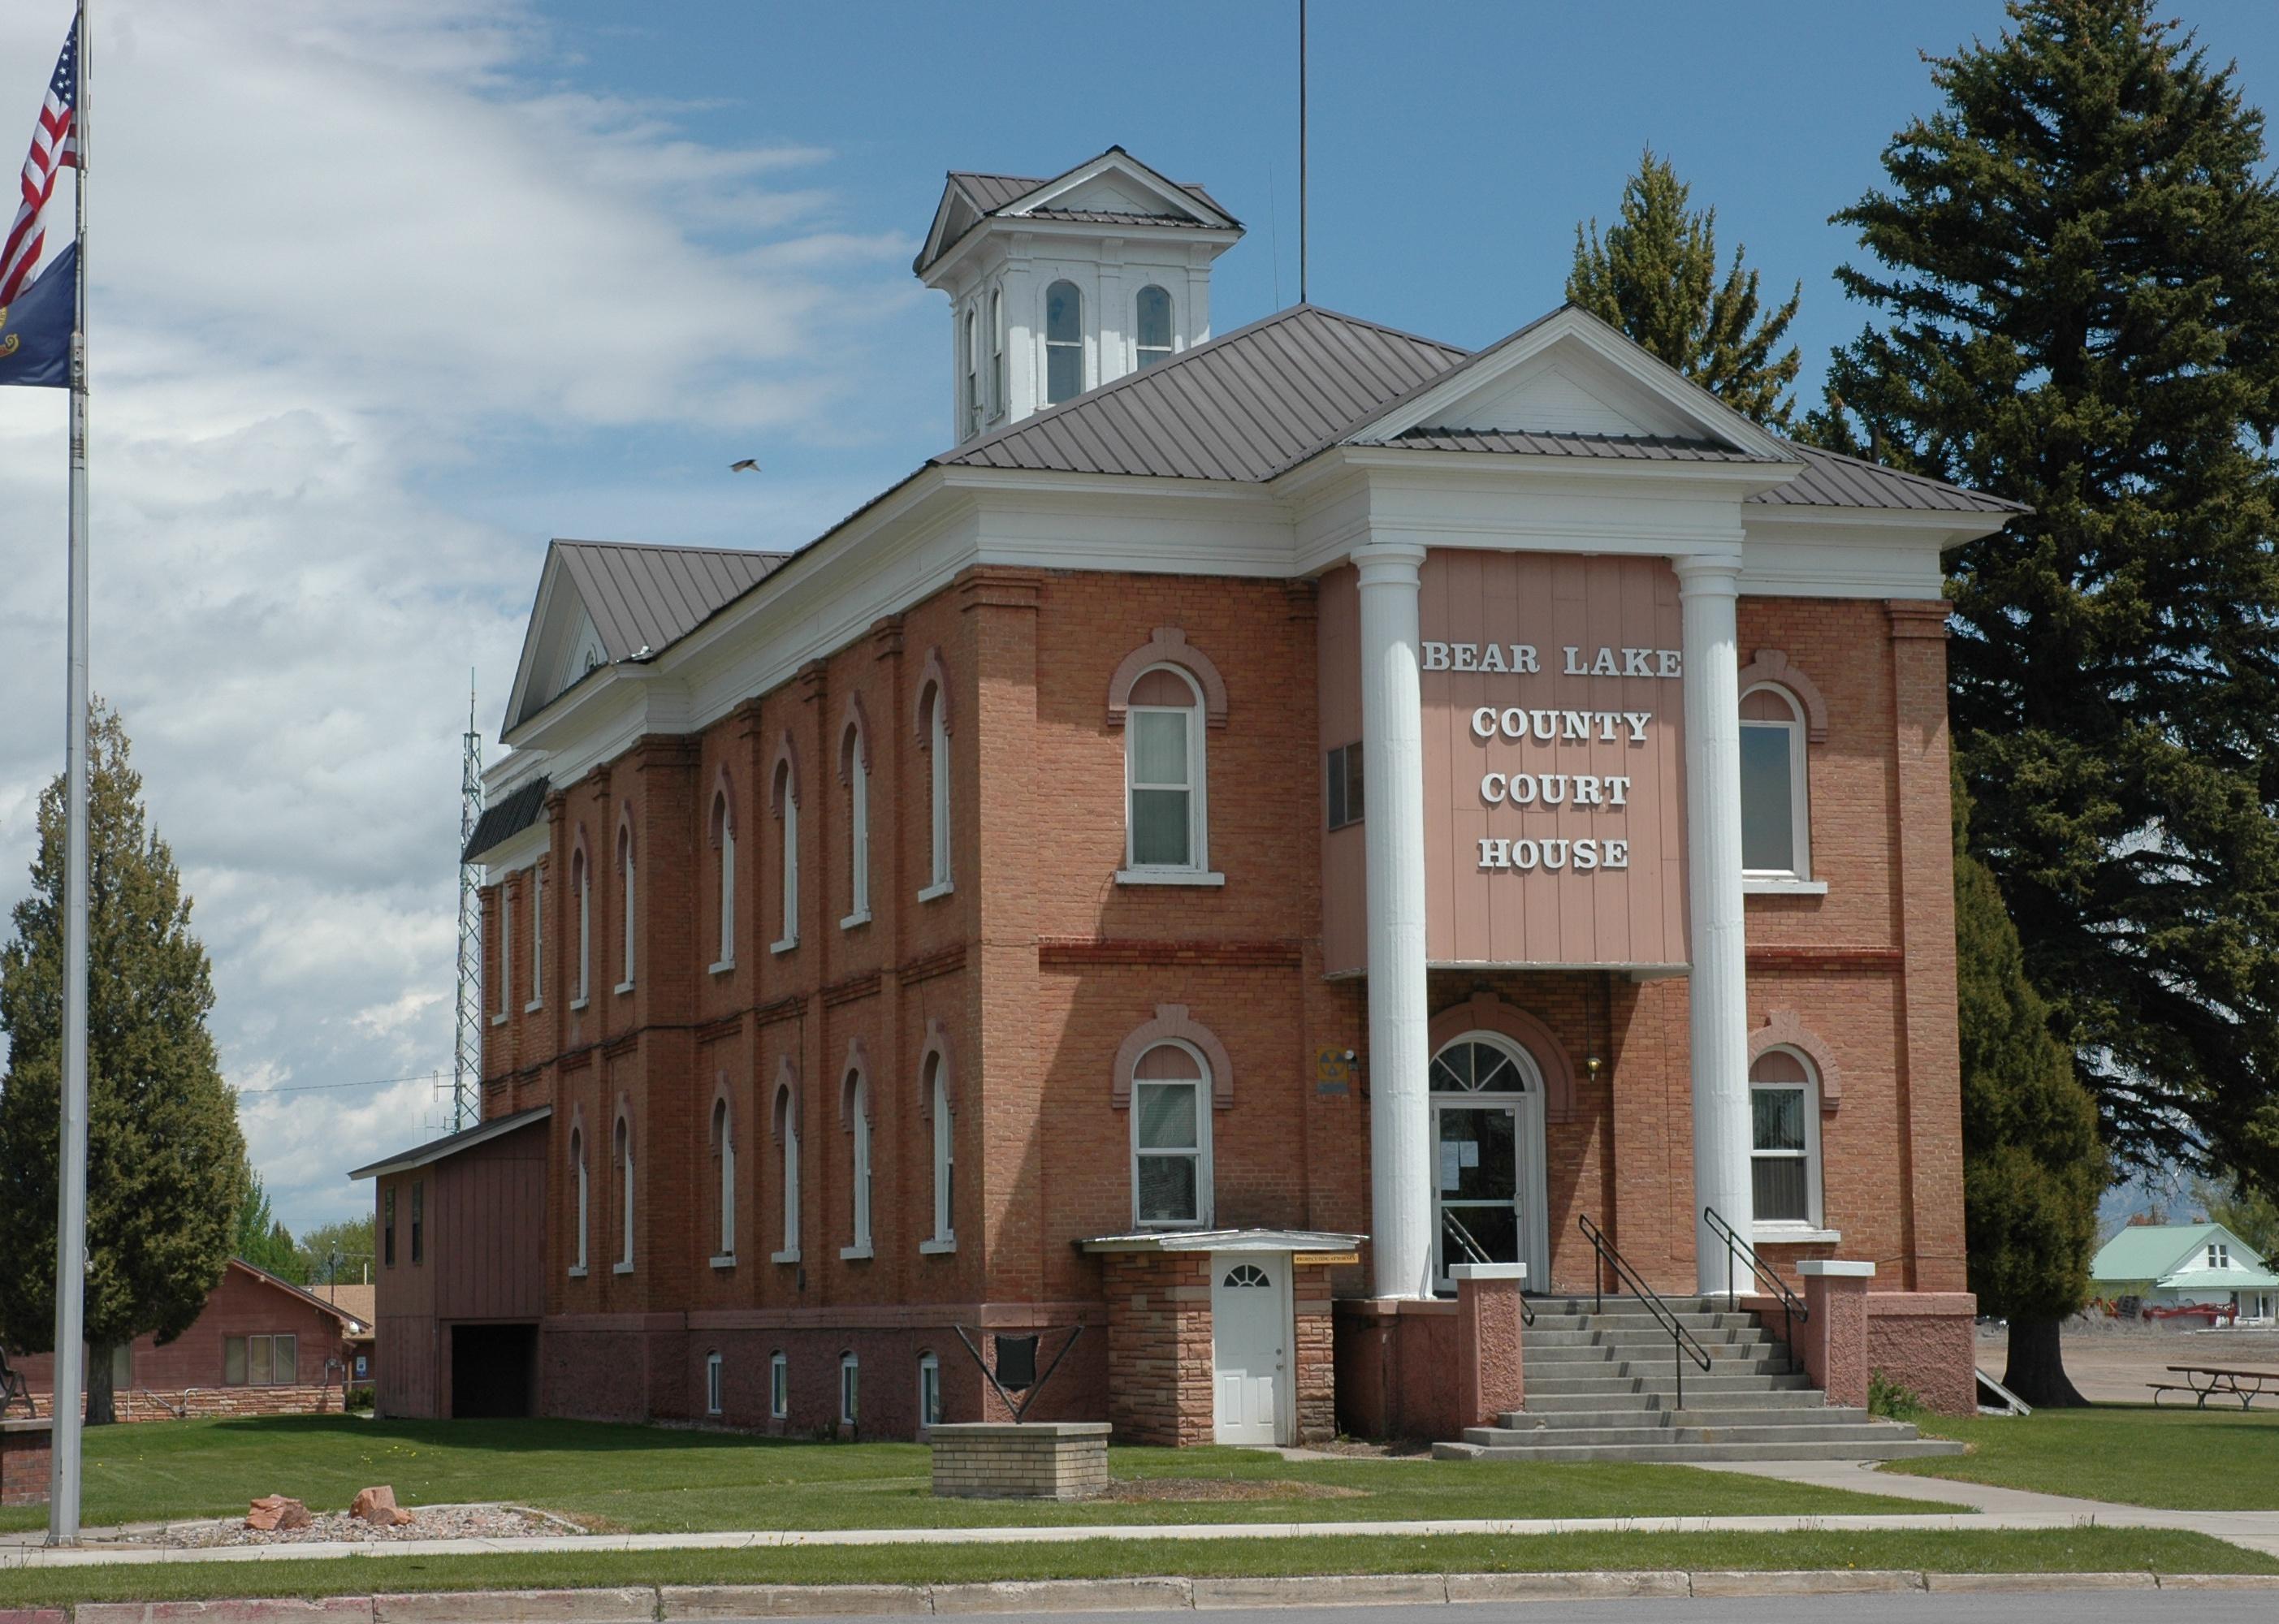
#23. Bear Lake County
– Emergency shelters per 100K people: 31.6 (2 shelters in database)
– Emergency shelter capacity per 100K: 4,375,328 people (276,827 total capacity)
– Shelters with generators: 0
– Shelters in 100-year floodplain: 0

NPS photo // Wikimedia Commons
#22. Gooding County
– Emergency shelters per 100K people: 32.4 (5 shelters in database)
– Emergency shelter capacity per 100K: 5,862,839 people (904,167 total capacity)
– Shelters with generators: 0
– Shelters in 100-year floodplain: 0
Larry D. Moore // Wikimedia Commons
#21. Jerome County
– Emergency shelters per 100K people: 33.2 (8 shelters in database)
– Emergency shelter capacity per 100K: 8,915,988 people (2,147,059 total capacity)
– Shelters with generators: 0
– Shelters in 100-year floodplain: 0
Antony-22 // Wikimedia Commons
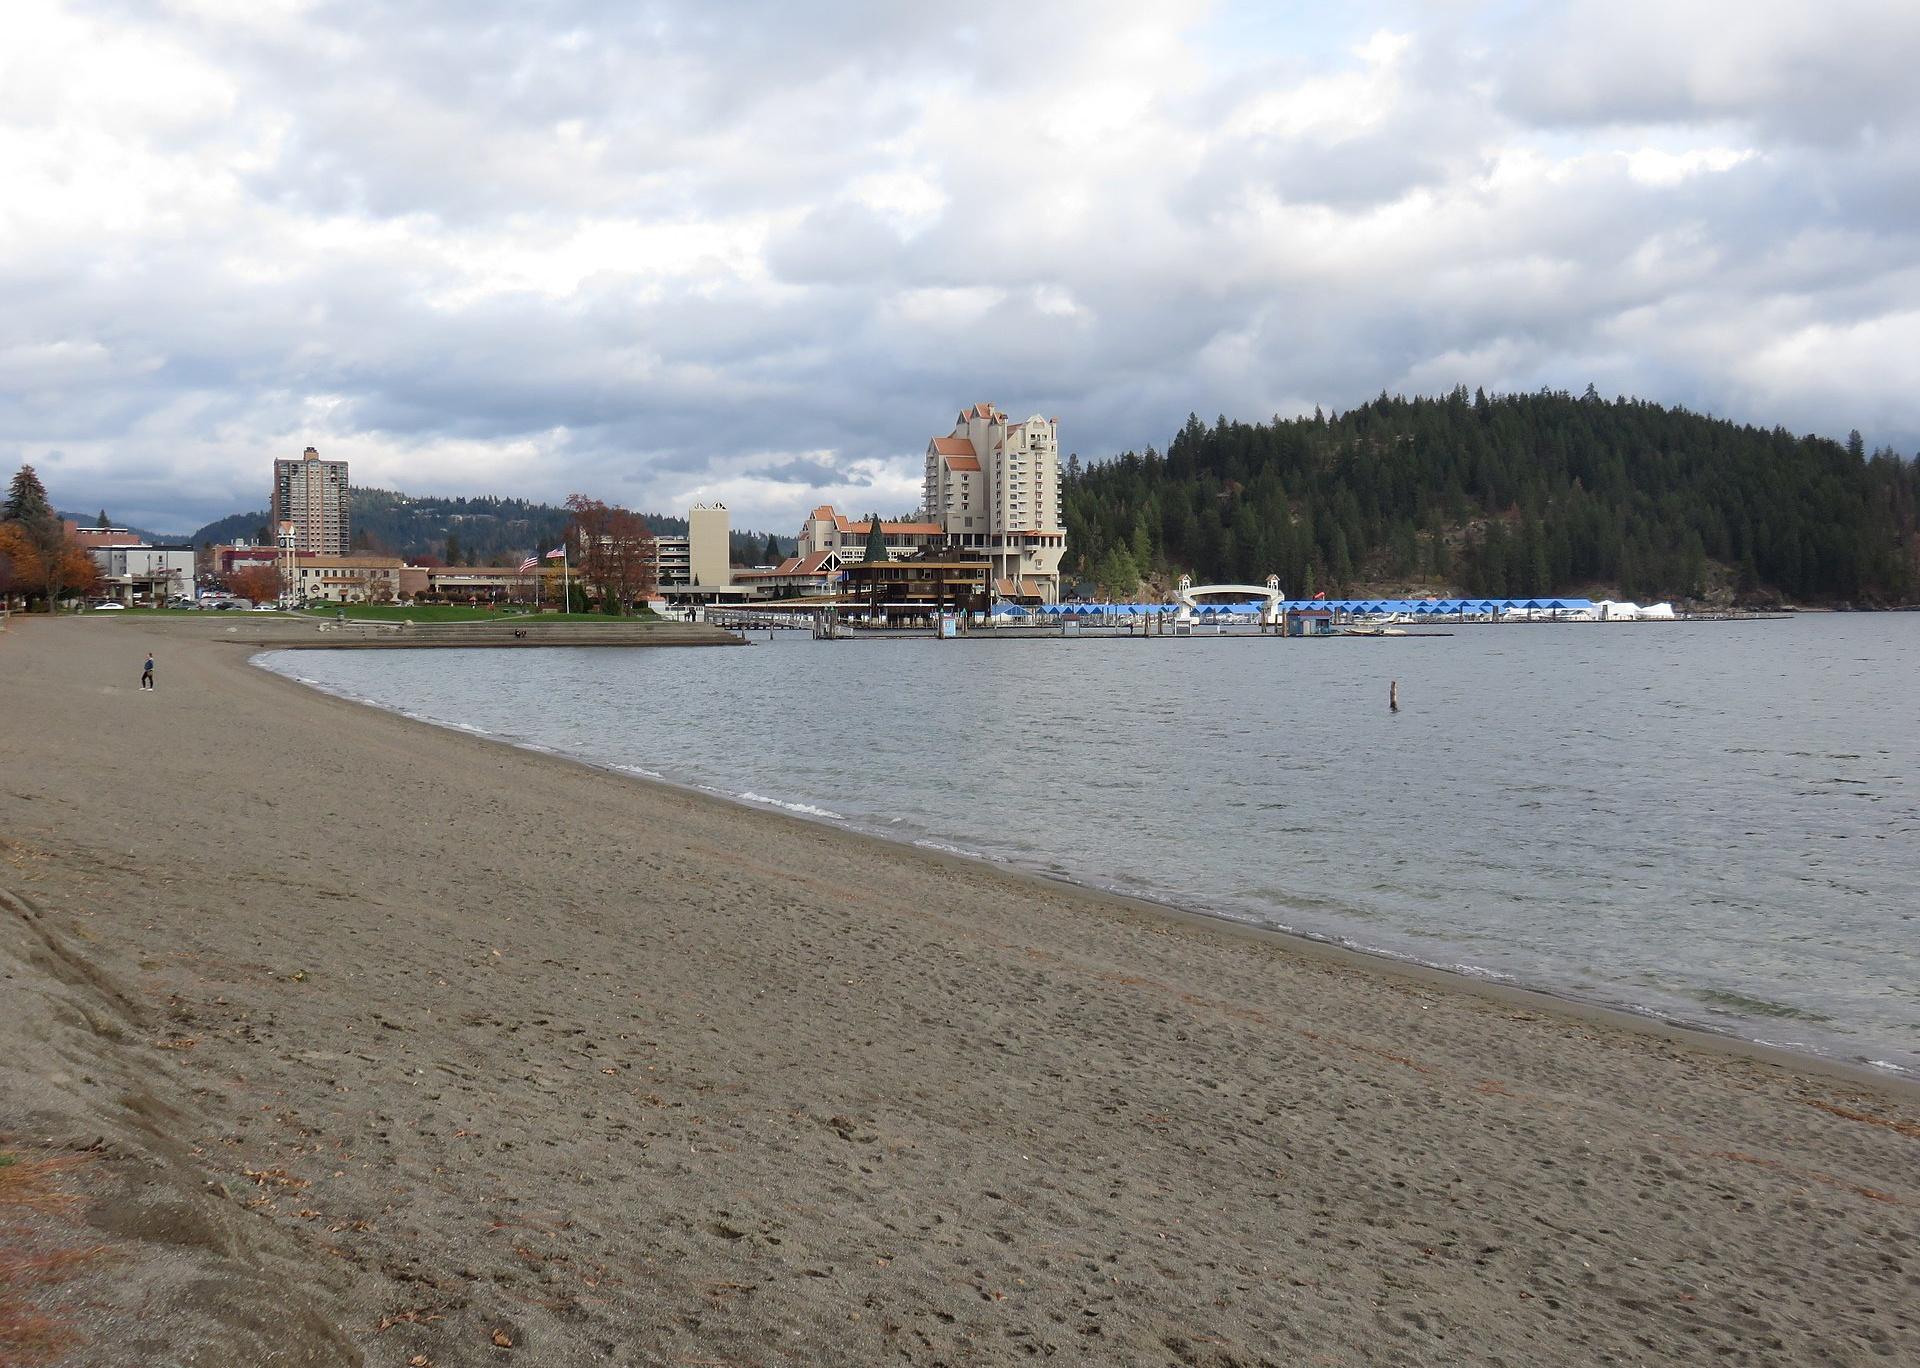
#20. Kootenai County
– Emergency shelters per 100K people: 33.9 (57 shelters in database)
– Emergency shelter capacity per 100K: 8,737,752 people (14,707,122 total capacity)
– Shelters with generators: 2
– Shelters in 100-year floodplain: 0
Bathlander // Wikimedia Commons
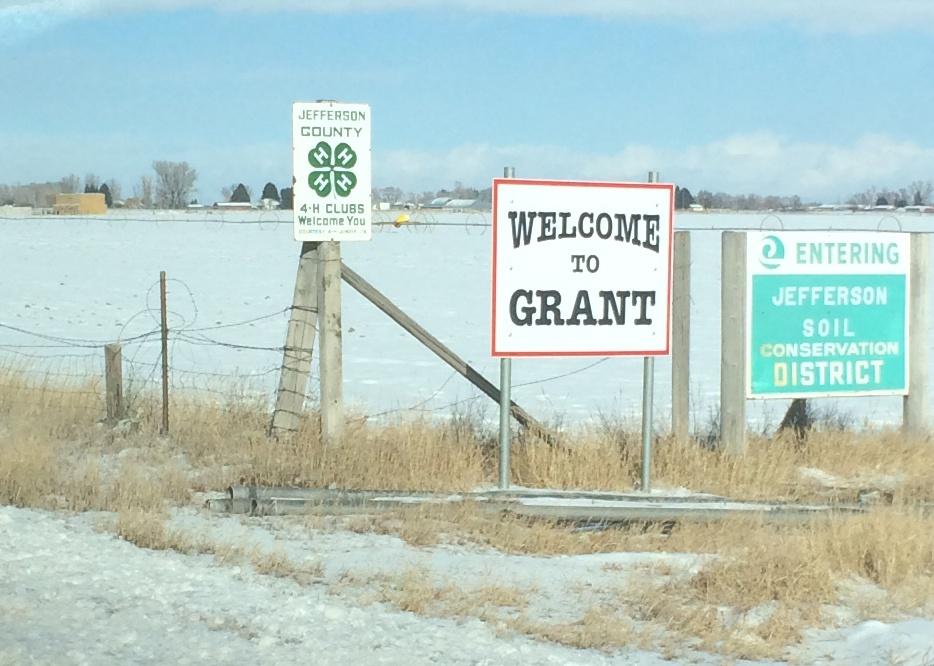
#19. Jefferson County
– Emergency shelters per 100K people: 36.2 (11 shelters in database)
– Emergency shelter capacity per 100K: 12,582,134 people (3,828,366 total capacity)
– Shelters with generators: 0
– Shelters in 100-year floodplain: 0
Sam Beebe // Wikimedia Commons
#18. Washington County
– Emergency shelters per 100K people: 38.4 (4 shelters in database)
– Emergency shelter capacity per 100K: 7,441,640 people (775,791 total capacity)
– Shelters with generators: 0
– Shelters in 100-year floodplain: 0
Greg L. Wright // Wikimedia Commons
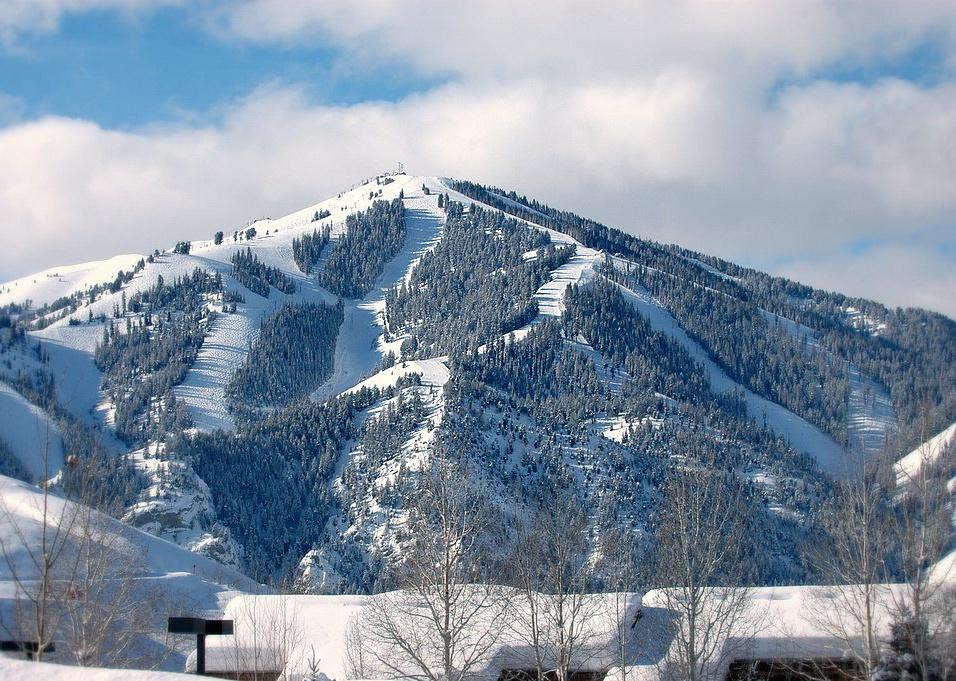
#17. Blaine County
– Emergency shelters per 100K people: 41.9 (10 shelters in database)
– Emergency shelter capacity per 100K: 9,395,873 people (2,242,607 total capacity)
– Shelters with generators: 1
– Shelters in 100-year floodplain: 0
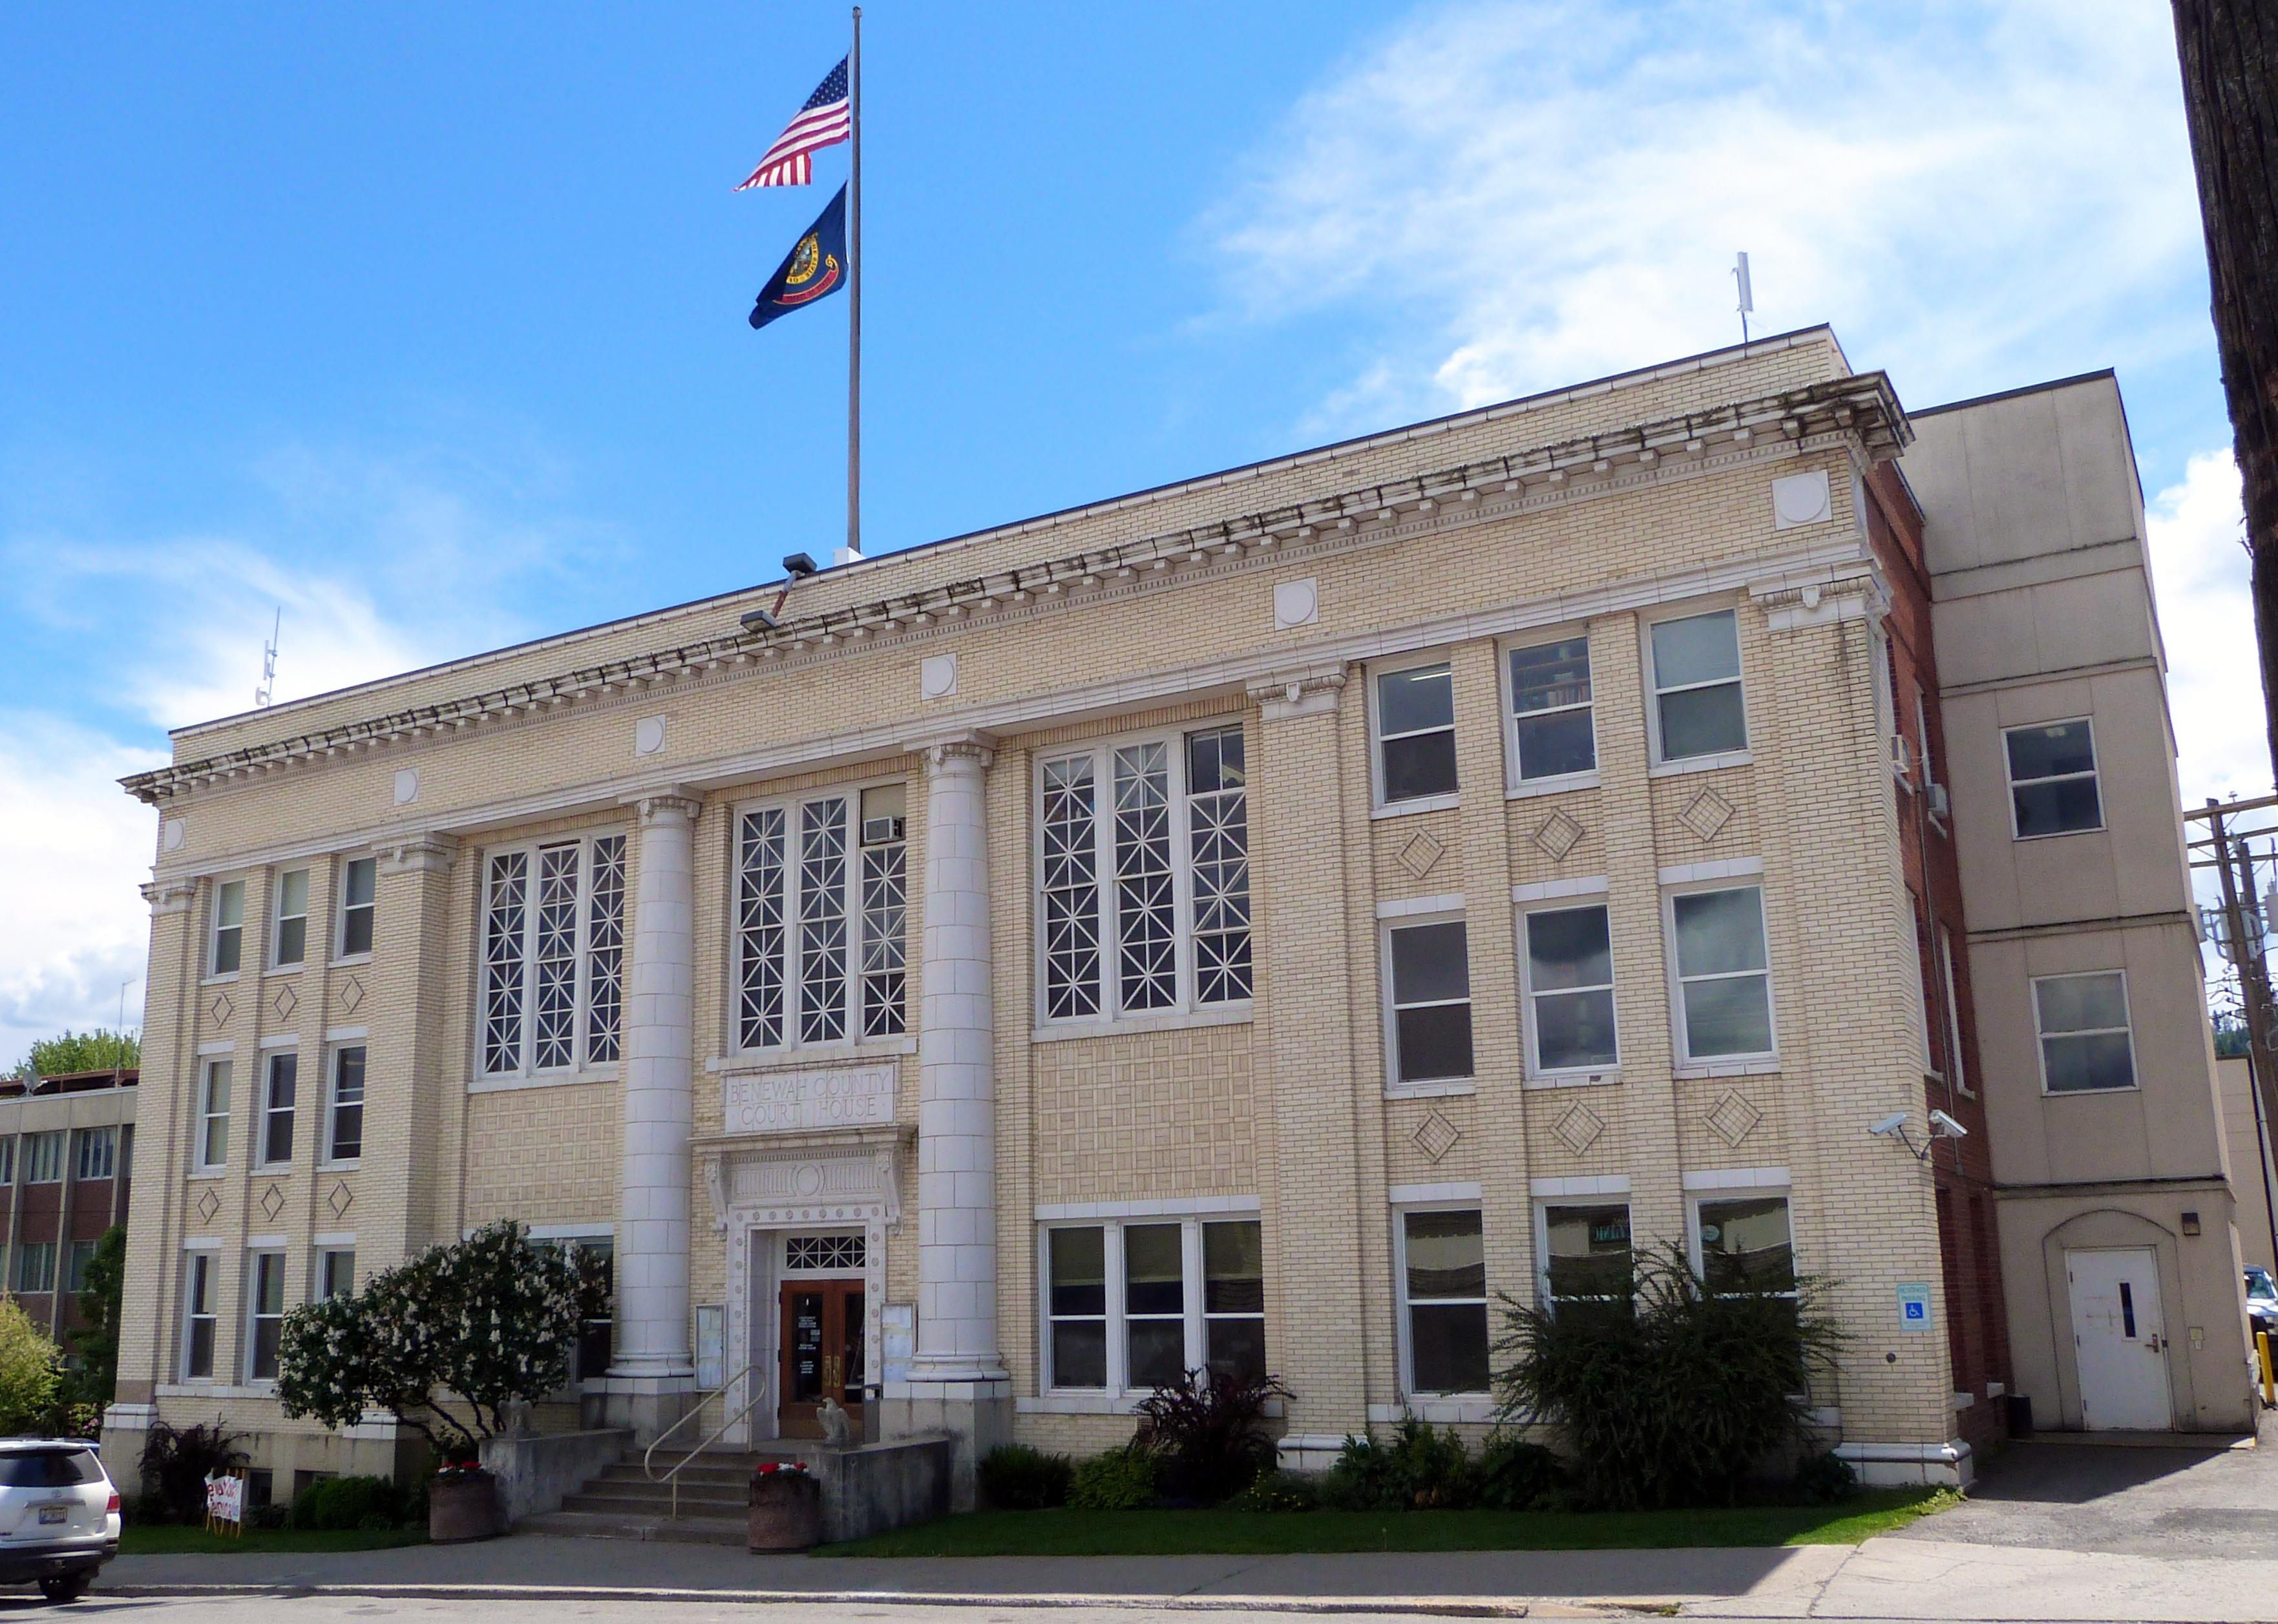
Ian Poellet // Wikimedia Commons
#16. Benewah County
– Emergency shelters per 100K people: 42.1 (4 shelters in database)
– Emergency shelter capacity per 100K: 8,116,069 people (771,757 total capacity)
– Shelters with generators: 0
– Shelters in 100-year floodplain: 0
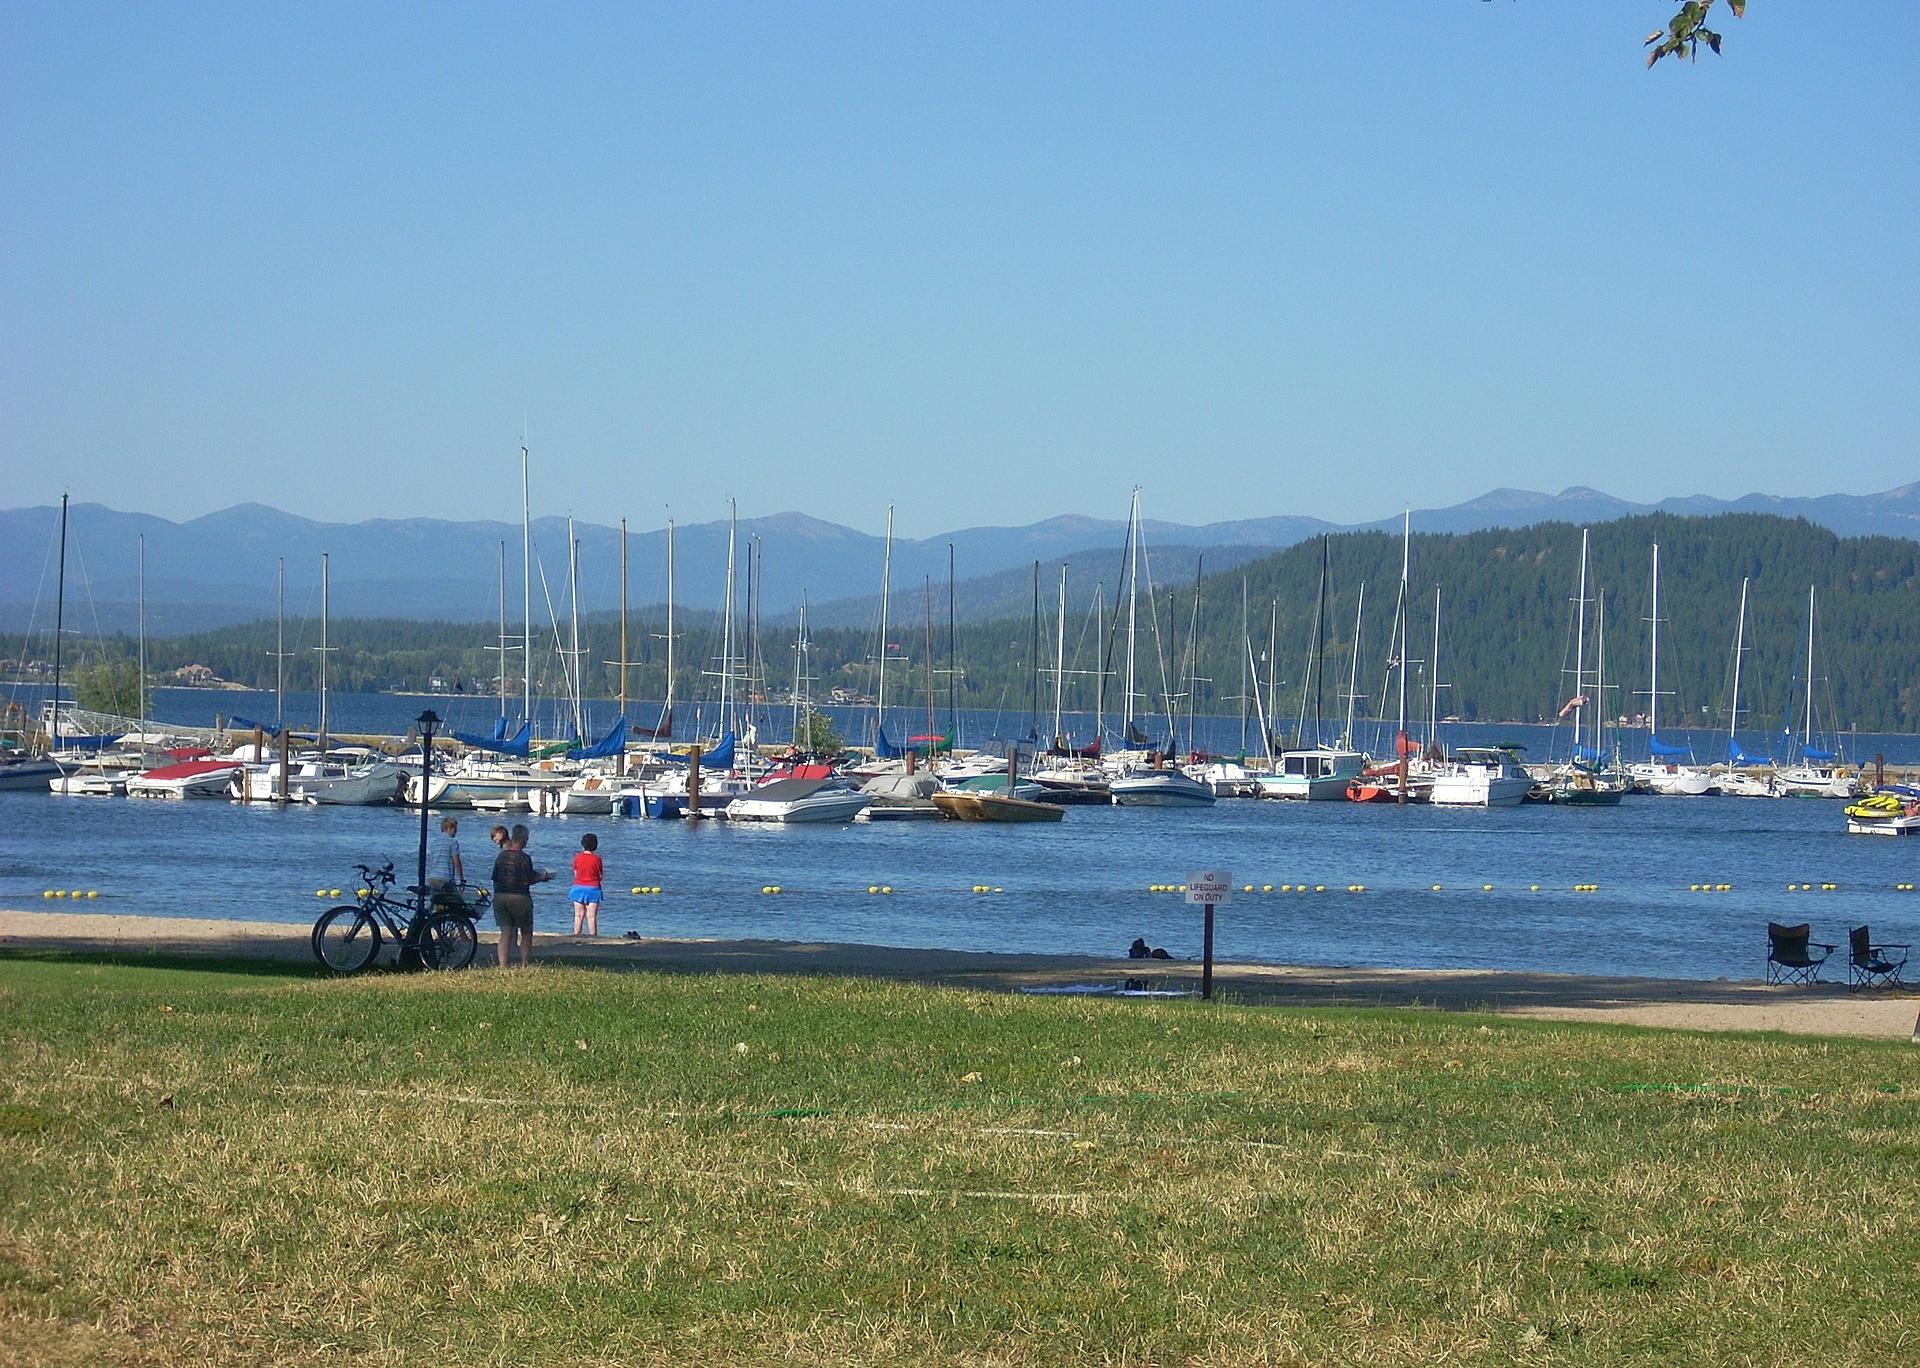
L’Aquatique // Wikimedia Commons
#15. Bonner County
– Emergency shelters per 100K people: 51.6 (24 shelters in database)
– Emergency shelter capacity per 100K: 8,434,070 people (3,920,240 total capacity)
– Shelters with generators: 3
– Shelters in 100-year floodplain: 0
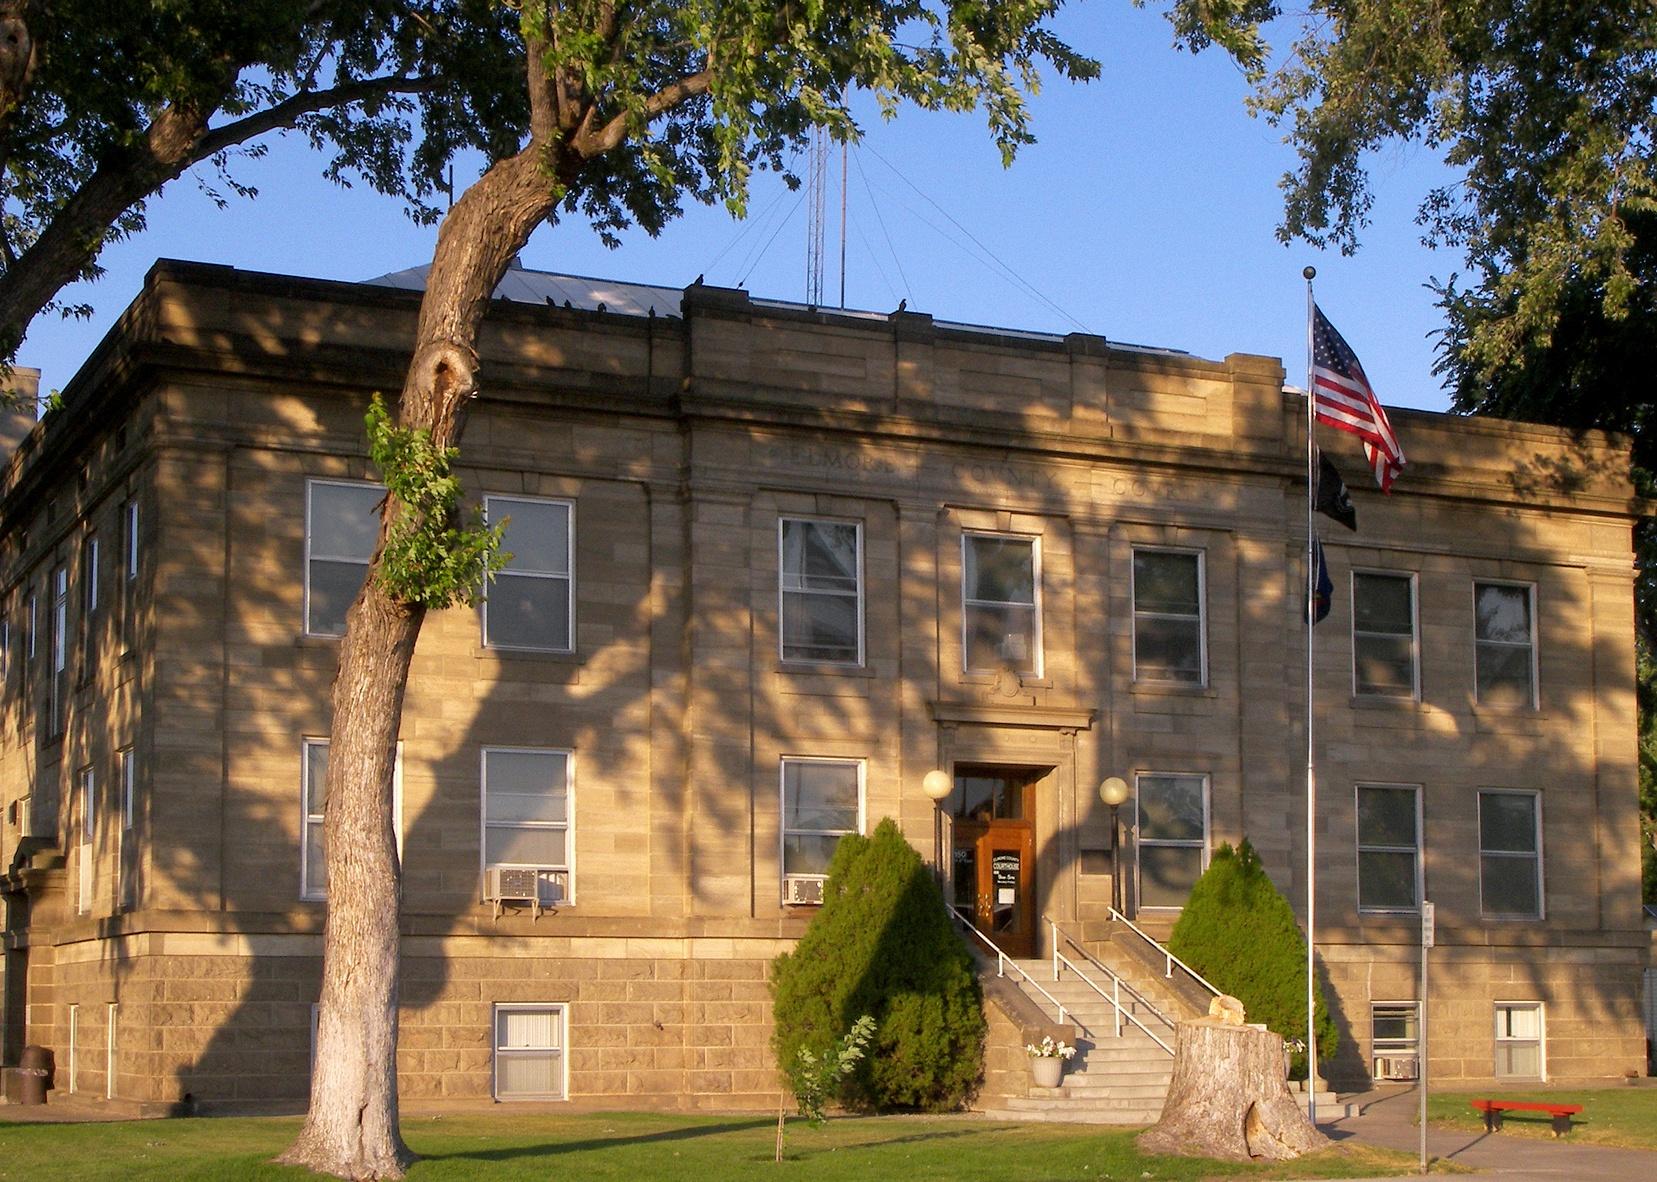
Larry D. Moore // Wikimedia Commons
#14. Elmore County
– Emergency shelters per 100K people: 52.8 (15 shelters in database)
– Emergency shelter capacity per 100K: 9,576,627 people (2,719,379 total capacity)
– Shelters with generators: 0
– Shelters in 100-year floodplain: 0
Apstrinka // Wikimedia Commons
#13. Latah County
– Emergency shelters per 100K people: 55.7 (22 shelters in database)
– Emergency shelter capacity per 100K: 10,886,798 people (4,296,366 total capacity)
– Shelters with generators: 2
– Shelters in 100-year floodplain: 0
Karthikc123 // Wikimedia Commons
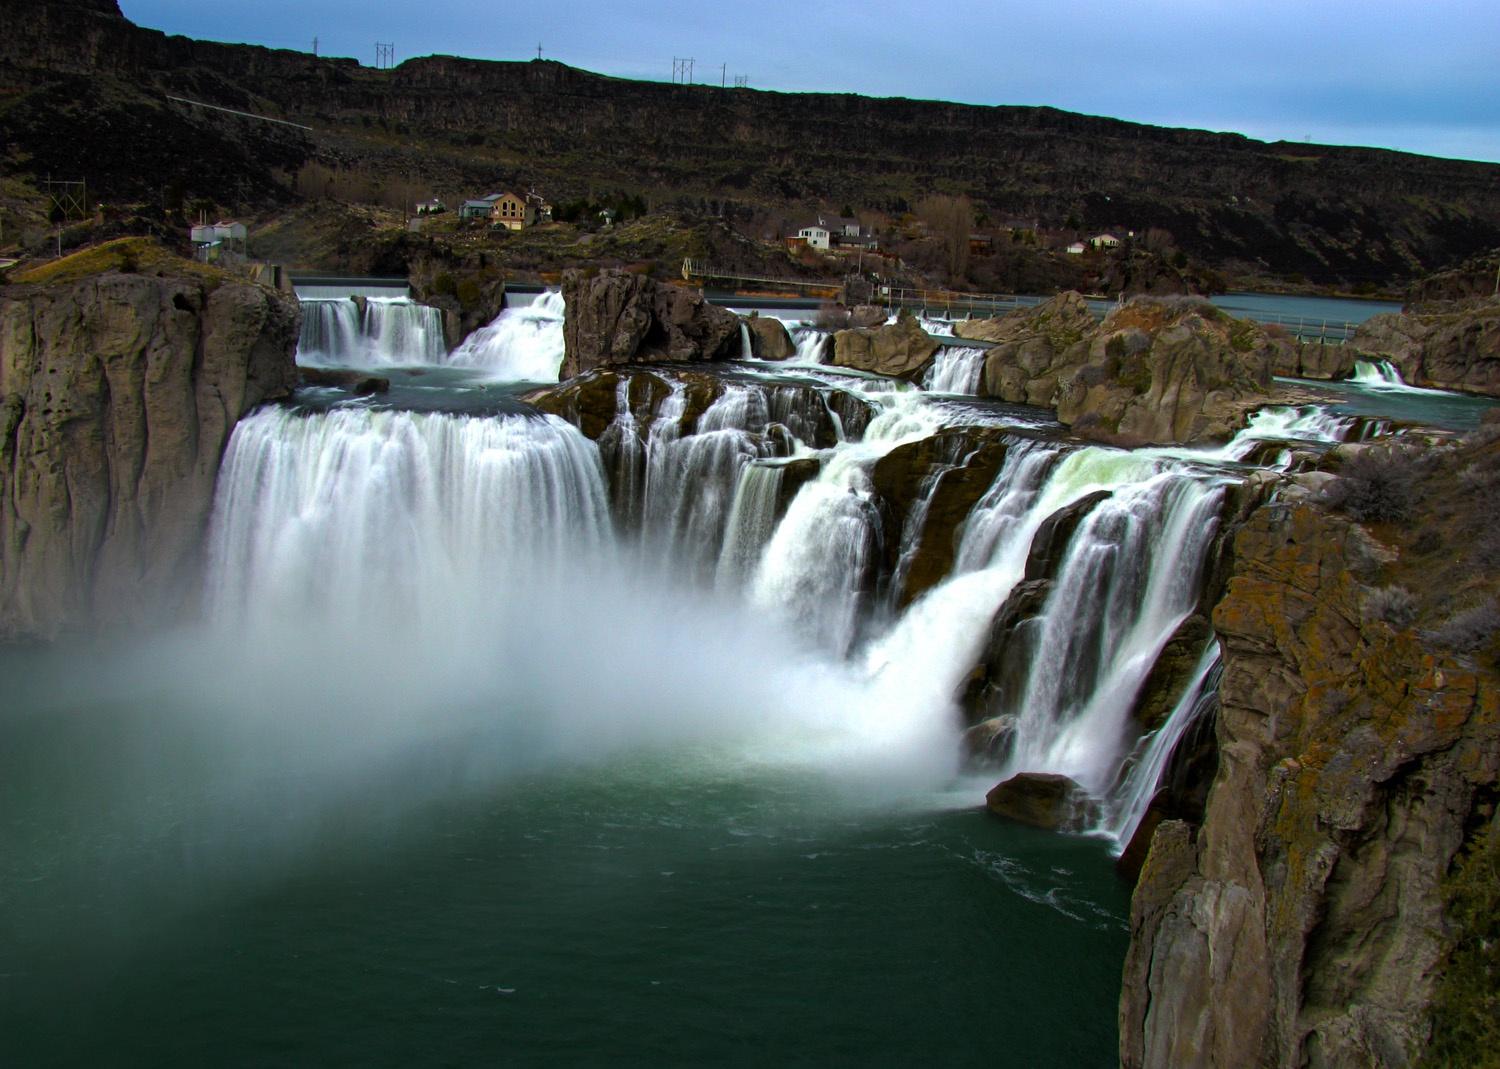
#12. Twin Falls County
– Emergency shelters per 100K people: 62.8 (56 shelters in database)
– Emergency shelter capacity per 100K: 15,923,895 people (14,192,649 total capacity)
– Shelters with generators: 0
– Shelters in 100-year floodplain: 0
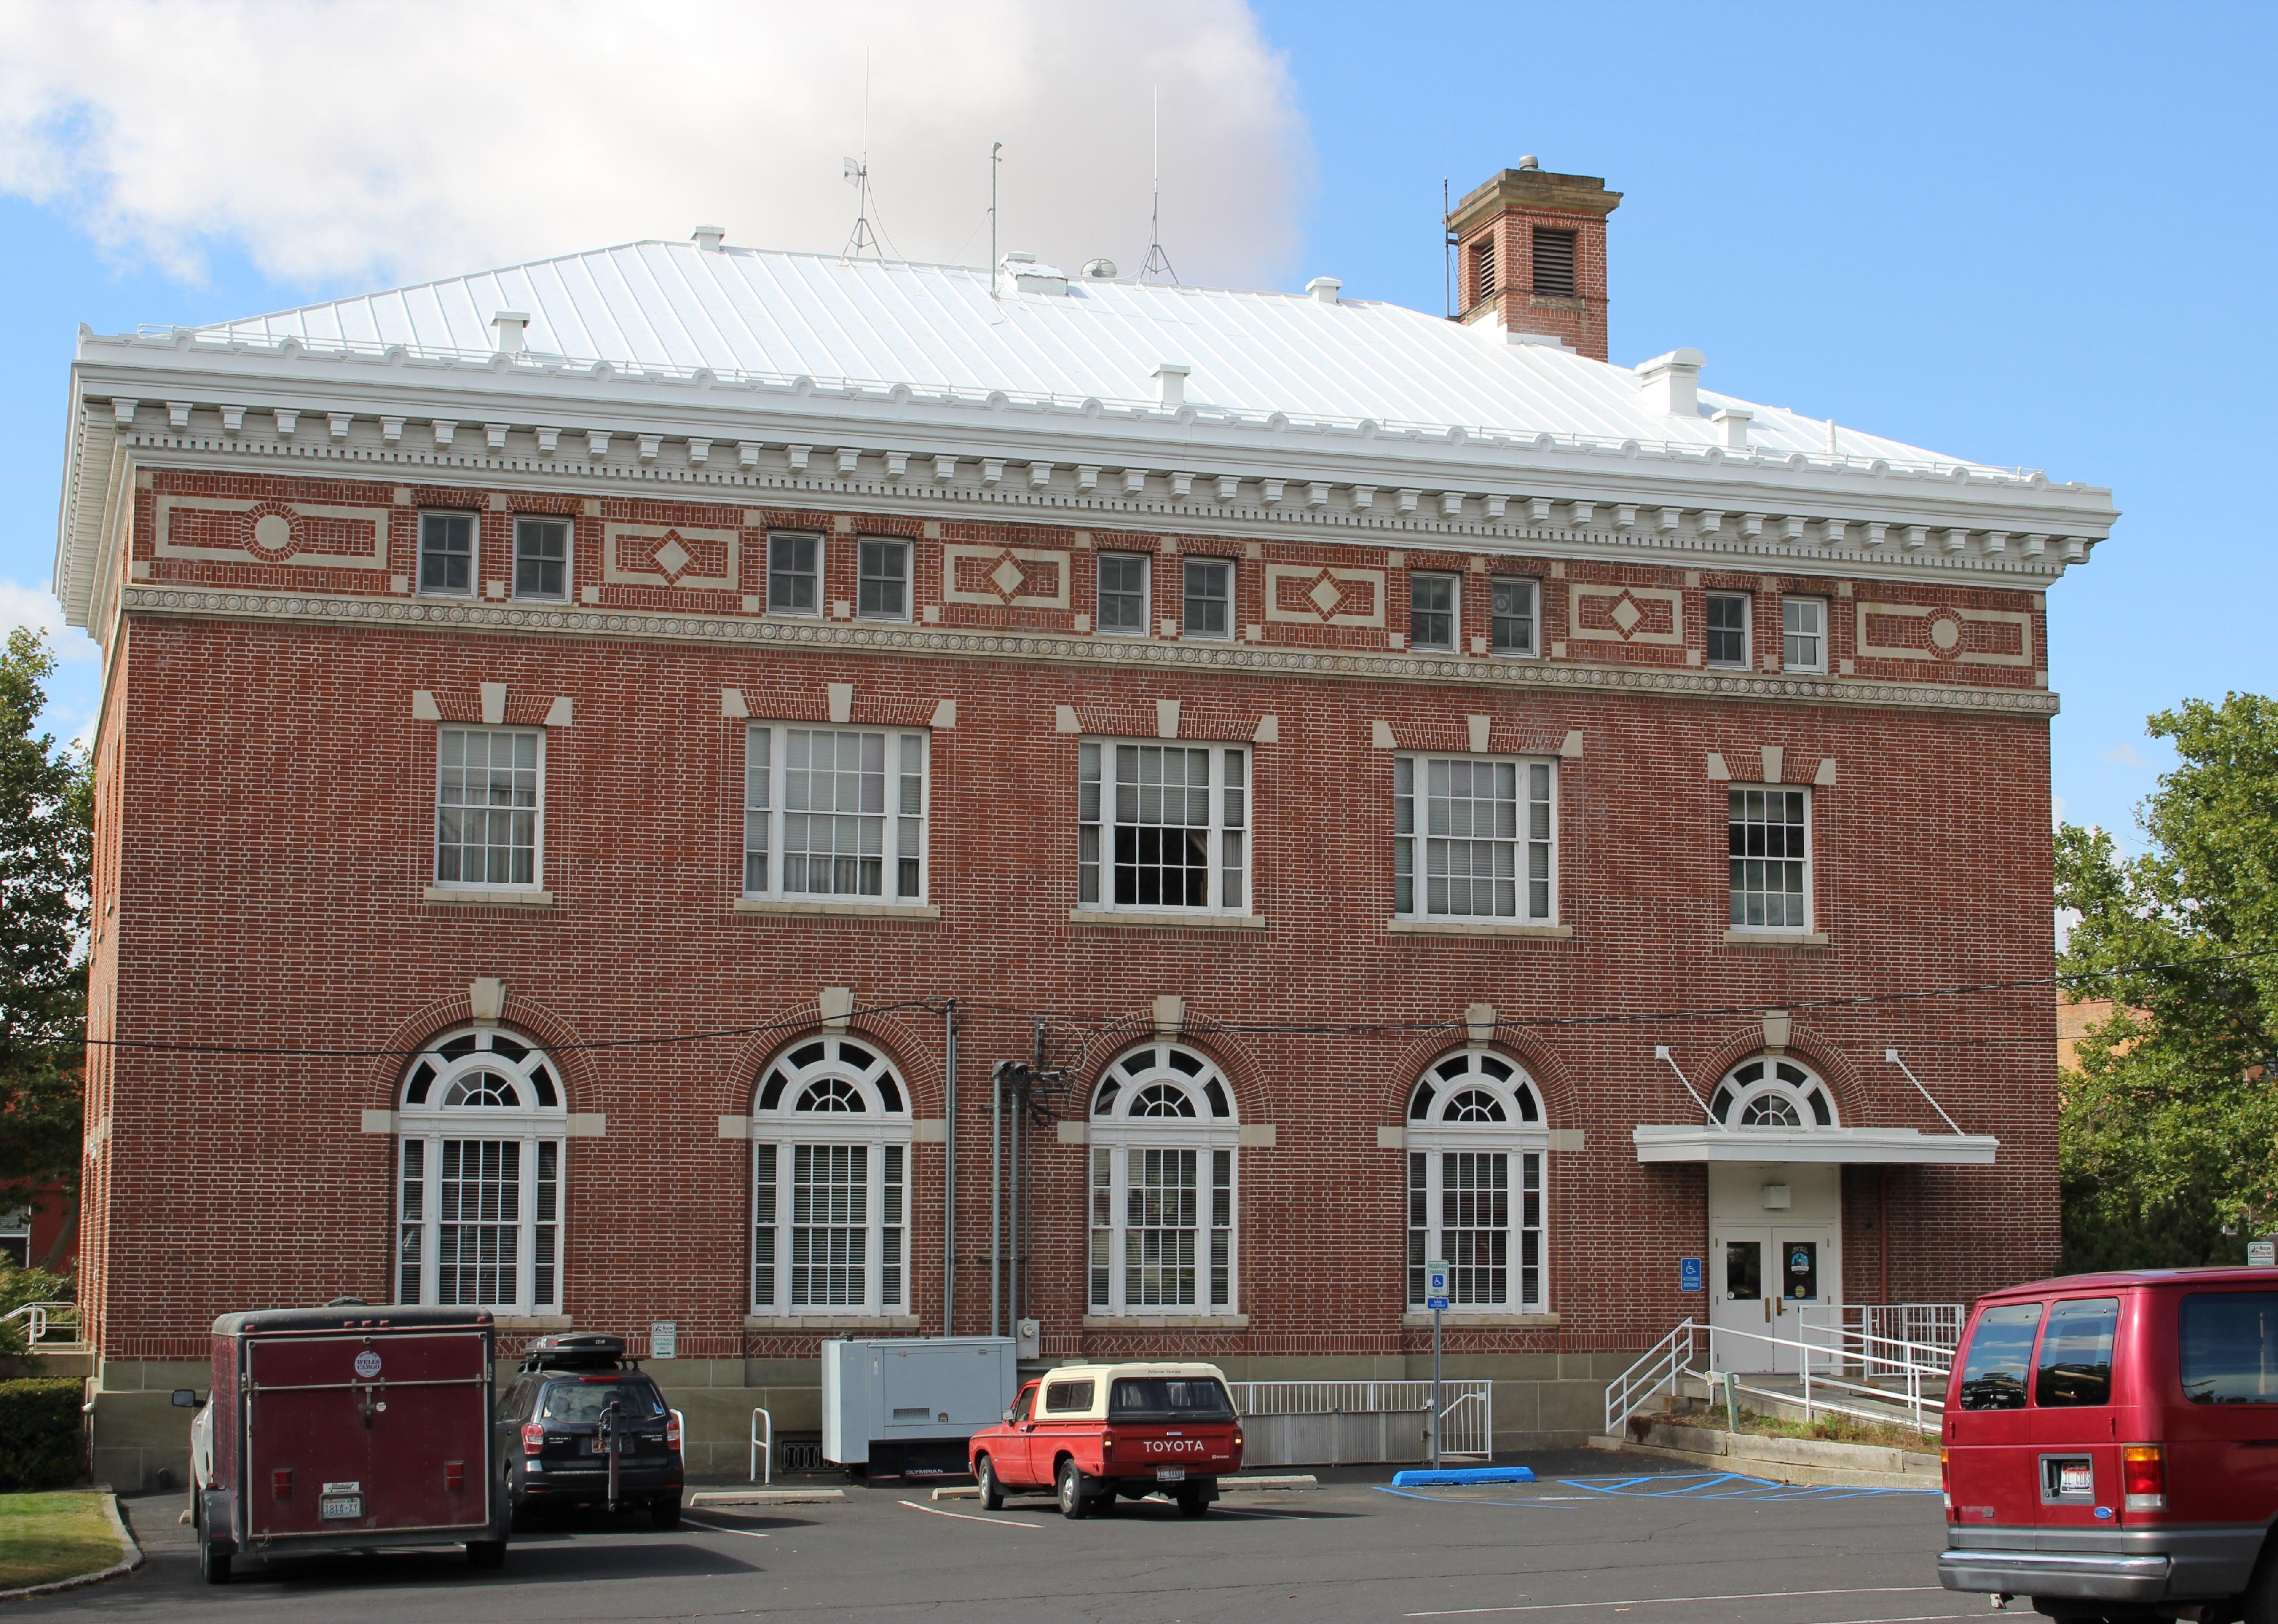
![]()
Jon Roanhaus // Wikimedia Commons
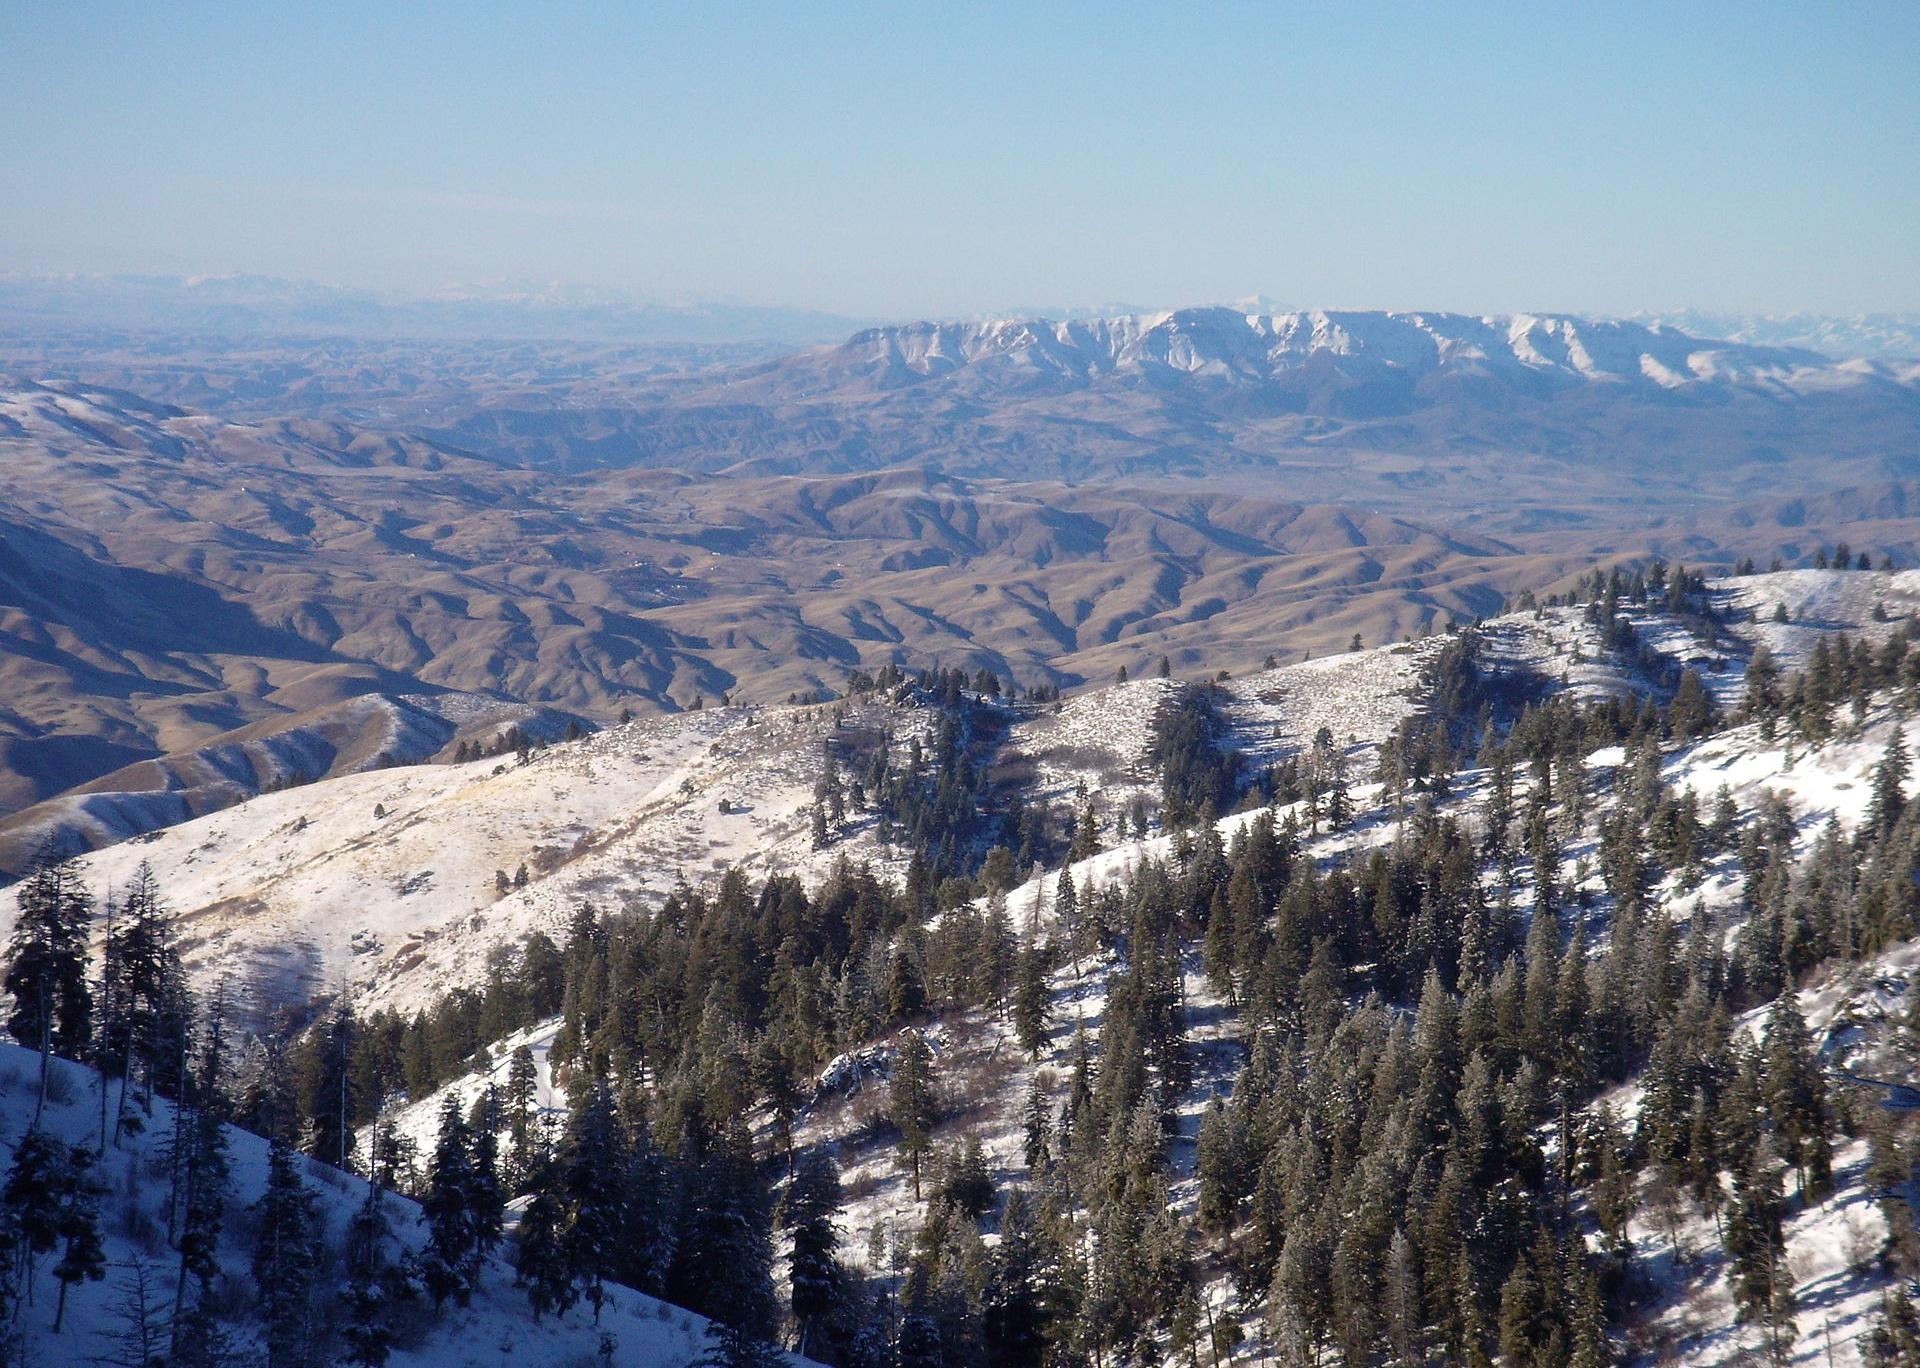
#11. Clearwater County
– Emergency shelters per 100K people: 68.8 (6 shelters in database)
– Emergency shelter capacity per 100K: 16,339,156 people (1,424,611 total capacity)
– Shelters with generators: 0
– Shelters in 100-year floodplain: 0
Dsdugan // Wikimedia Commons
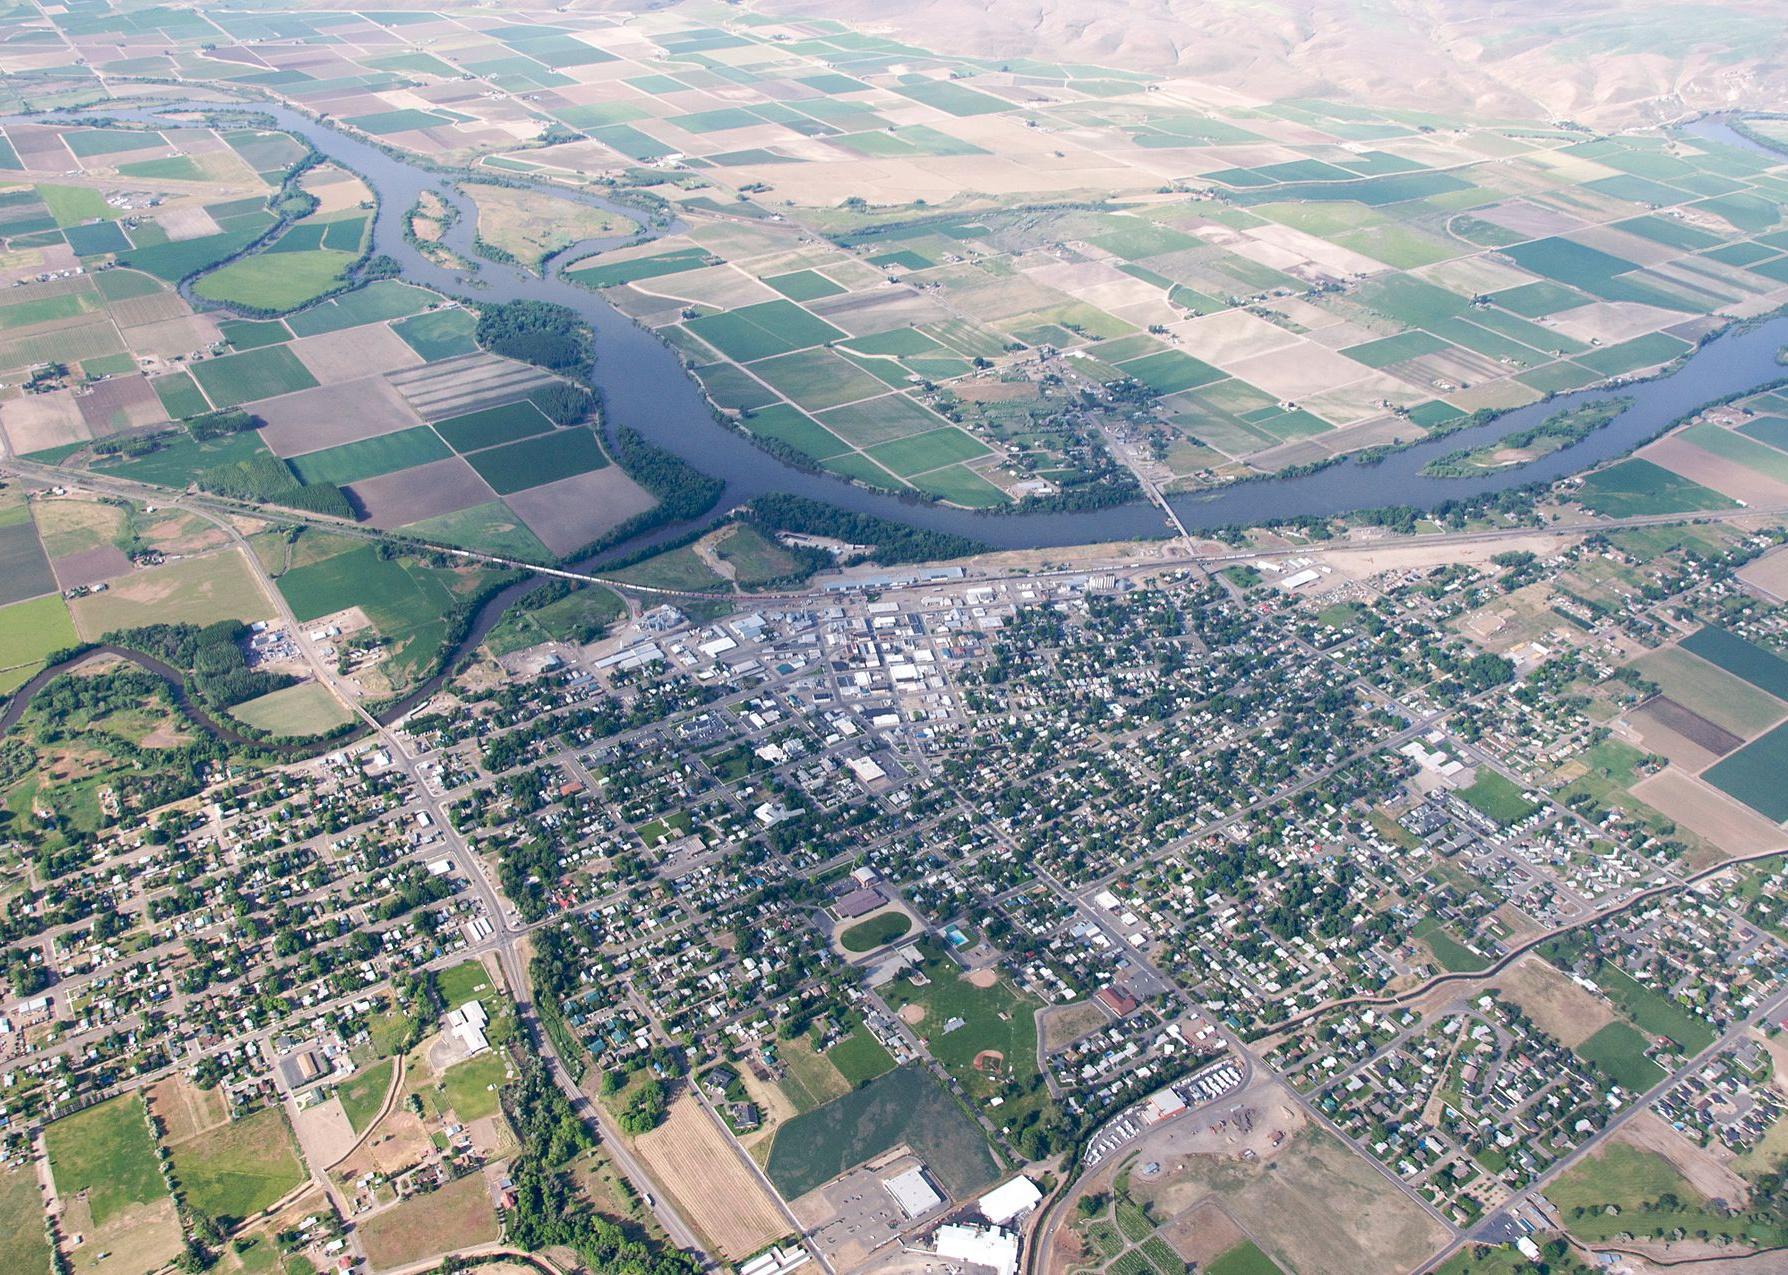
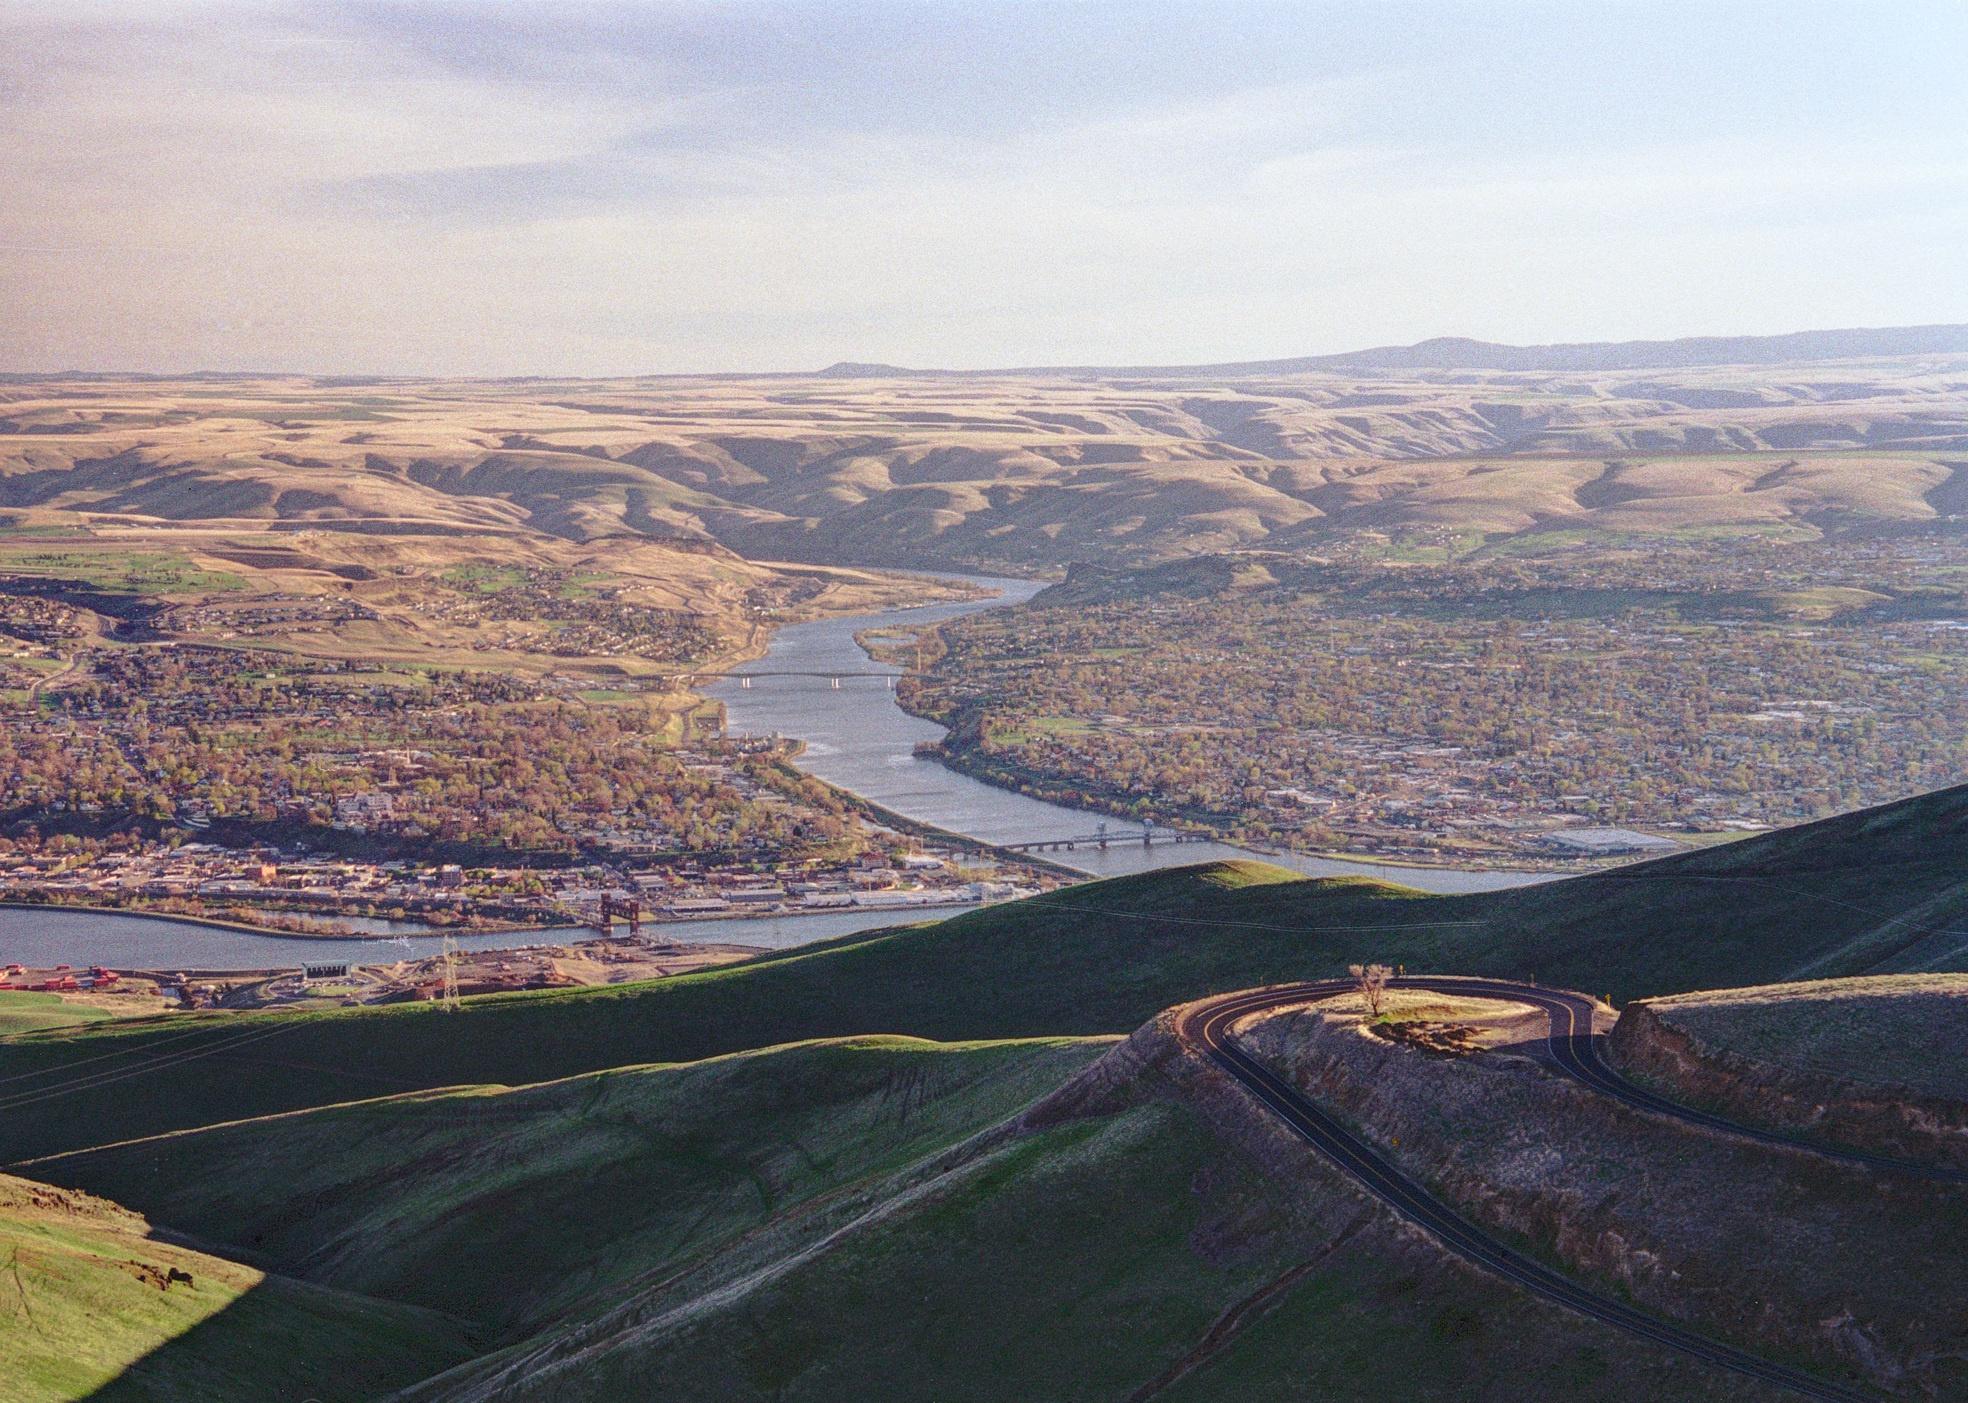
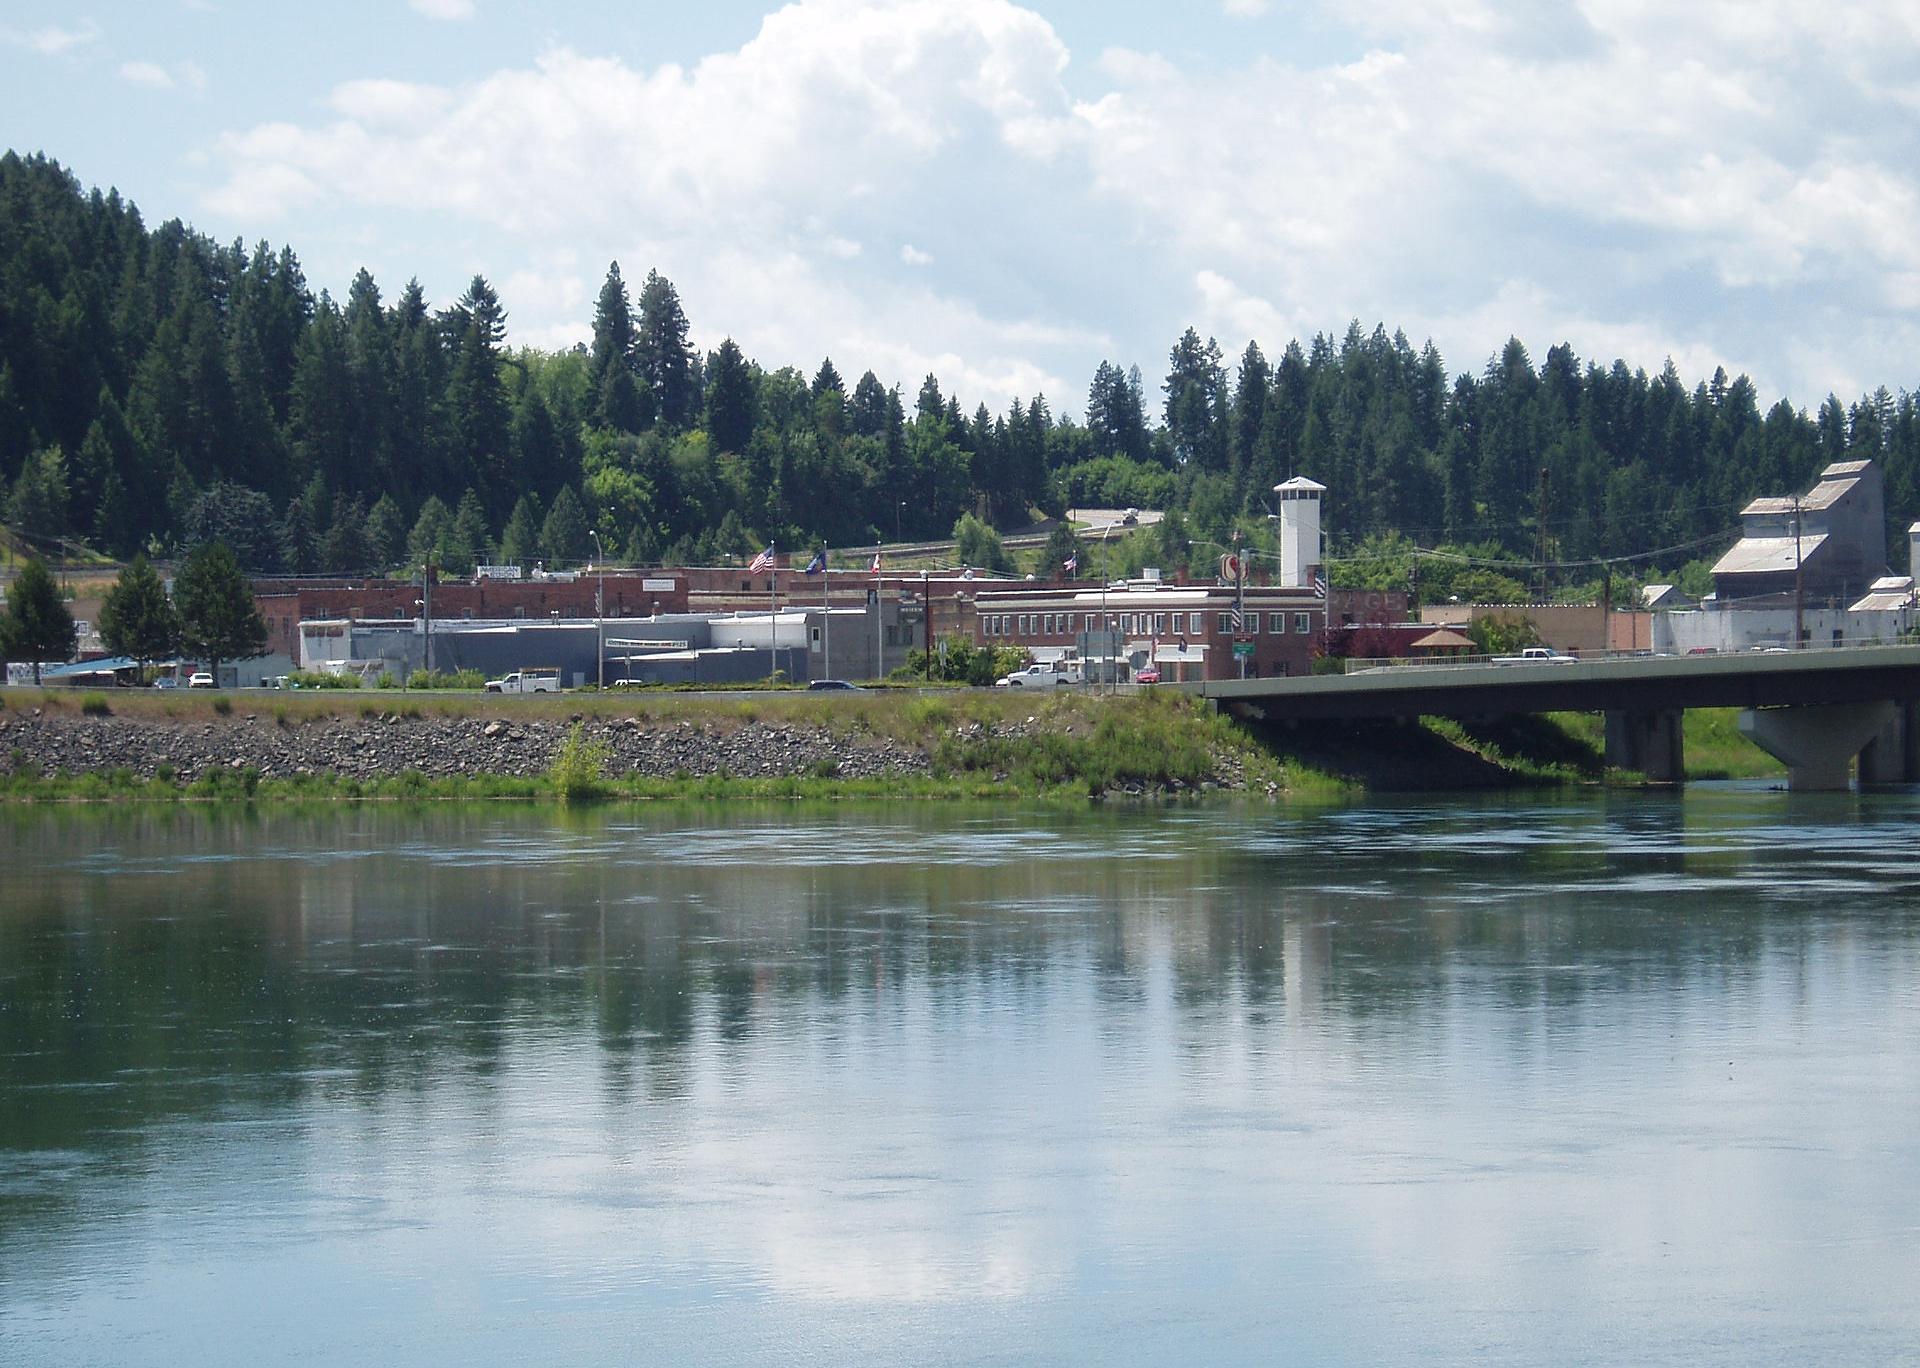
#10. Nez Perce County
– Emergency shelters per 100K people: 69.3 (29 shelters in database)
– Emergency shelter capacity per 100K: 14,286,853 people (5,974,762 total capacity)
– Shelters with generators: 1
– Shelters in 100-year floodplain: 0
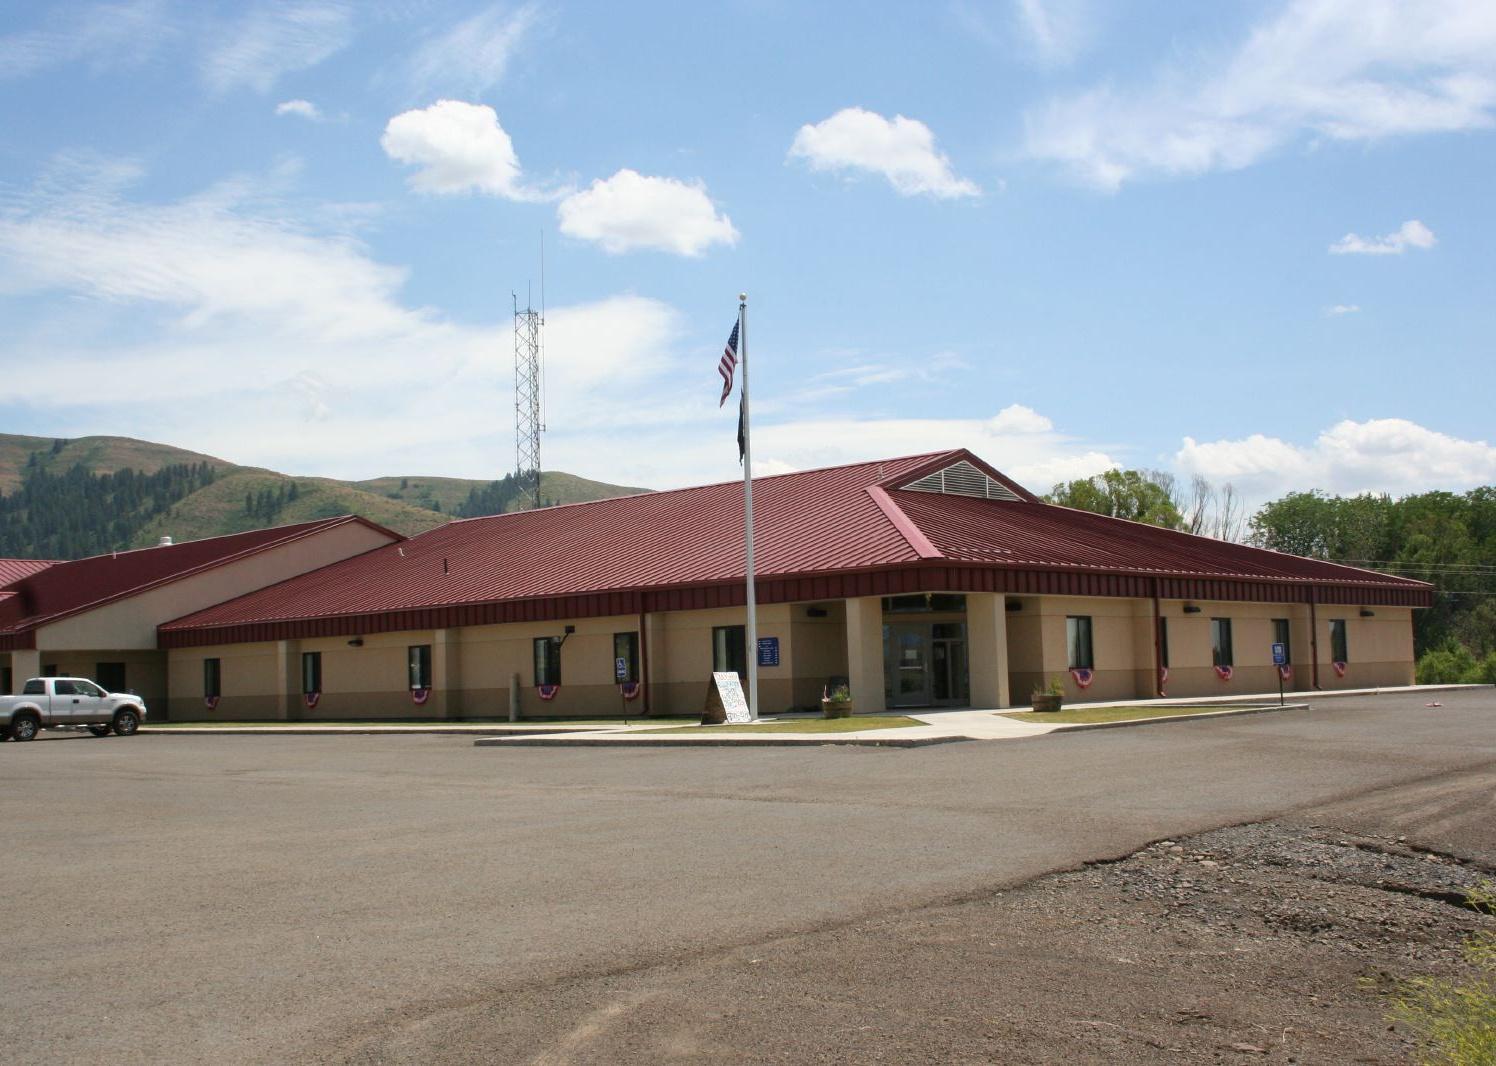
Ken Lund // Wikimedia Commons
#9. Adams County
– Emergency shelters per 100K people: 69.4 (3 shelters in database)
– Emergency shelter capacity per 100K: 9,618,607 people (415,620 total capacity)
– Shelters with generators: 0
– Shelters in 100-year floodplain: 0
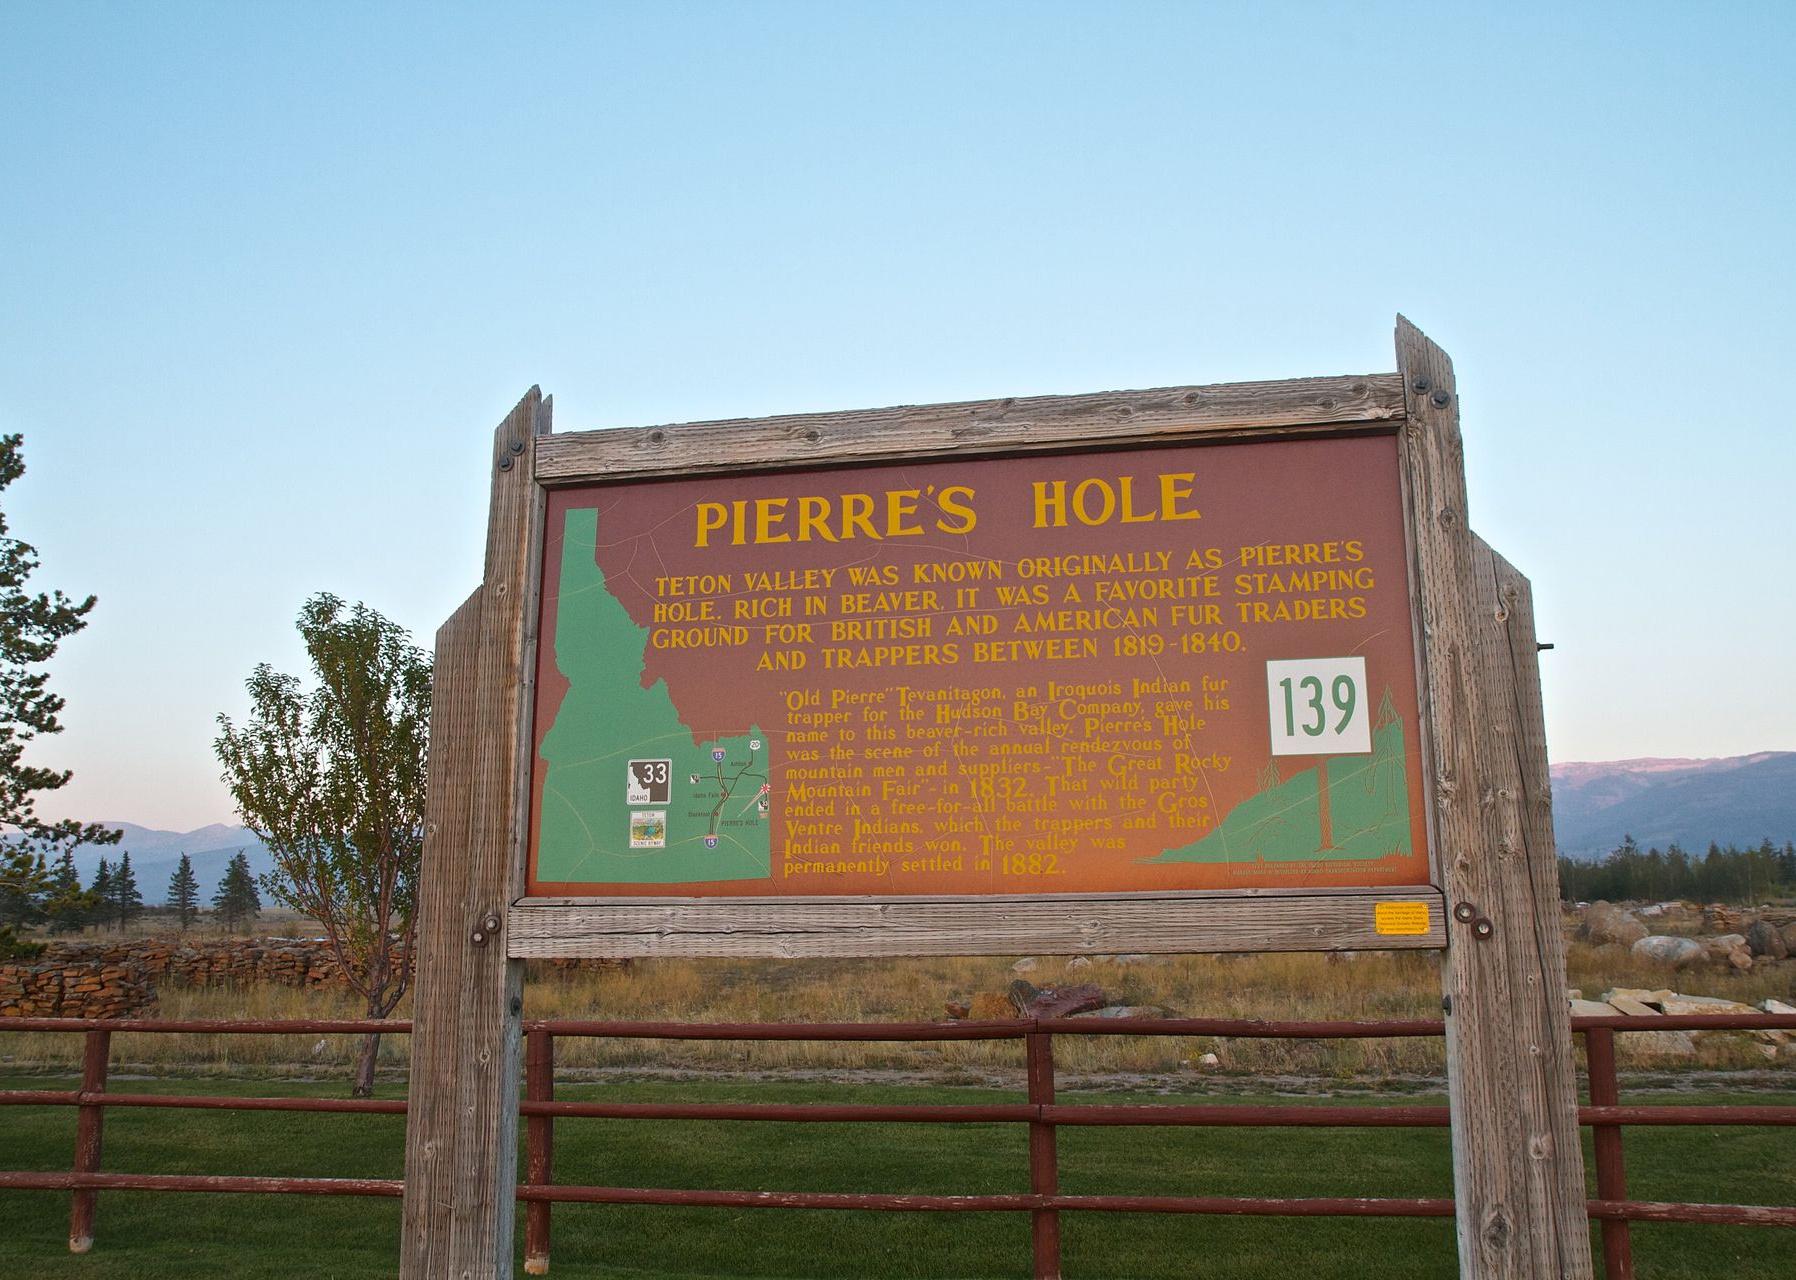
Lowjumpingfrog // Wikimedia Commons
#8. Teton County
– Emergency shelters per 100K people: 69.6 (8 shelters in database)
– Emergency shelter capacity per 100K: 23,978,285 people (2,755,105 total capacity)
– Shelters with generators: 0
– Shelters in 100-year floodplain: 0
Forest Service Northern Region from Missoula, MT, USA // Wikimedia Commons
#7. Idaho County
– Emergency shelters per 100K people: 78.8 (13 shelters in database)
– Emergency shelter capacity per 100K: 17,425,579 people (2,874,175 total capacity)
– Shelters with generators: 0
– Shelters in 100-year floodplain: 0
Federal Highway Administration // Wikimedia Commons
#6. Boundary County
– Emergency shelters per 100K people: 91.9 (11 shelters in database)
– Emergency shelter capacity per 100K: 18,179,542 people (2,175,364 total capacity)
– Shelters with generators: 0
– Shelters in 100-year floodplain: 1
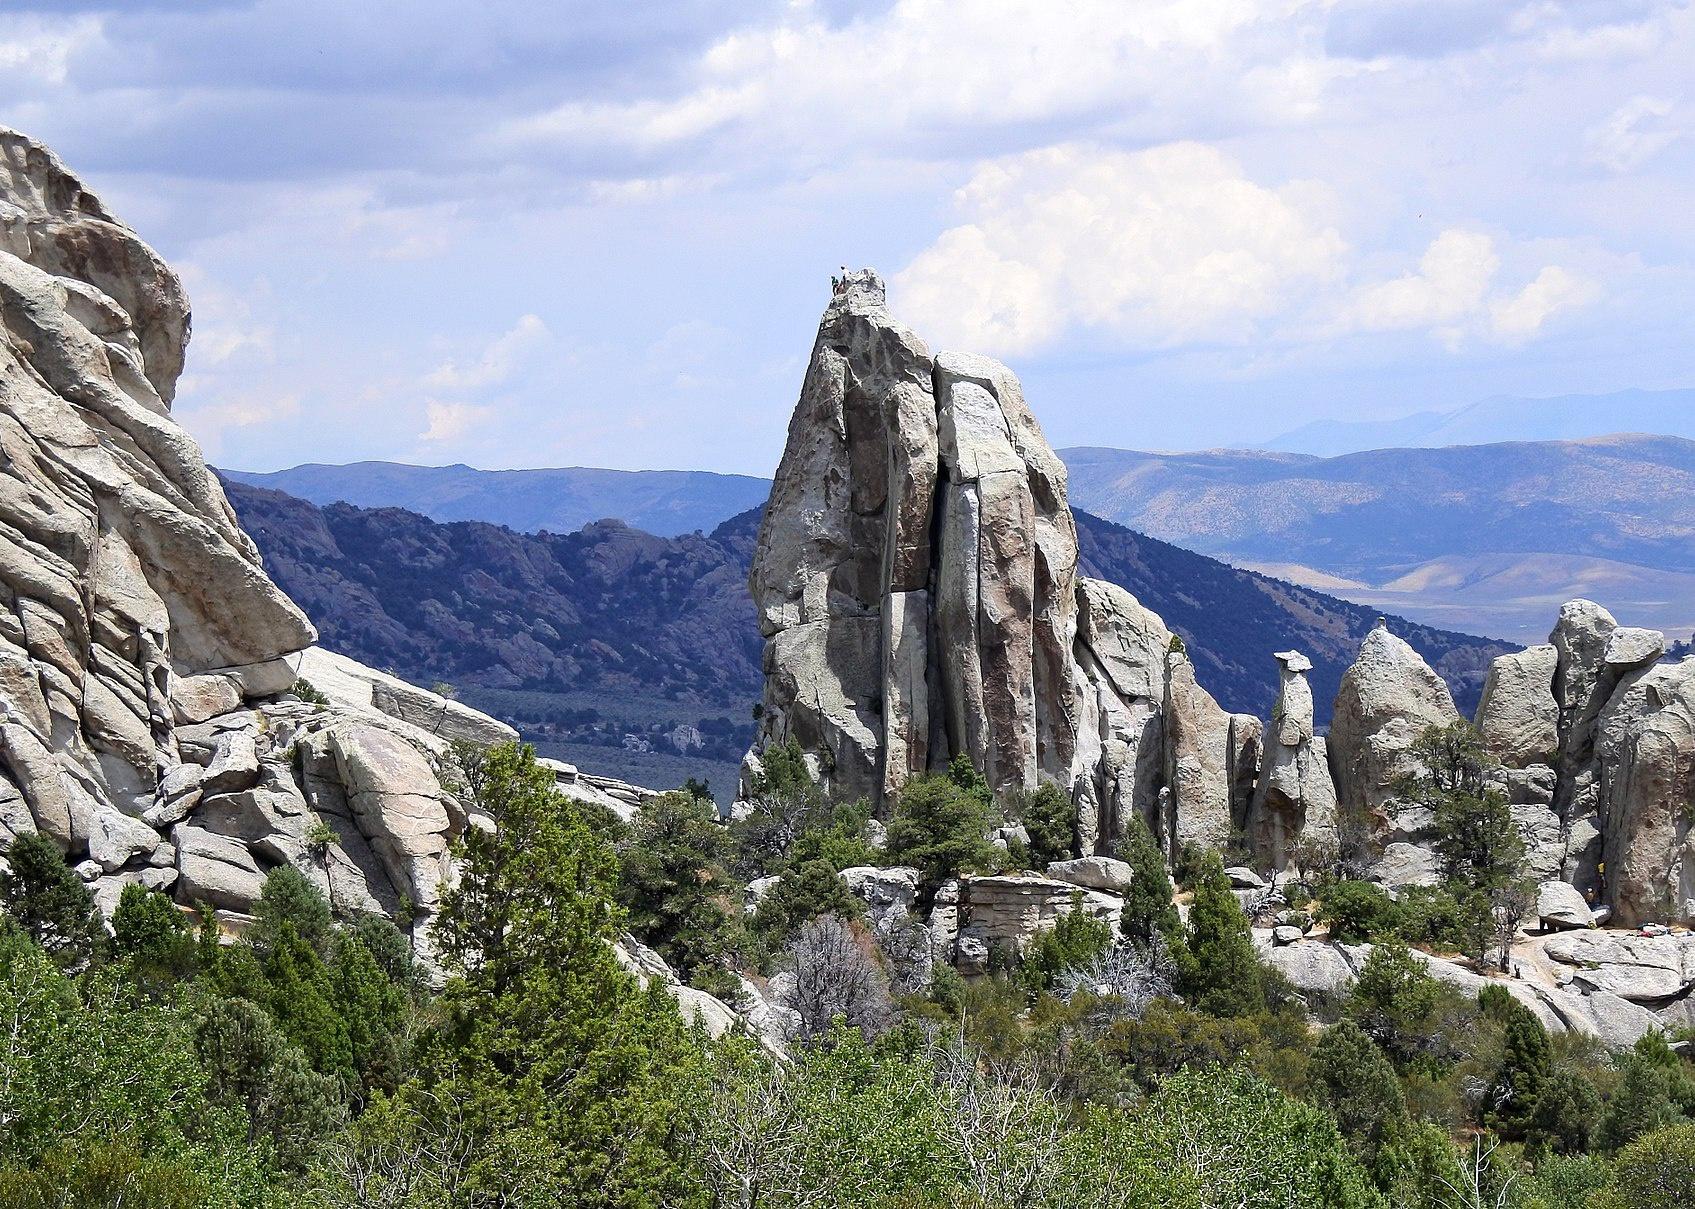
tinosa // Wikimedia Commons
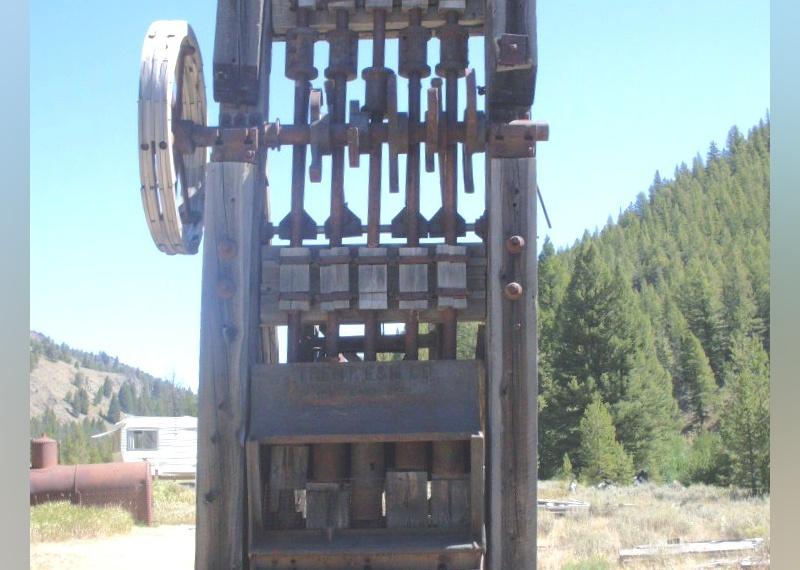
#5. Custer County
– Emergency shelters per 100K people: 93.6 (4 shelters in database)
– Emergency shelter capacity per 100K: 33,491,622 people (1,431,097 total capacity)
– Shelters with generators: 1
– Shelters in 100-year floodplain: 0
Karthikc123 // Wikimedia Commons
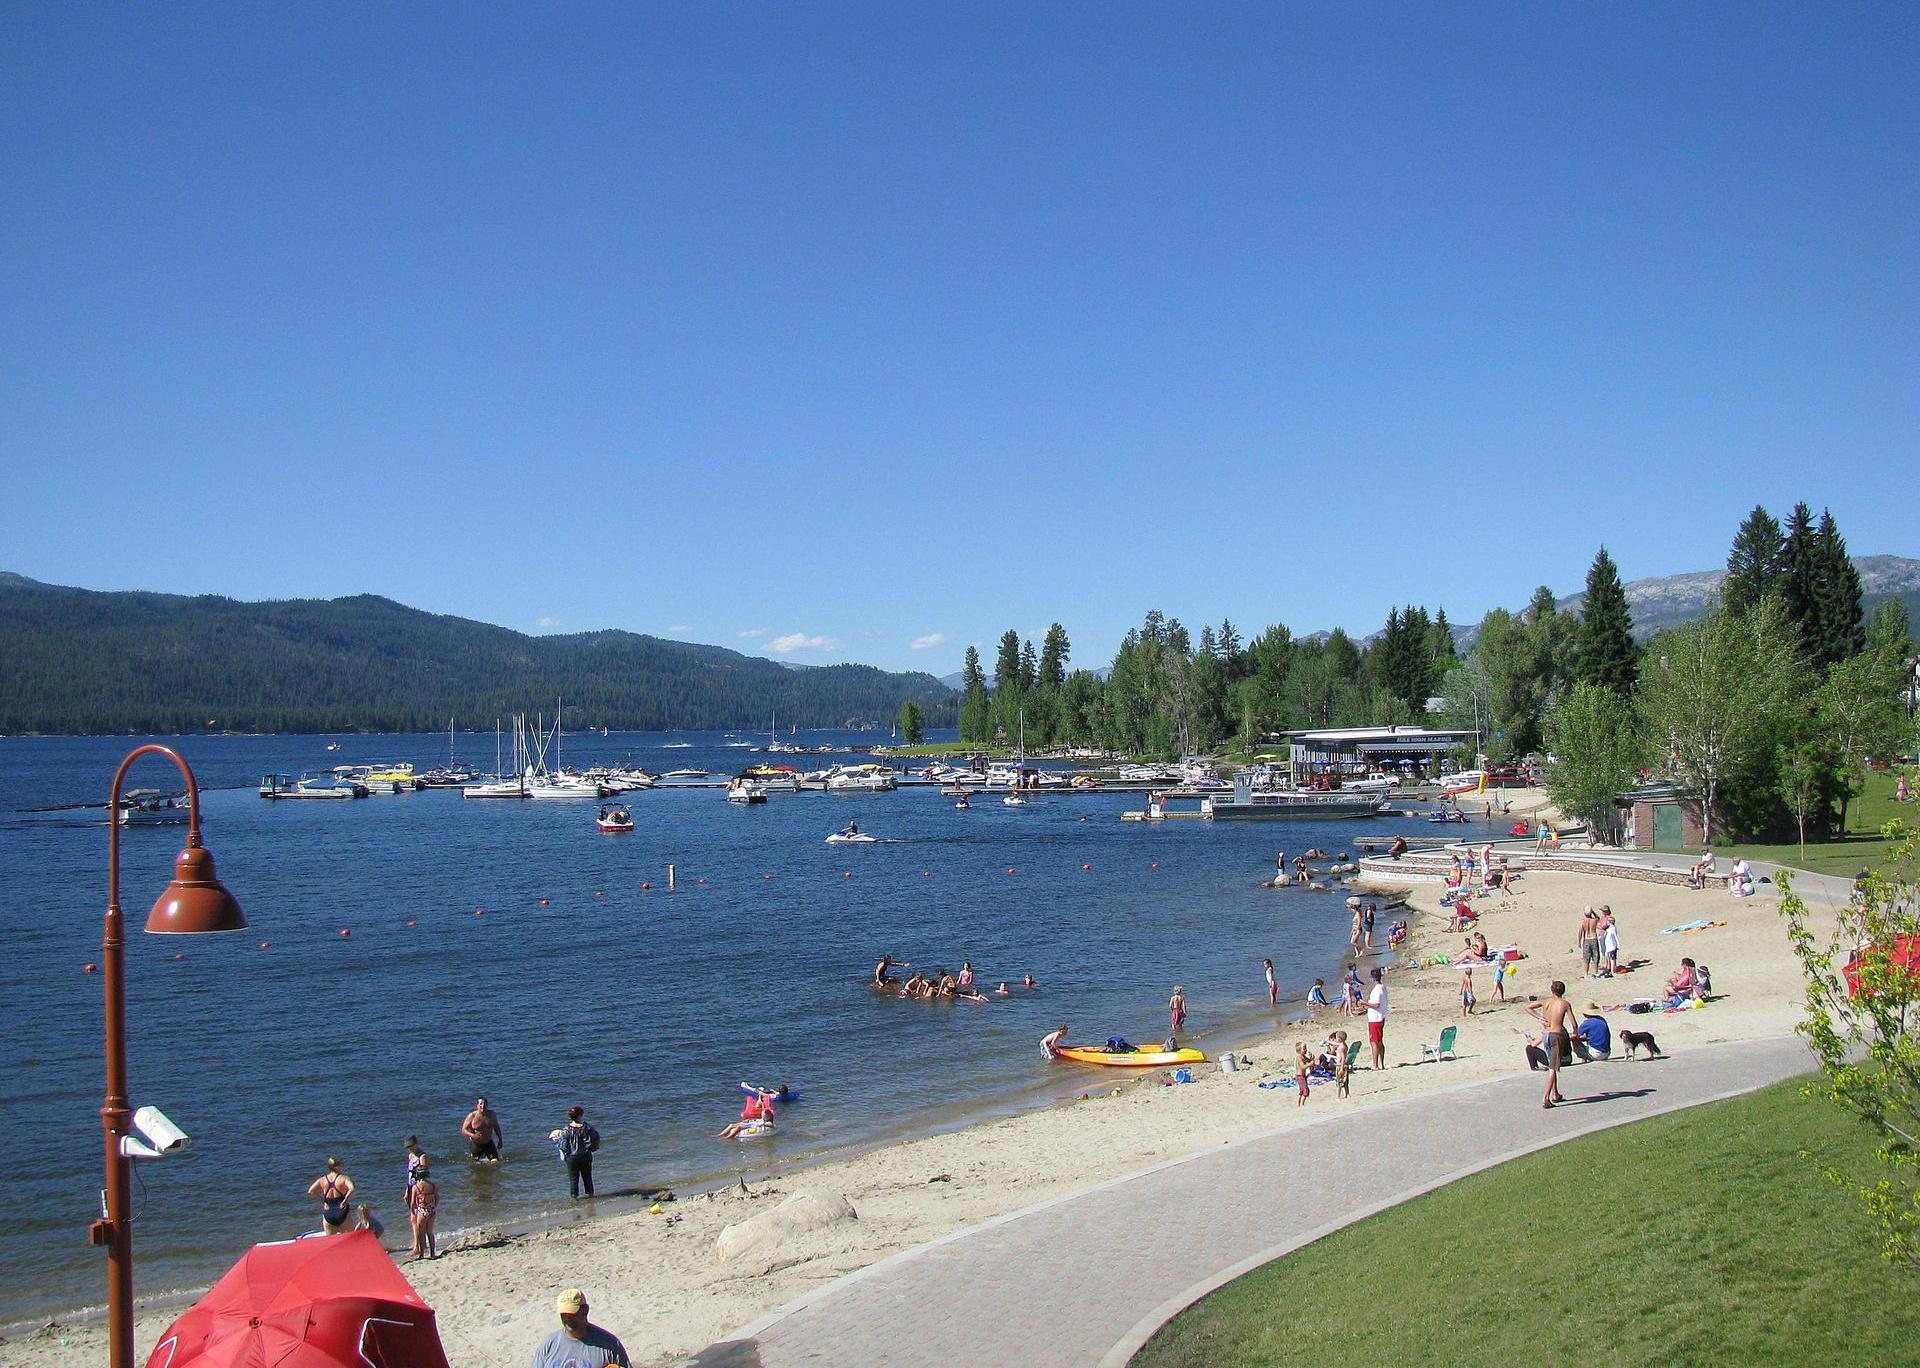
#4. Valley County
– Emergency shelters per 100K people: 95.9 (11 shelters in database)
– Emergency shelter capacity per 100K: 27,031,832 people (3,102,173 total capacity)
– Shelters with generators: 0
– Shelters in 100-year floodplain: 0
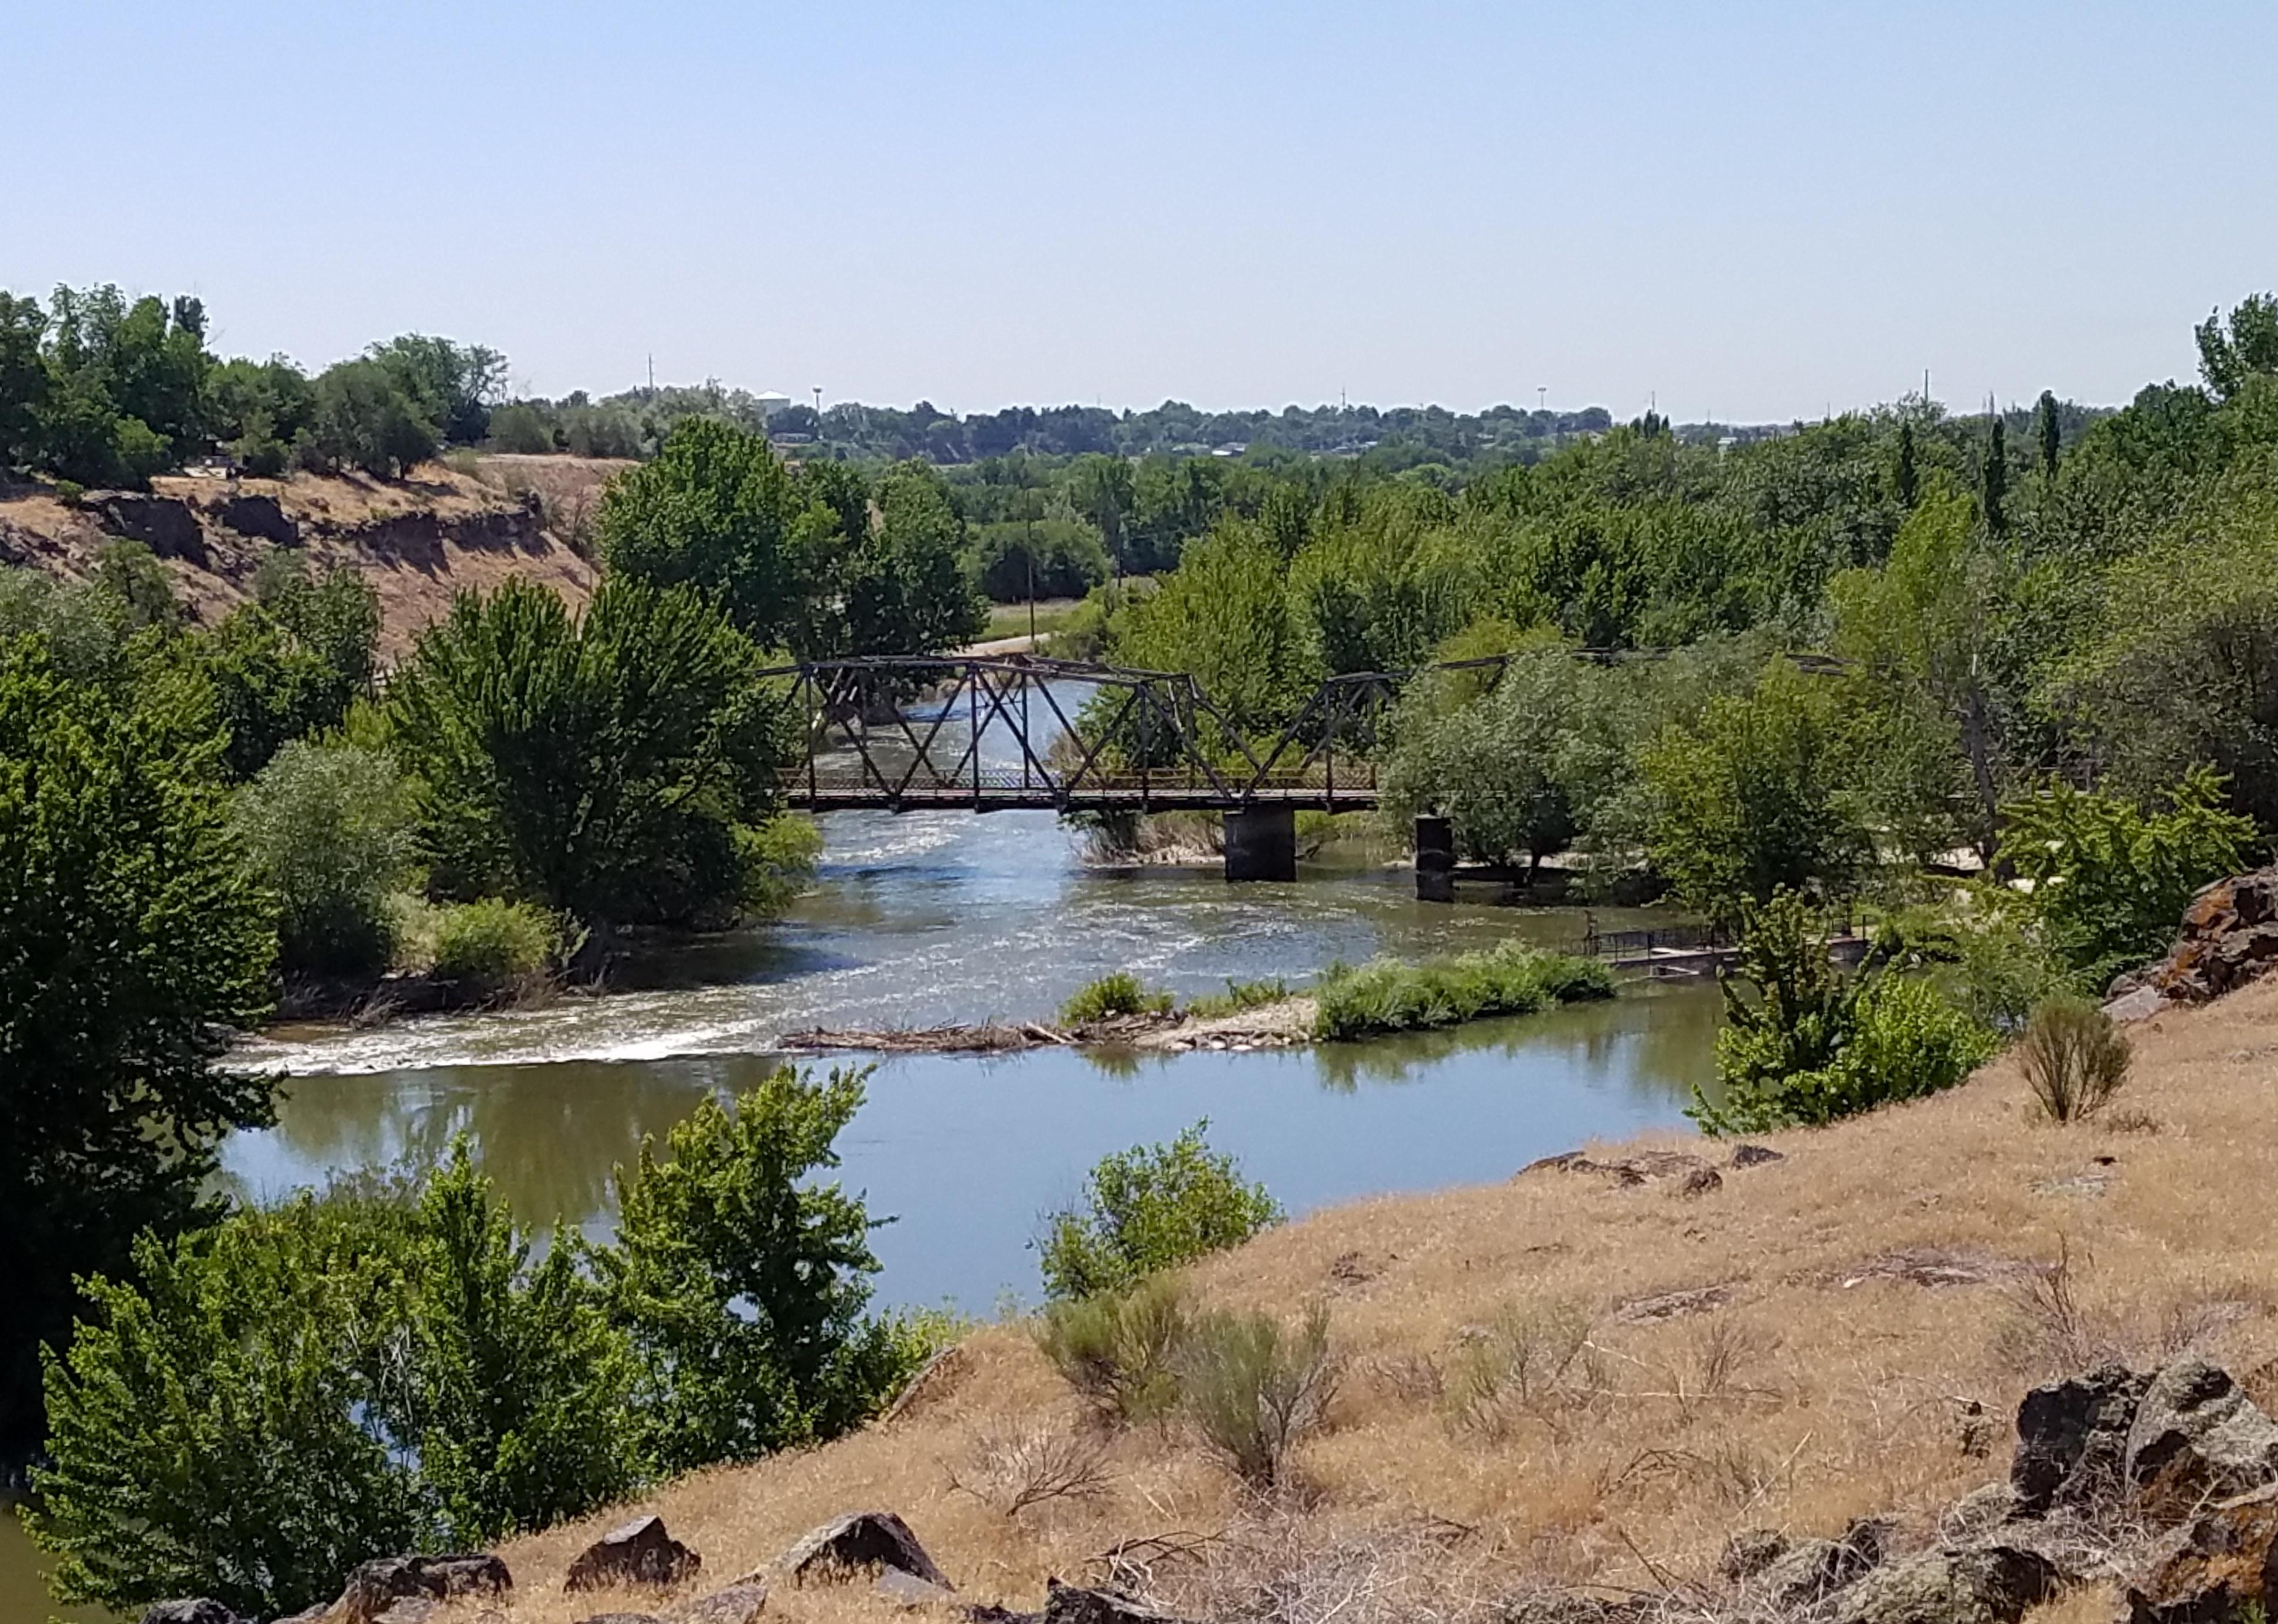
jfergusonphotos // Shutterstock
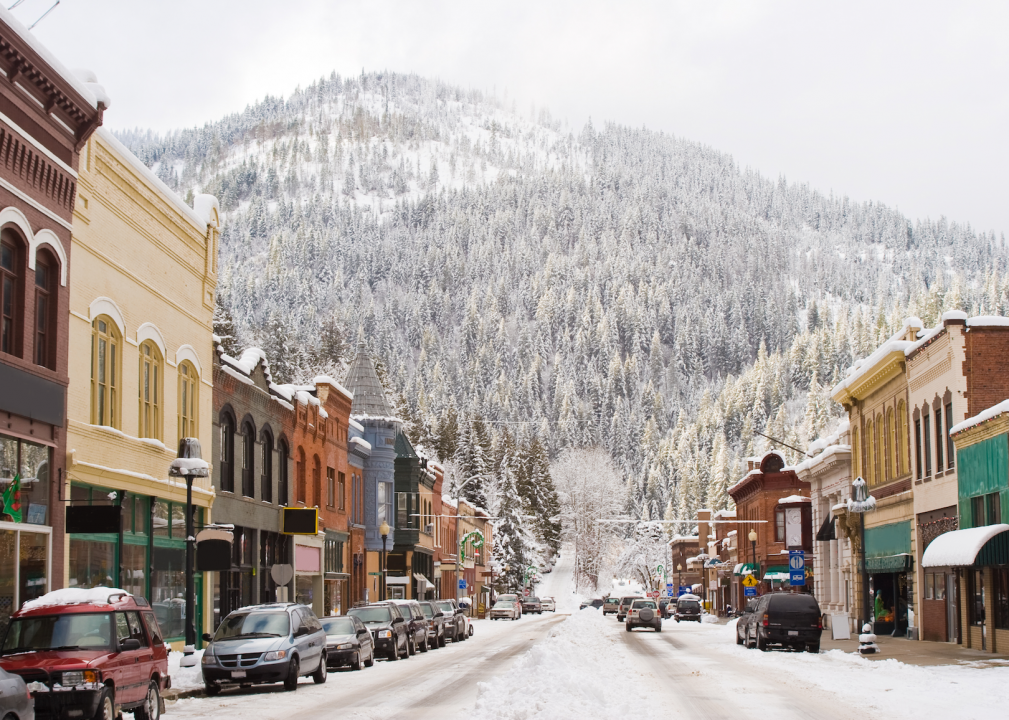
#3. Shoshone County
– Emergency shelters per 100K people: 144.8 (19 shelters in database)
– Emergency shelter capacity per 100K: 30,824,909 people (4,045,461 total capacity)
– Shelters with generators: 1
– Shelters in 100-year floodplain: 0
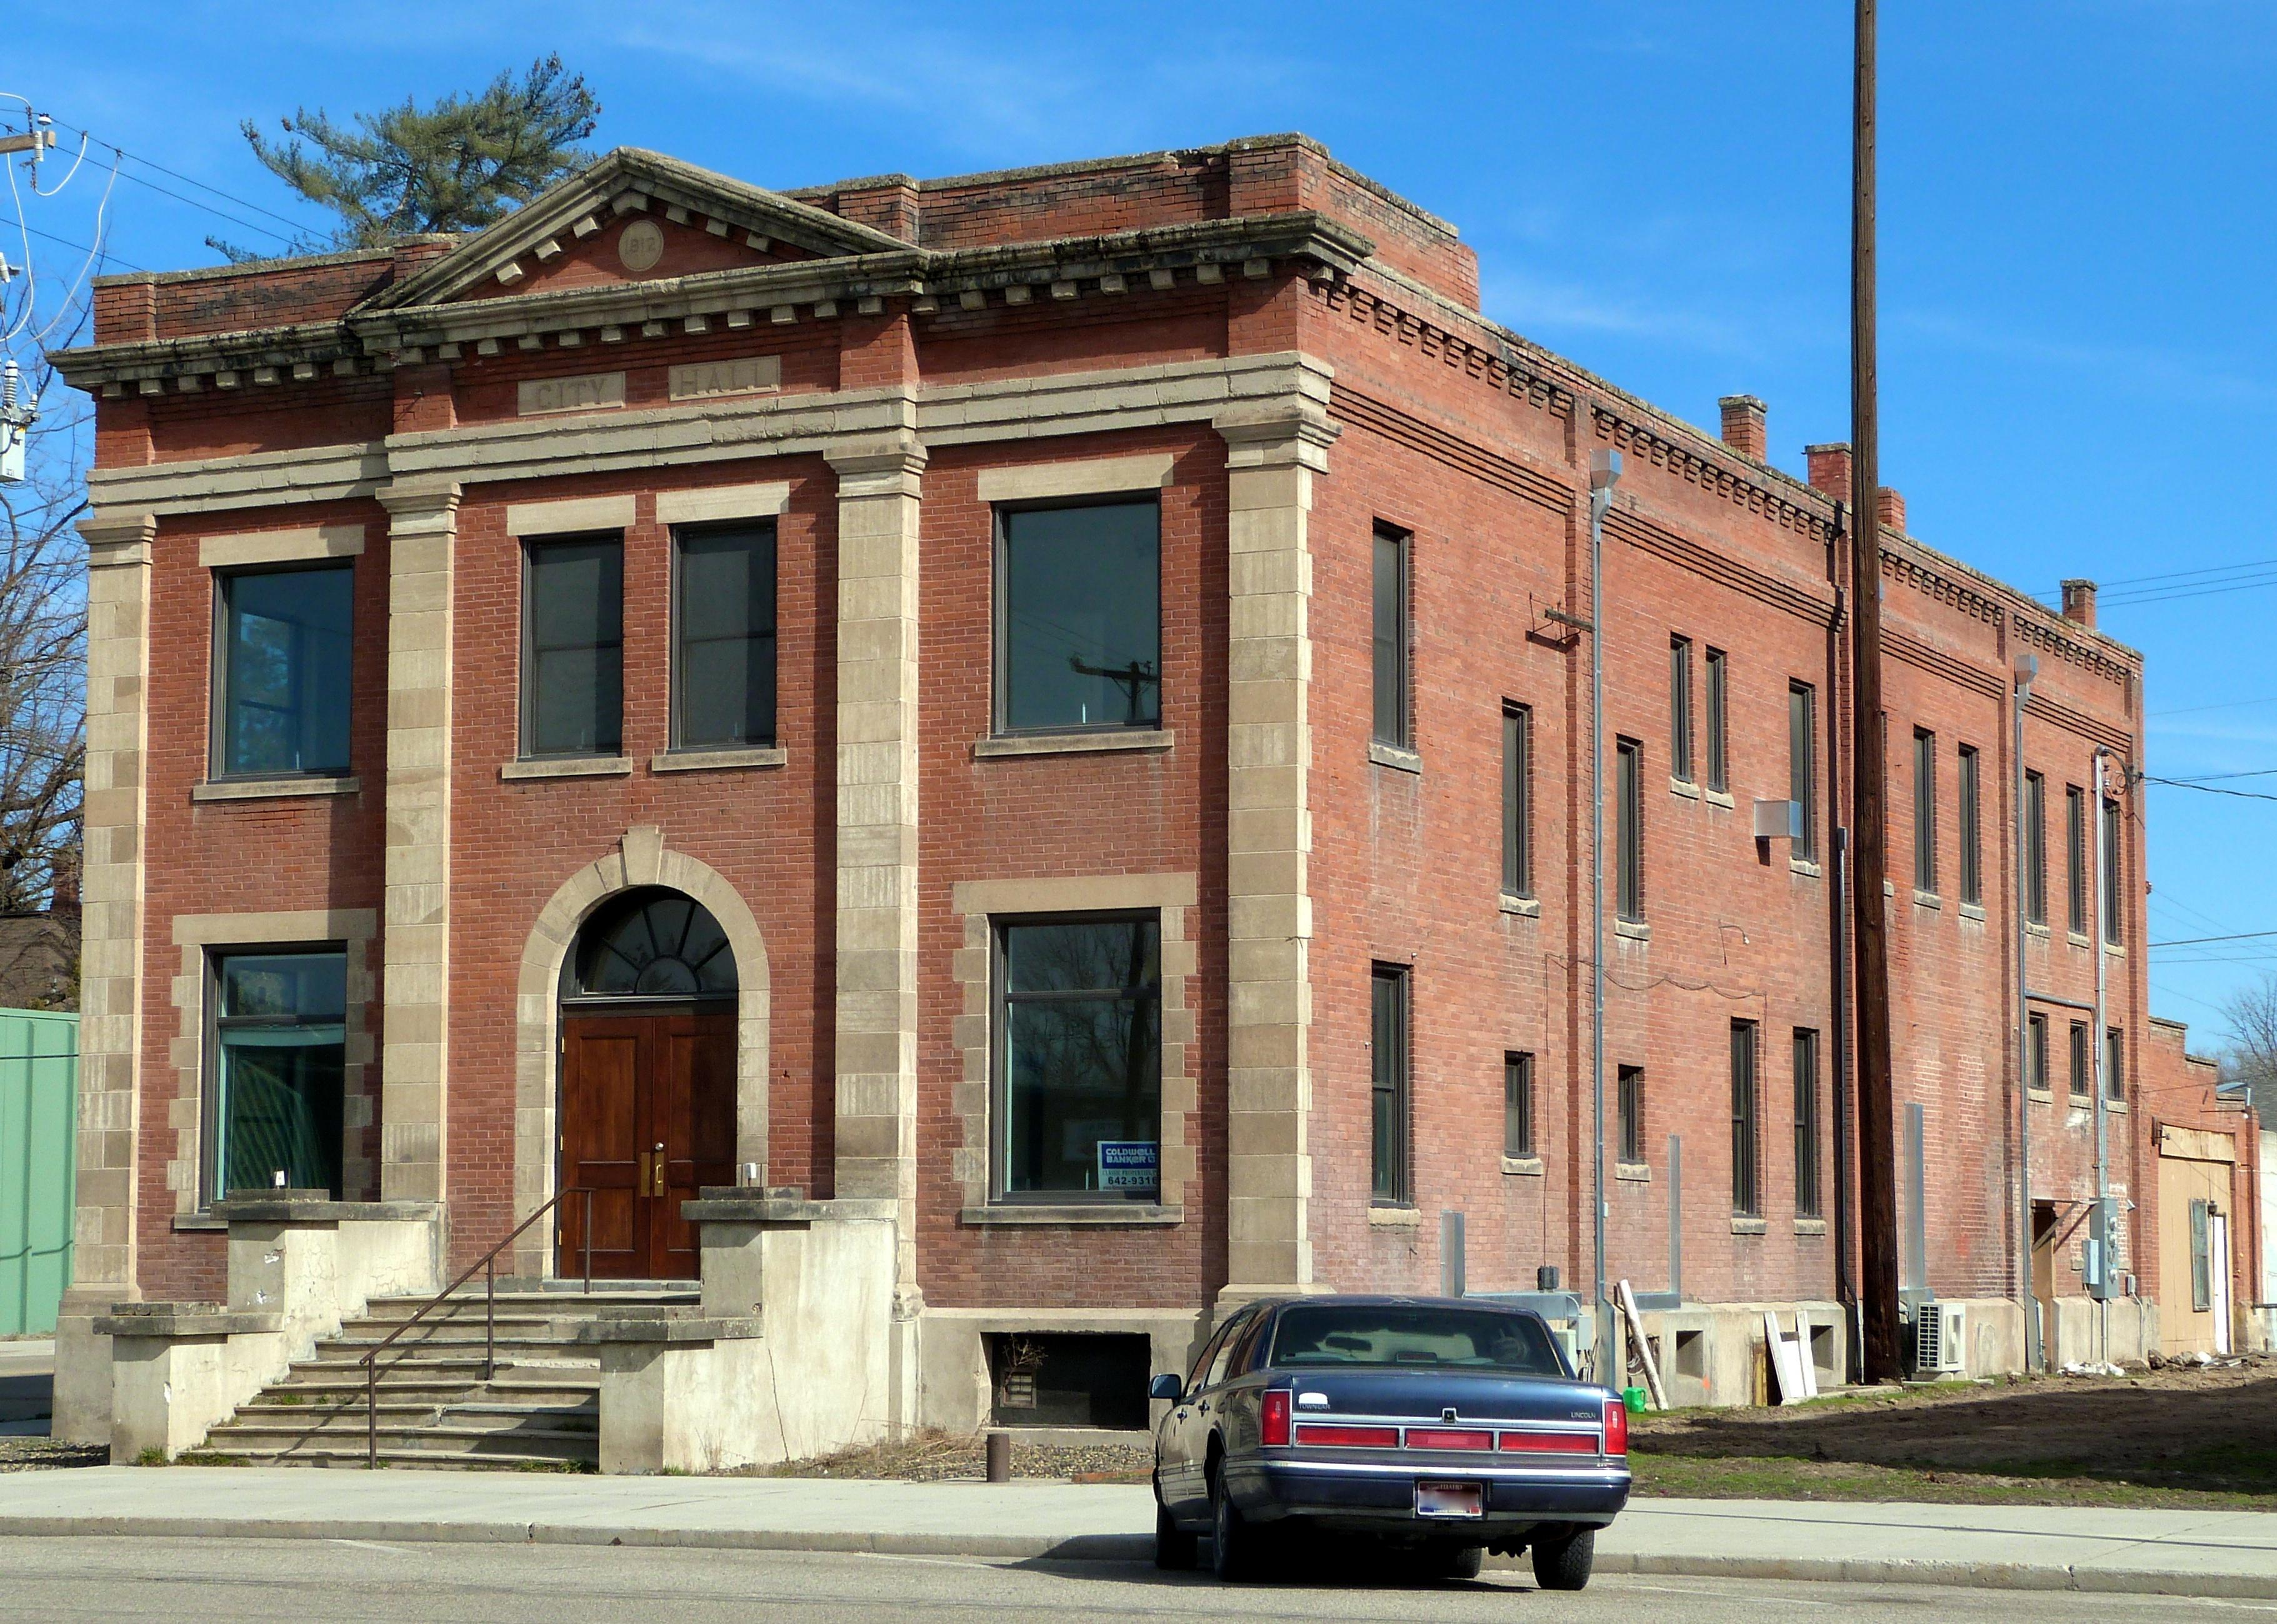
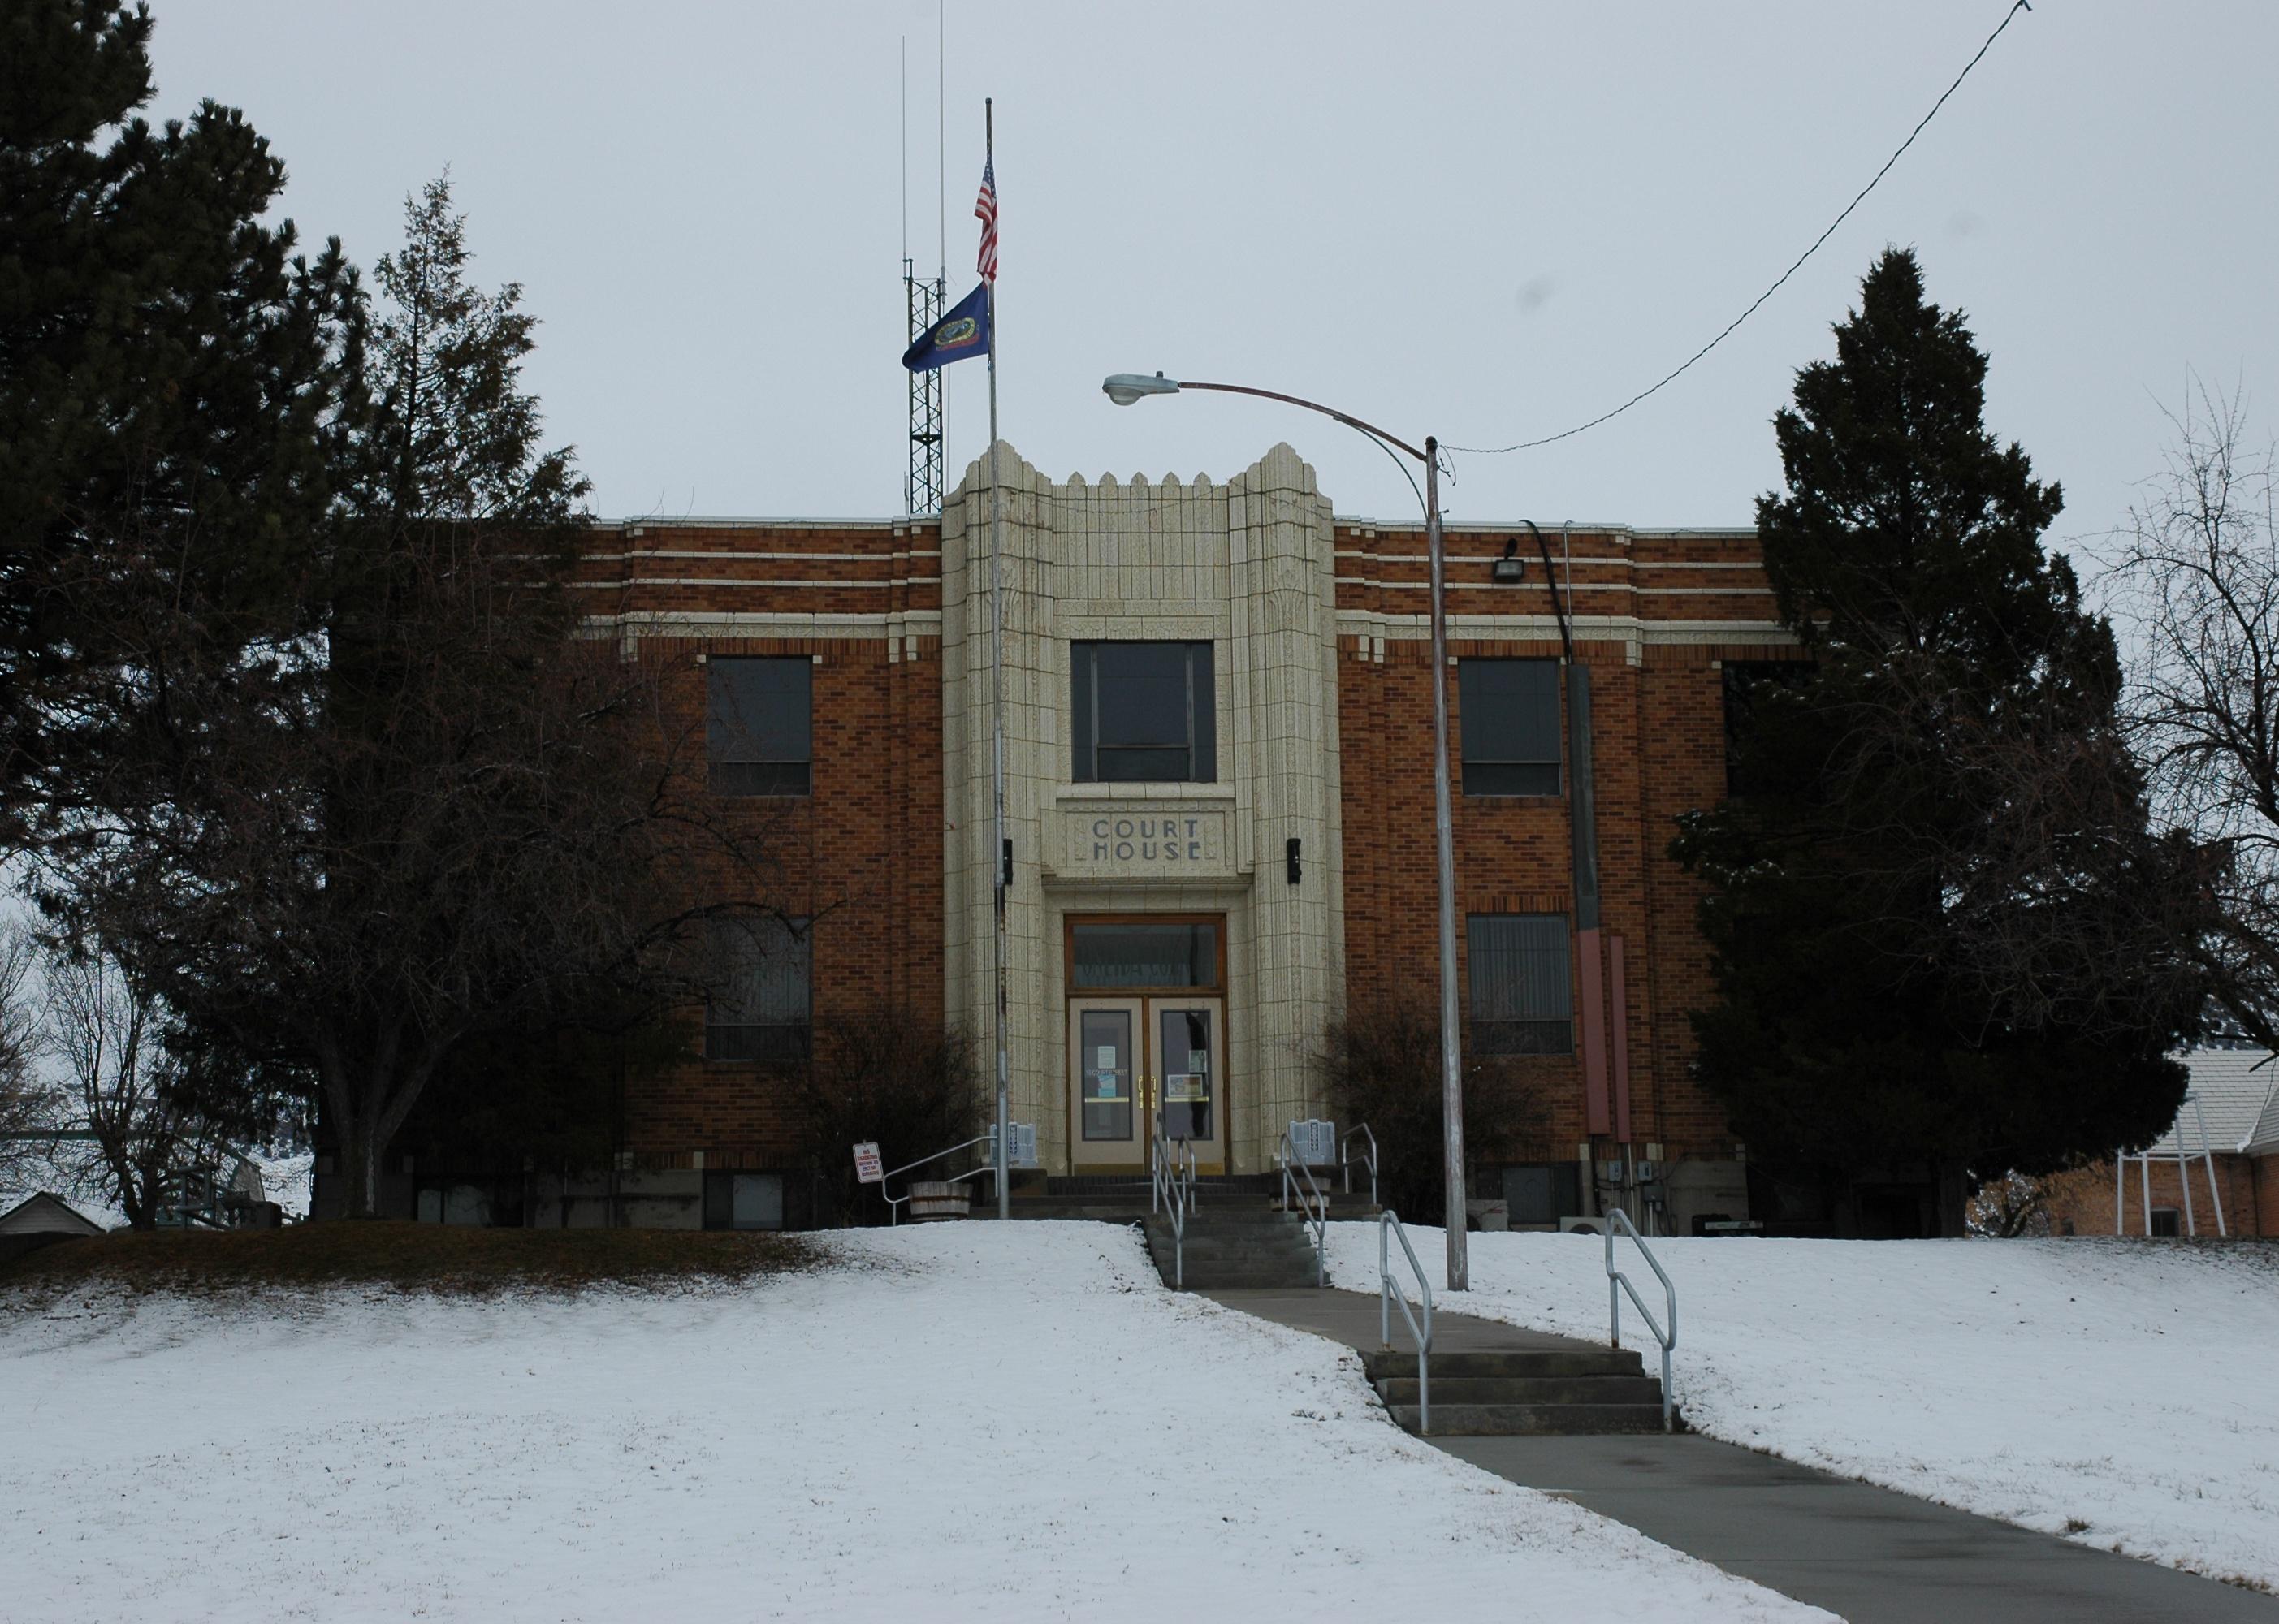
PdxCobra // Wikimedia Commons
#2. Boise County
– Emergency shelters per 100K people: 172.2 (13 shelters in database)
– Emergency shelter capacity per 100K: 29,477,520 people (2,225,258 total capacity)
– Shelters with generators: 0
– Shelters in 100-year floodplain: 0

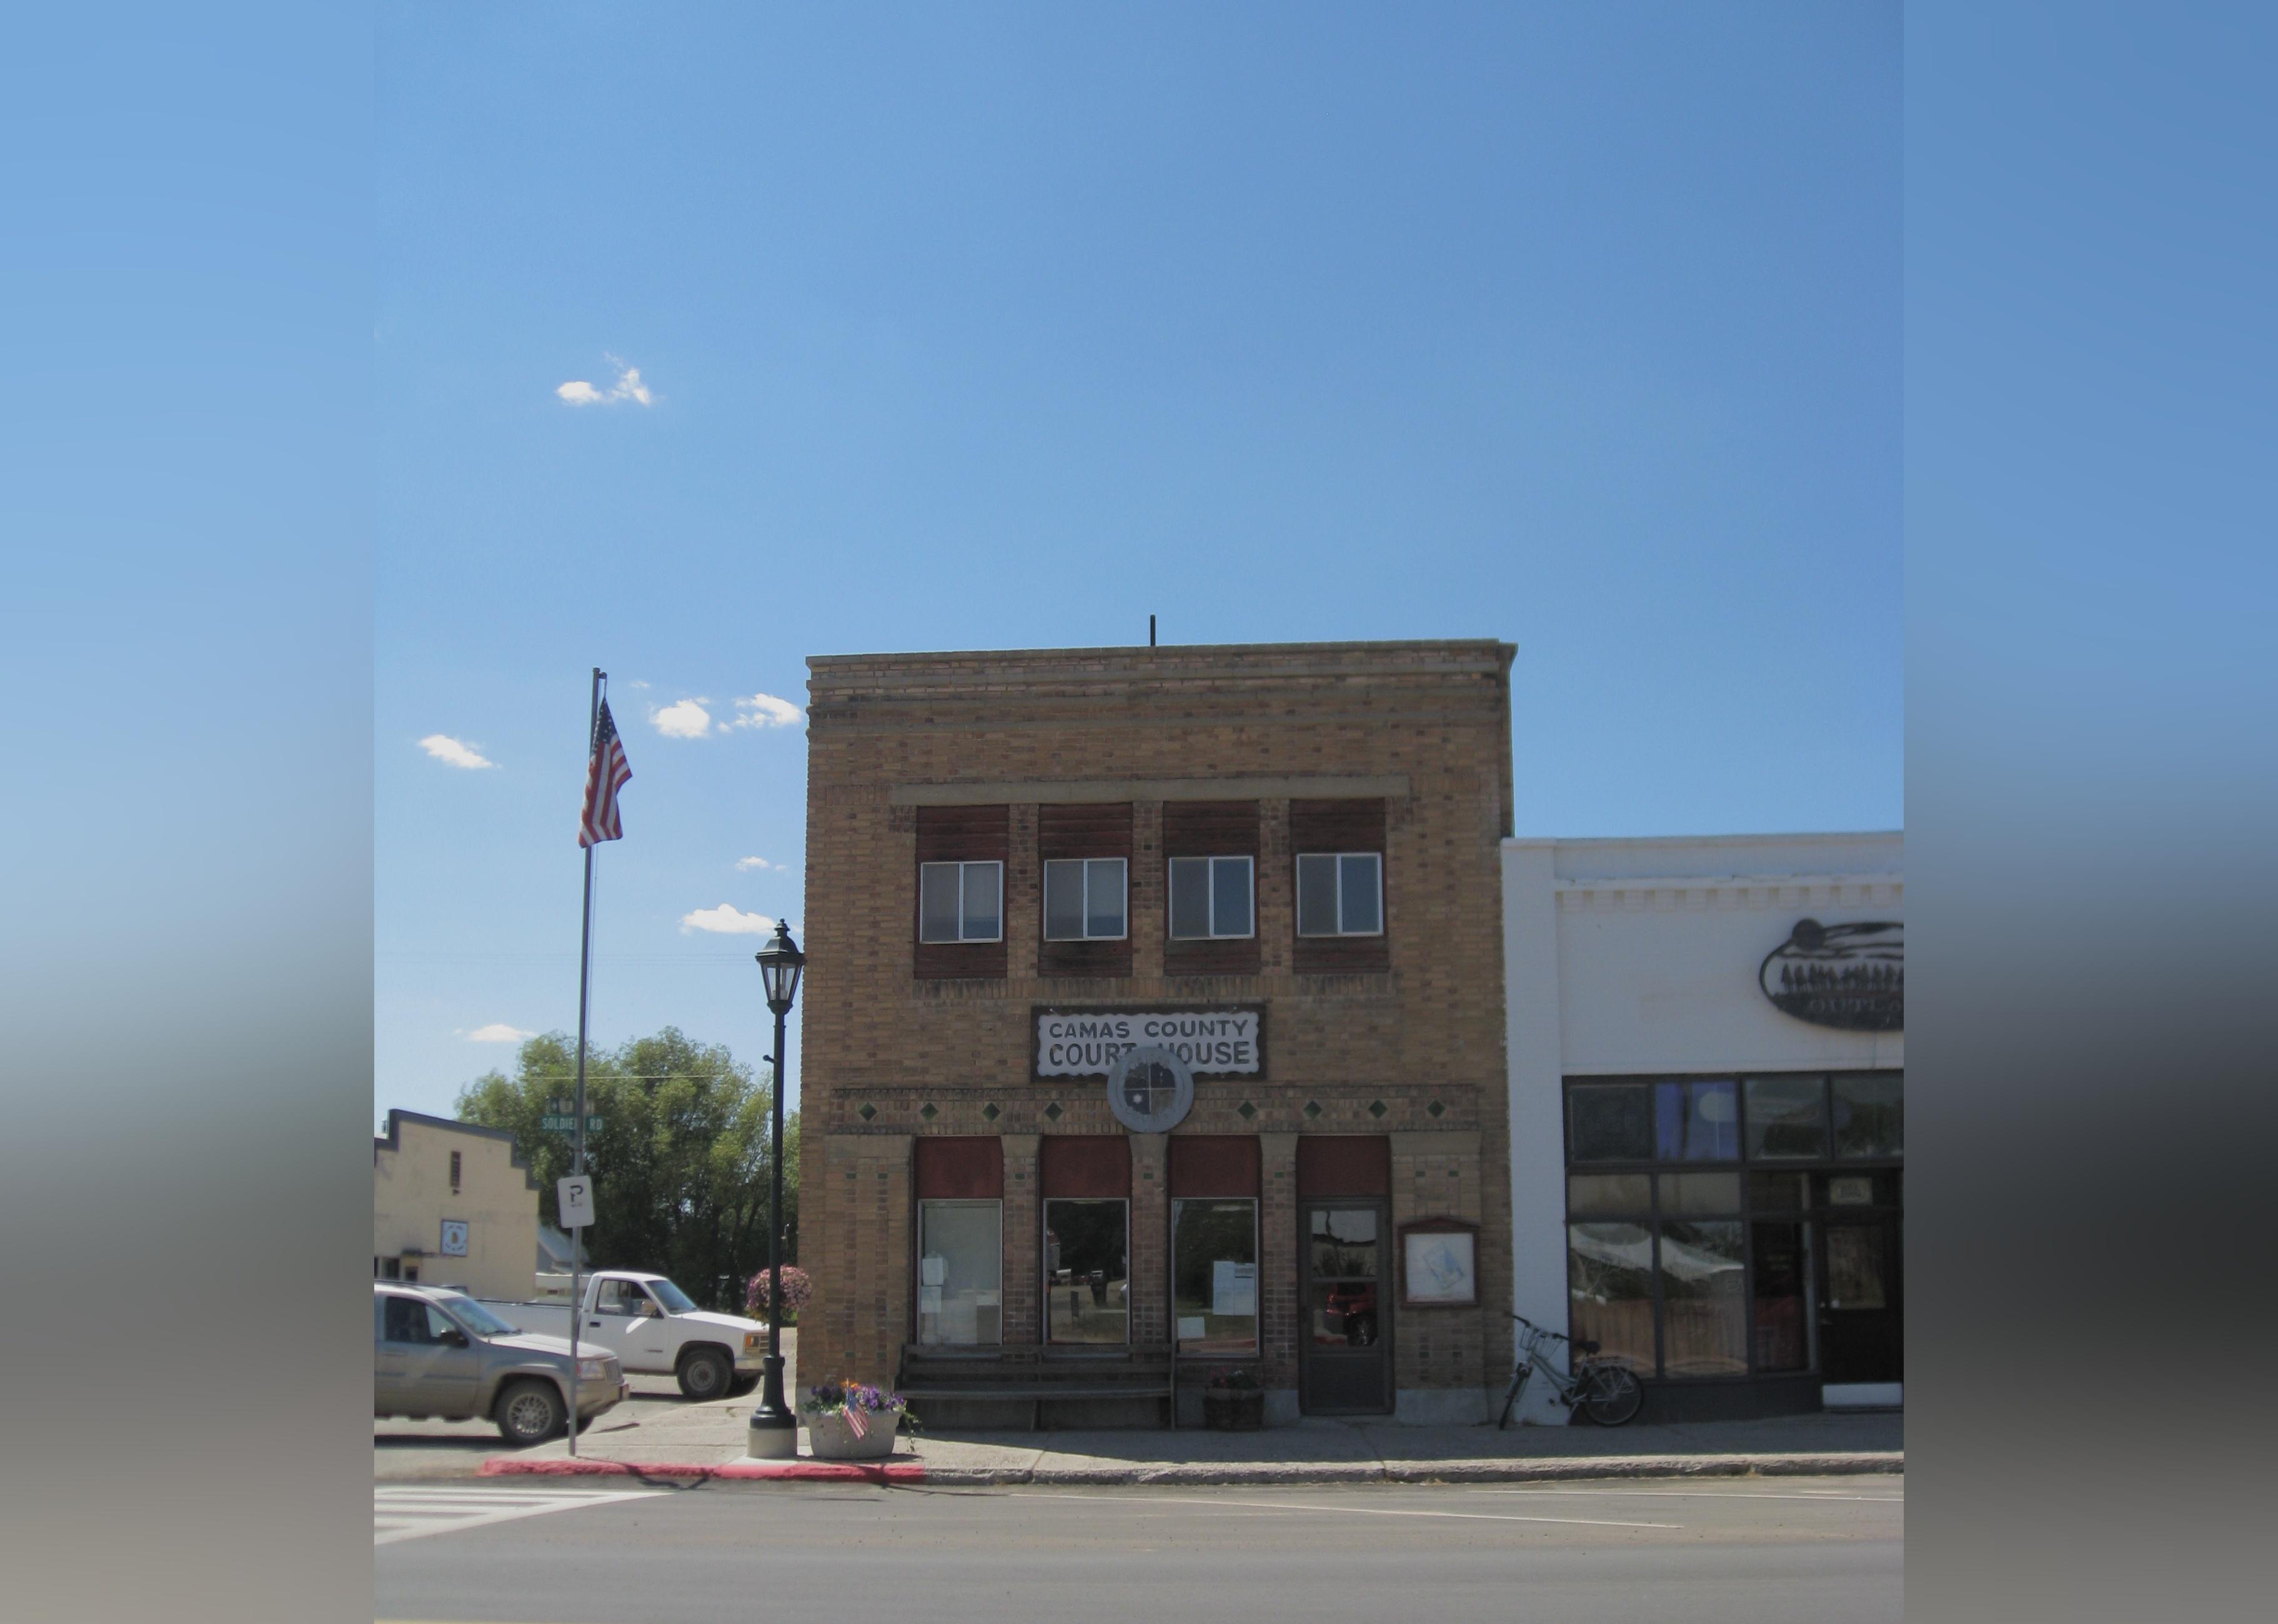
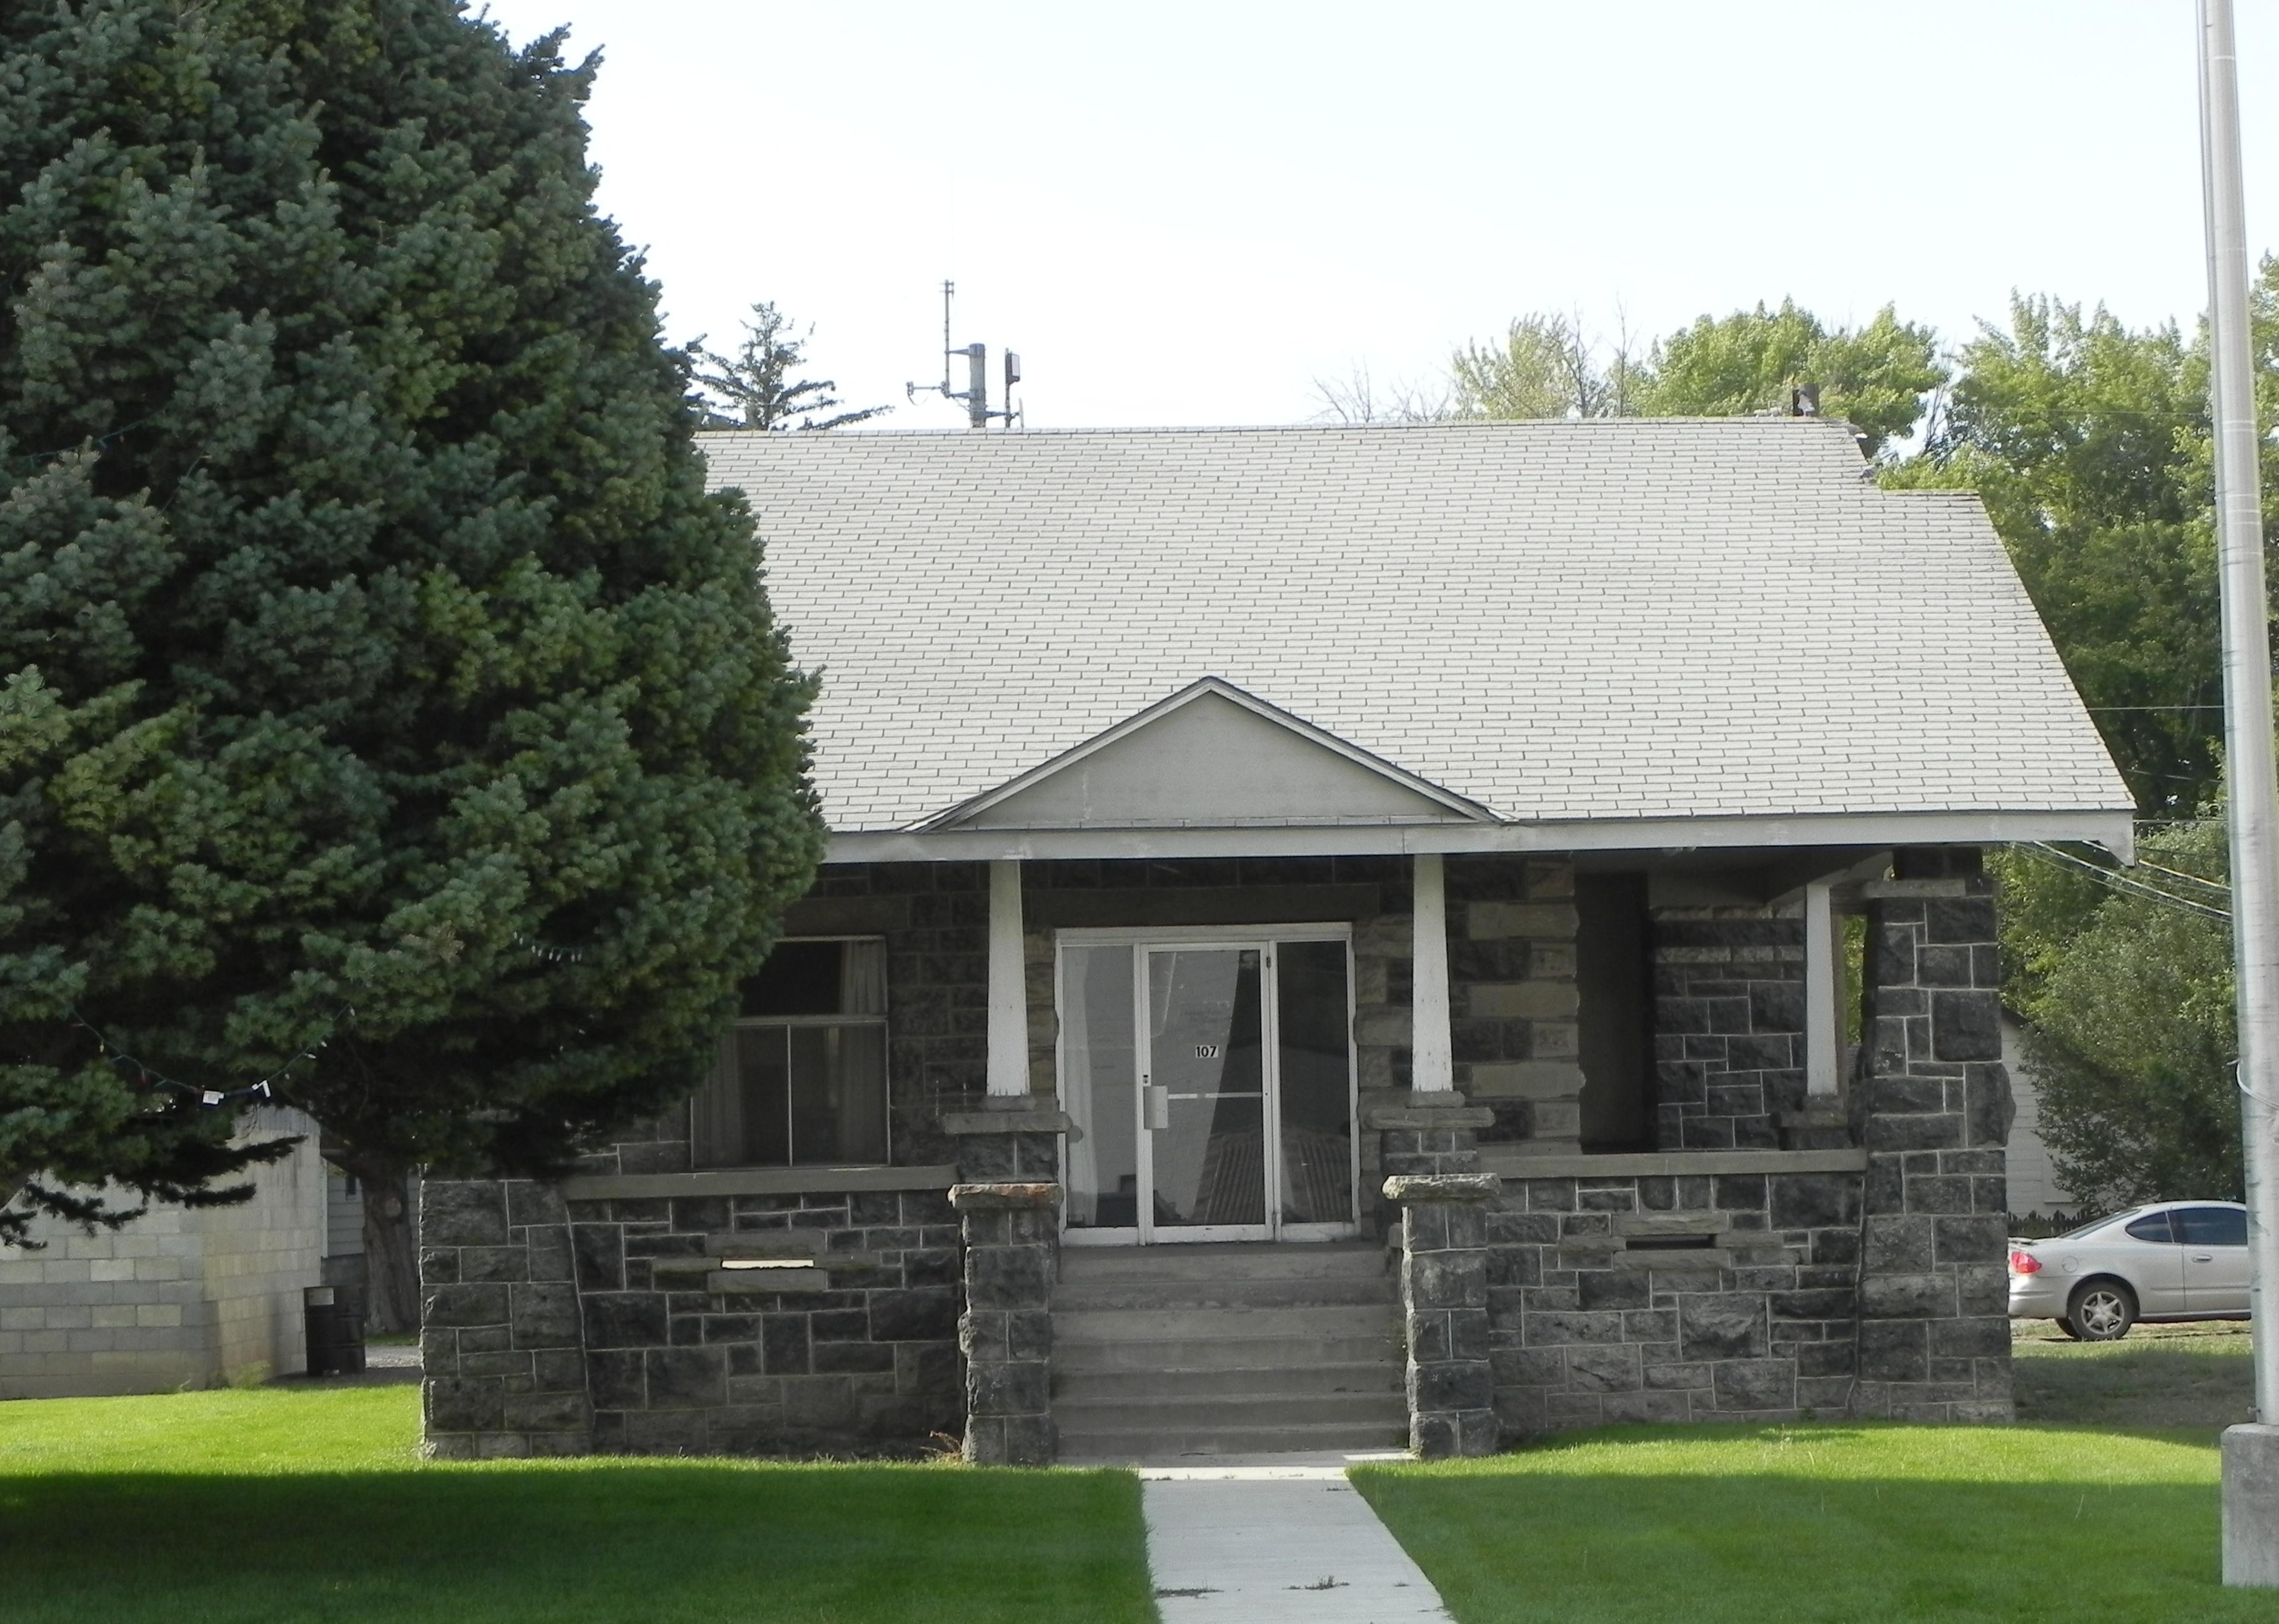
Cornellrockey04 // Wikimedia Commons
#1. Camas County
– Emergency shelters per 100K people: 191.6 (2 shelters in database)
– Emergency shelter capacity per 100K: 65,411,877 people (682,900 total capacity)
– Shelters with generators: 0
– Shelters in 100-year floodplain: 2