Idaho county population growth cools with recent US Census updates
IDAHO FALLS, Idaho (KIFI) - While Idaho's population continues to grow, its momentum has slowed in recent years based on U.S. Census updates.
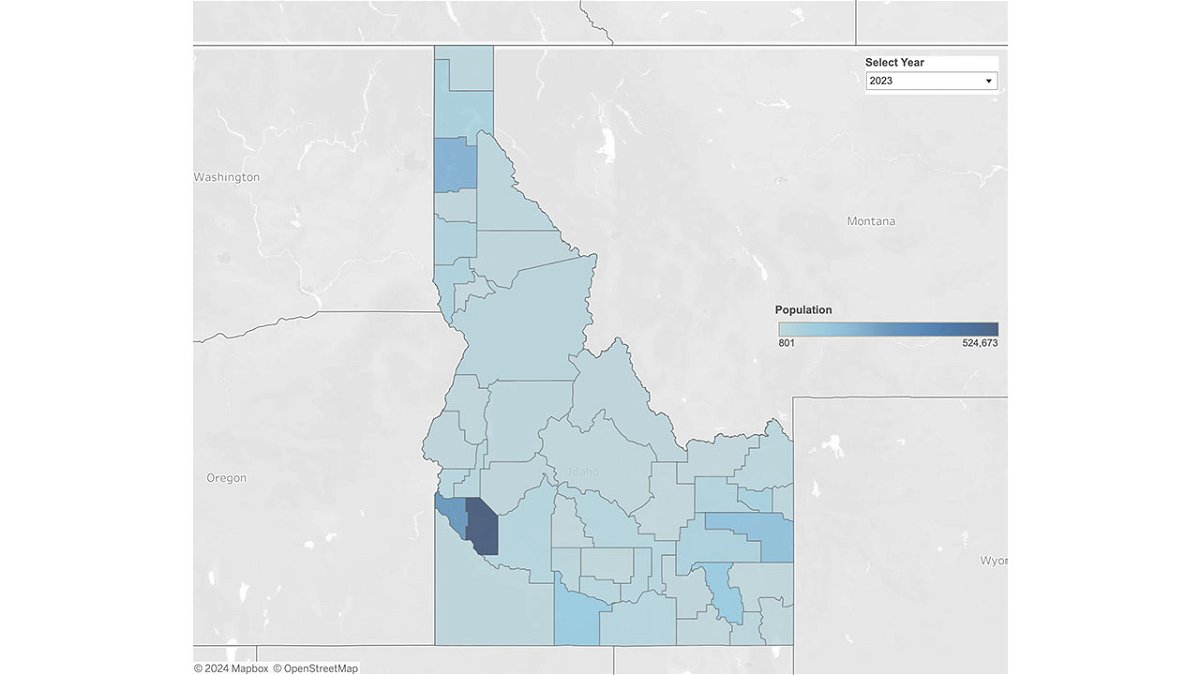
From July 2022 to July 2023, Idaho’s 44 counties saw a 1.3% population growth, a more modest growth rate compared to the 1.8% in July 2022 and 3.0% in July 2021.
Idaho added 25,730 new residents with almost half the counties growing at a faster rate than the state between July of 2022 and July of 2023. Only two counties lost population — Caribou (-9 residents) and Madison (-411 residents). Madison County is home to Brigham Young University-Idaho, where the ebb and flow of students creates volatility when estimating population.
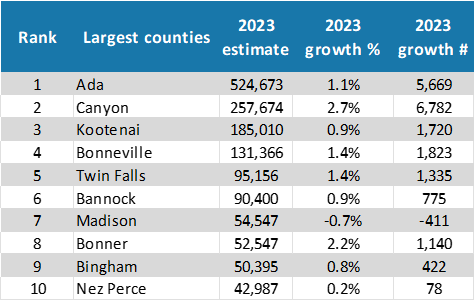
The 2023 ranking of top counties by population remained the same as estimates from recent years, shown in Table 1.
Table 1 - Top ten largest counties ranked by population, 2023
 |
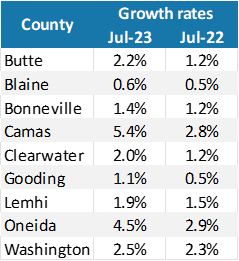
Nine counties experienced an uptick in growth rate in 2023 from the previous year, shown in Table 2.
Table 2 - Counties with higher growth rates than 2022
 |
Regional
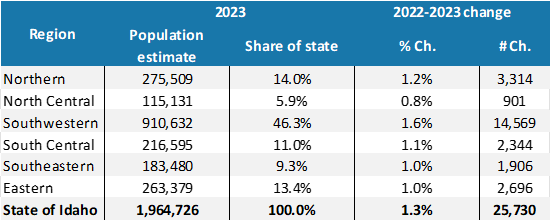
Of Idaho’s six regions, southwestern Idaho contributed the most to the state’s overall population growth. This region accounts for 46% of the state’s total population, but contributed 57% to Idaho's overall growth, shown in Chart 1. Southwestern Idaho’s growth rate was also the highest of the six regions at 1.6%, adding over 14,000 new residents to the state as shown in Table 3.
Chart 1 - 2023 share of growth by region
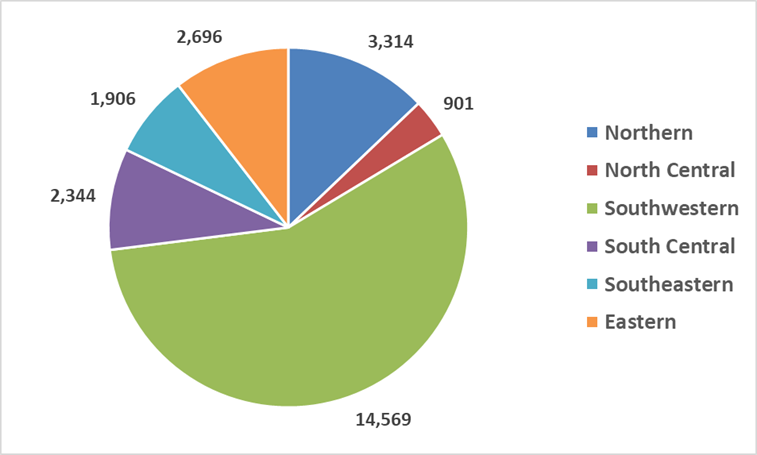 |
Table 3 - Regional population statistics
 |
Components of Population Change
Two factors affect population: natural change — the difference between deaths and births; and net migration — the difference between people who leave the state and those who move to Idaho to live.
Most Idaho counties have a net natural change that is positive, meaning there are more births than deaths over the U.S. Census data period. However, from July 2022 to July 2023, two Idaho counties experienced population declines, and 16 counties experienced more deaths than births. This is still an improvement from the height of the pandemic, when 24 counties experienced negative natural change.
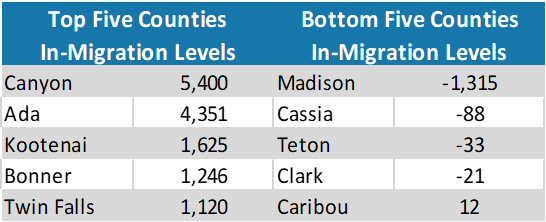
Idaho’s current net in-migration of 20,053 is less than the pre-pandemic number of 25,776 in 2018. During the Great Recession, in-migration plummeted into the negative, indicating more residents leaving than moving into the state. Clark and Madison counties are currently in the same situation, losing total population due to negative in-migration, despite experiencing positive natural change. Idaho counties with the highest levels of in-migration are among the state’s top ten largest counties, shown in Tables 1 and 4. The bottom five counties are almost exclusively smaller, rural counties, except for Madison, shown in Table 4.
Table 4 - Top and bottom net in-migration counties
 |
Various factors impact Idaho’s current population. Reduced fertility rates have negatively affected natural change, and analysts point to generational challenges like the high cost of housing, medical care, childcare and post-secondary education as reasons younger people are delaying household formation. This same phenomenon is seen across the state and the country, and in most industrialized nations.
However, in-migration from another state or U.S. territory, or another country (including American citizens returning from the military or an international work assignment) has mitigated the decline in natural change. The past eight years have shown in-migration to be the main driver of Idaho’s population growth, and in 2023, in-migration accounted for 78% of the increase while natural change contributed 22%.
Urban and Rural
Idaho’s urban areas represent the larger share of the state’s population. In the July 2023 release, the urban area share of Idaho's total population was 72% or 1.4 million, while the rural population accounted for 28% or 542,000.
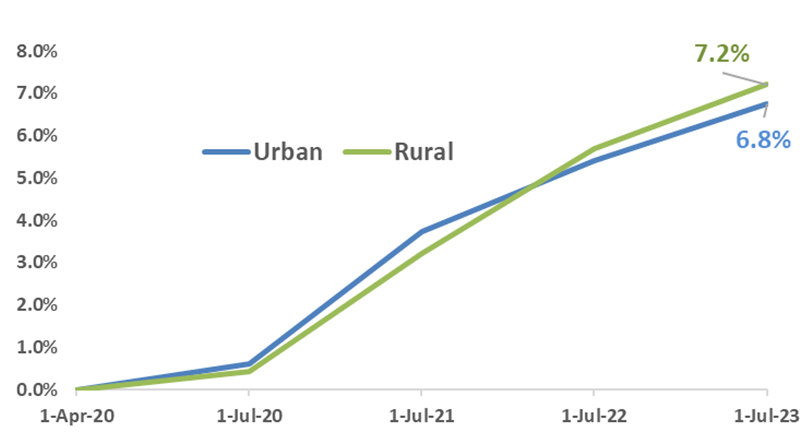
The population growth rate has also been higher among the aggregate rural counties since the 2020 Census. This is counter cyclical to the previous decade, where the growth between the 2010 Census and the 2019 Intercensal Estimates showed Idaho’s urban cohort grew three times faster than the rural population, shown in Charts 2 and 3.
Chart 2 - Urban and rural growth 2010 to 2019, indexed to April 2020
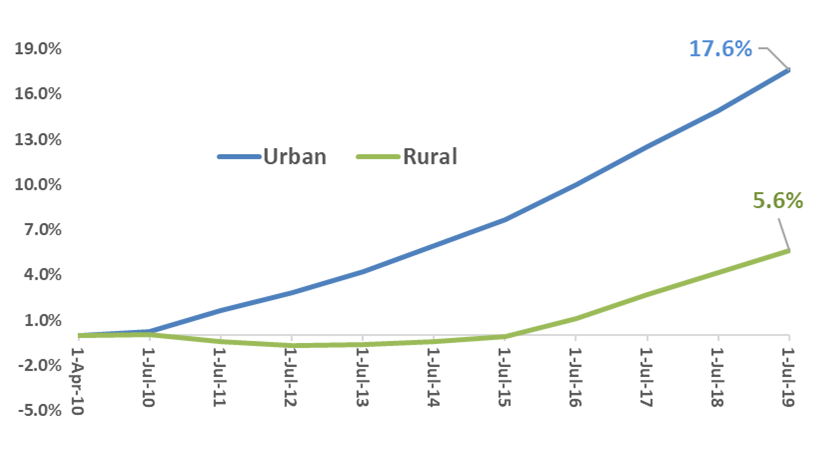 |
Chart 3 - Urban and rural growth 2020-2023, indexed to April 2020
 |
Population Estimate Revisions
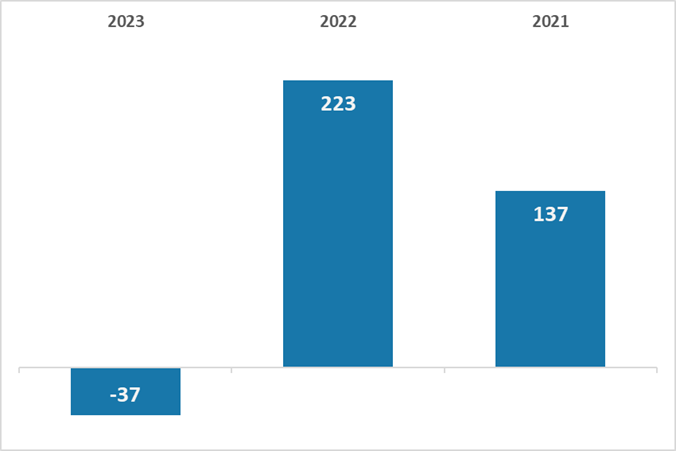
The U.S. Census revises previous estimates back to the most recent decennial census year — 2020. For 2023, previous year adjustments are shown in Chart 4, indicating only slight changes.
Chart 4 - Idaho cumulative population estimate revisions
 |
County and state data can be found on the Idaho Department of Labor’s Labor Market Information website.