Cities with the fastest ‘time-to-crime’ rates for firearms
Nomad_Soul // Shutterstock
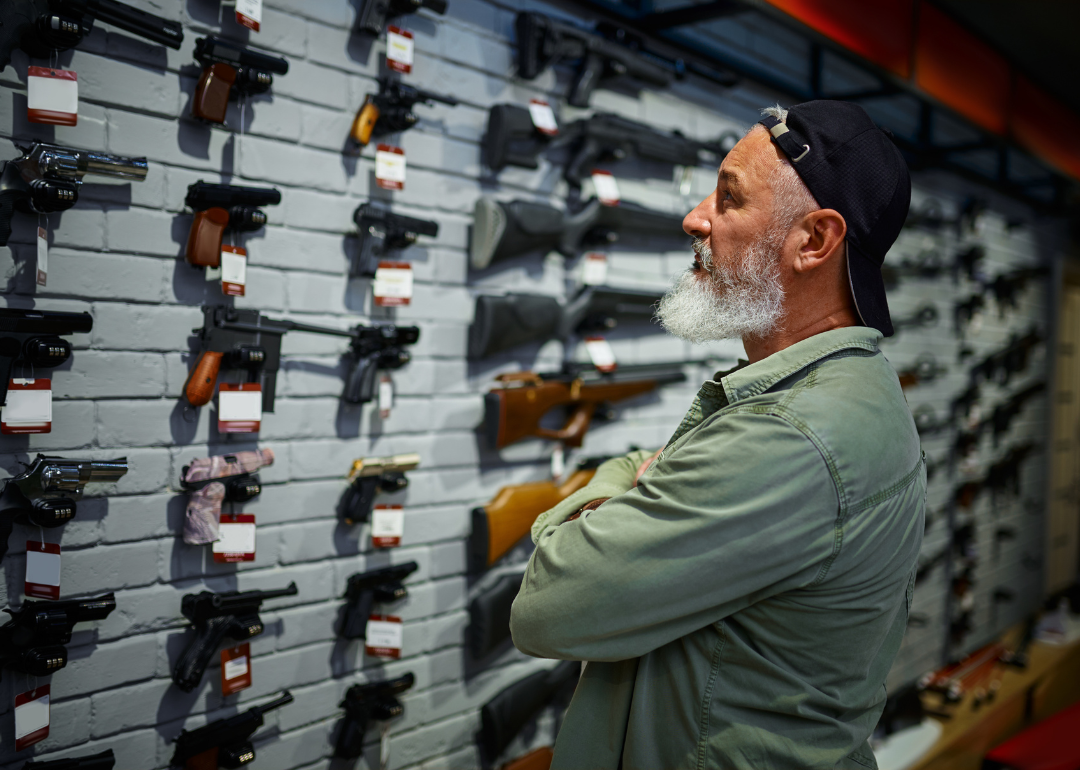
Cities with the fastest ‘time-to-crime’ rates for firearms
A customer choosing a pistol from the showcase in a gun store.
The average time between the purchase of a gun and its recovery from a crime scene has gotten shorter in recent years, 2023 data from the Bureau of Alcohol, Tobacco, Firearms and Explosives shows.
This span of time, known as “time-to-crime,” is used to gauge levels of criminal intent in the purchase of firearms, as well as to deduce where hubs of gun trafficking are. A shorter time-to-crime indicates that weapons were likely purchased with criminal intent and might be objects of firearms trafficking.
The ATF traces firearms in order to aid law enforcement in generating suspect leads when guns are used in crimes, as well as to ascertain how and where guns are moved. To do this, members of law enforcement must voluntarily submit trace requests to the ATF, which can evaluate a gun’s place of manufacture and where it was first purchased.
Because not all recovered crime guns are reported to the ATF, with some police departments reporting more consistently than others, the accuracy of time-to-crime rates by city or region can be questionable. In Chicago, for instance, the number of gun traces leads other major cities by a significant amount.
Even with inconsistencies in reporting, gun tracing has revealed that some parts of the U.S. serve as hubs for firearms trafficking. Known as the “iron pipeline,” gun traffickers notoriously take advantage of lax gun laws in some states in the Southern and Midwestern U.S., bringing them to states with stricter gun laws, particularly in the Northeast and on the West Coast. As a result, just 10 states—including Indiana, Georgia, Texas, and Virginia—are the source of large quantities of guns recovered at crime scenes in New York and California.
In 2020, there was a significant increase in recovered guns with short time-to-crime rates, with numbers nearly doubling from the previous year. This spike came as homicide rates and gun sales in the U.S. also saw dramatic increases. The full impact of the role of soaring gun sales and shorter time-to-crime rates on higher murder rates in 2020 is not yet known. Due to inconsistent gun tracing practices from police departments across the country, an incomplete picture of the true scope of short time-to-crime rates remains.
Stacker compiled gun crime data from the Bureau of Alcohol, Tobacco, Firearms and Explosives on 40 cities across the U.S. and ranked them by five-year median time-to-crime rates. Ties were broken by the percentage of guns used in crimes successfully linked to the known purchaser. Analyzed crime guns were recovered and traced between 2017 and 2021 for 40 cities in the U.S. ranging in size—mega, large, medium, and small.
You may also like: States with the highest marriage rates—and how they’ve changed
![]()
Canva
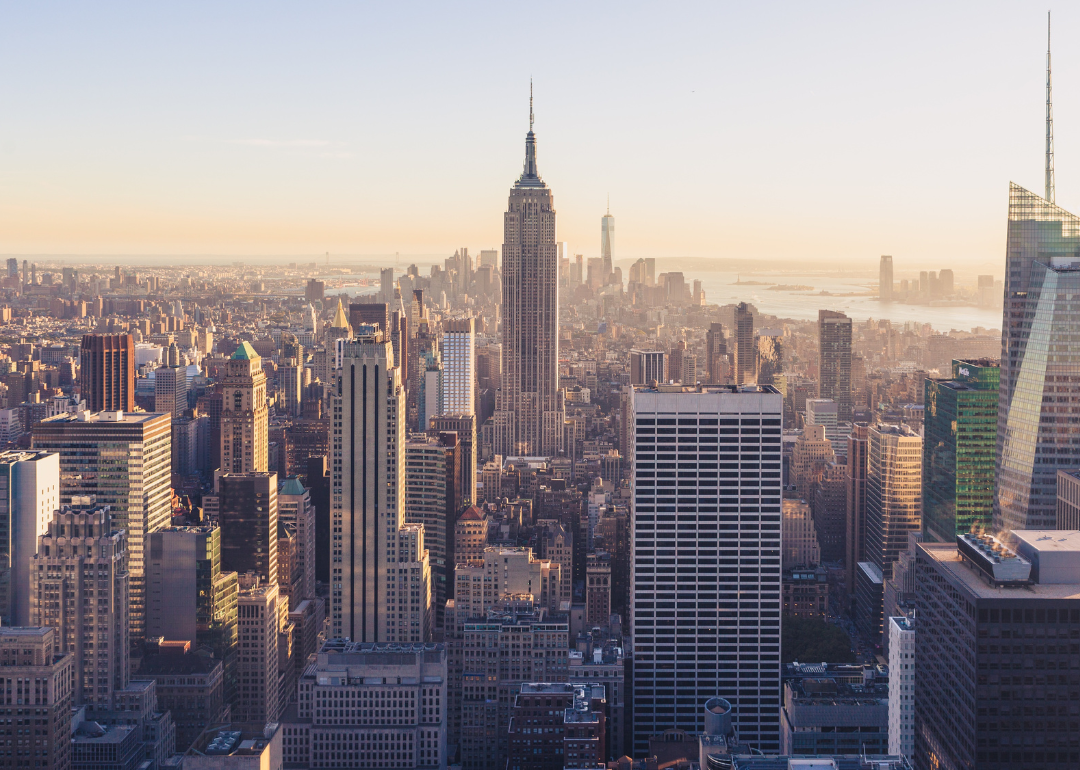
#40. New York City
An aerial view of downtown NYC’s skyline.
– Median time-to-crime from 2017 to 2021: 6.3 years
— Crime guns traced to known purchaser: 12,910 (67.9% of all crime guns)
— Average annual traced crime guns per 10k residents: 4.5
Canva
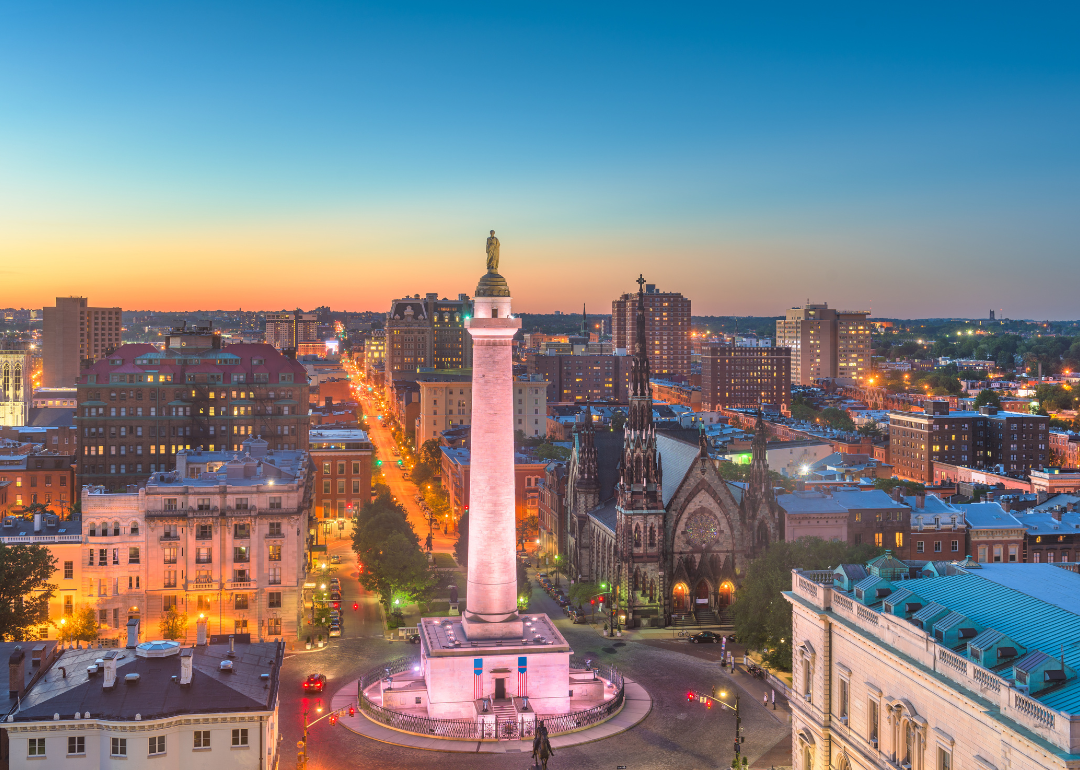
#39. Baltimore
An aerial view of Baltimore at dusk.
– Median time-to-crime from 2017 to 2021: 5.3 years
— Crime guns traced to known purchaser: 8,057 (60.4% of all crime guns)
— Average annual traced crime guns per 10k residents: 44.9
Canva
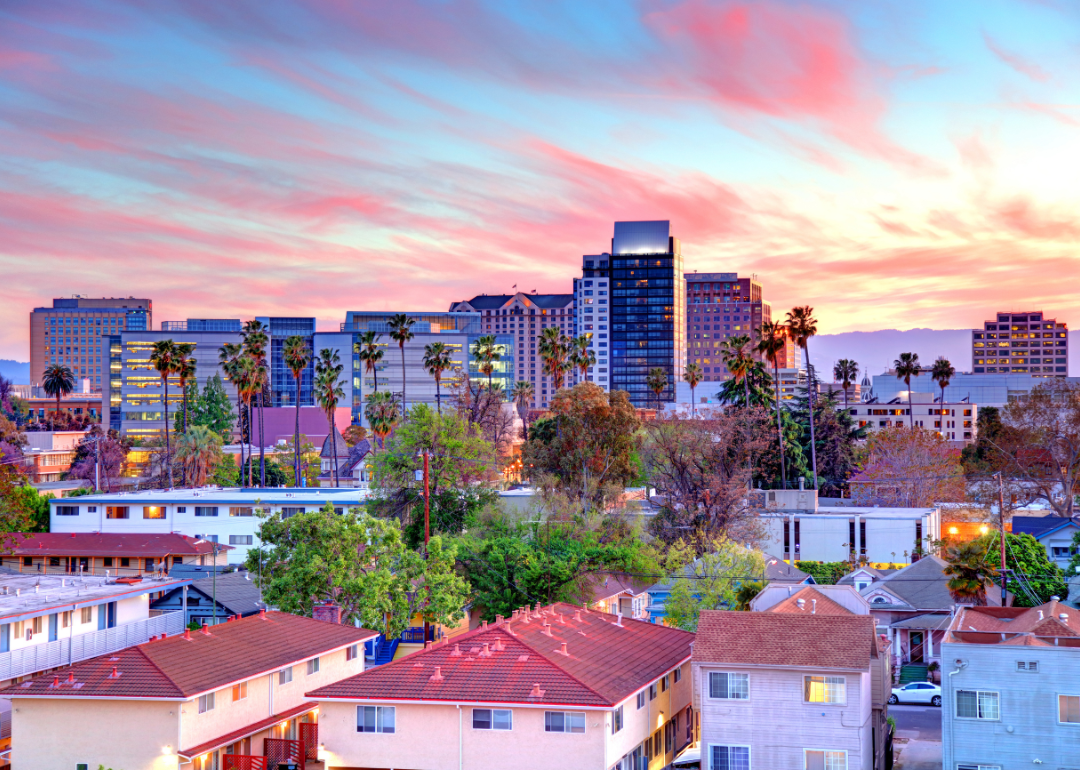
#38. San Jose, California
Buildings in San Jose at sunset.
– Median time-to-crime from 2017 to 2021: 4.6 years
— Crime guns traced to known purchaser: 1,536 (67.1% of all crime guns)
— Average annual traced crime guns per 10k residents: 4.5
Canva
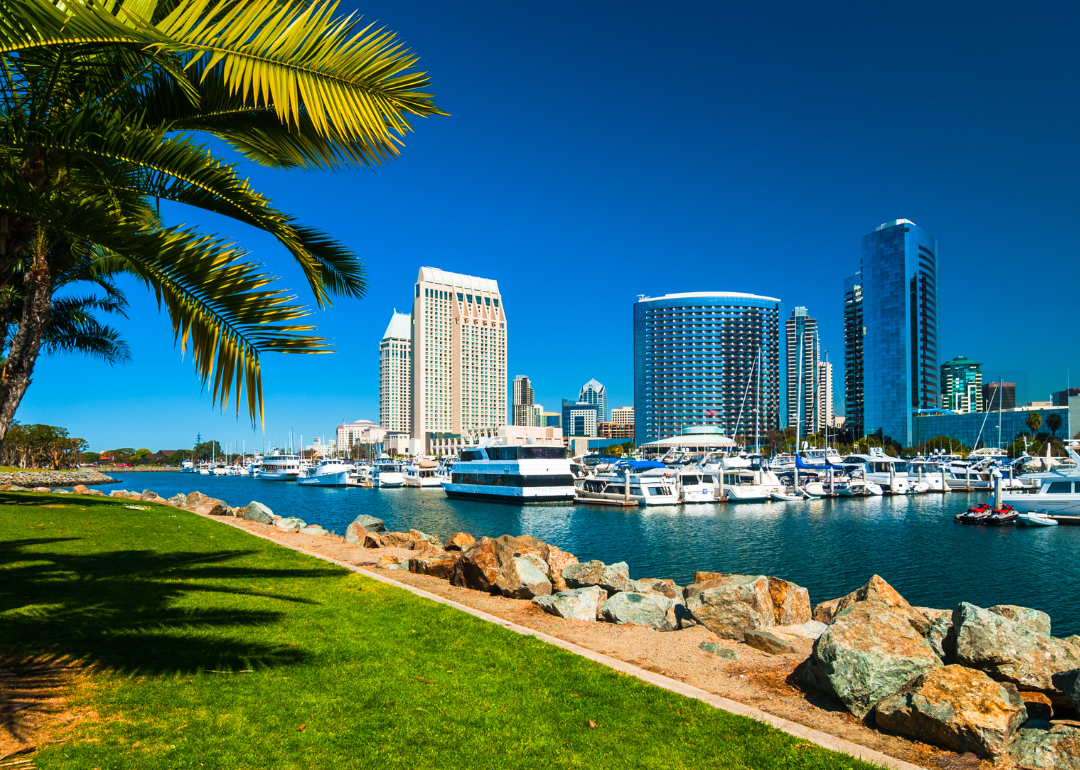
#37. San Diego
The San Diego skyline on a sunny day.
– Median time-to-crime from 2017 to 2021: 4.2 years
— Crime guns traced to known purchaser: 3,301 (57.9% of all crime guns)
— Average annual traced crime guns per 10k residents: 8.1
Canva
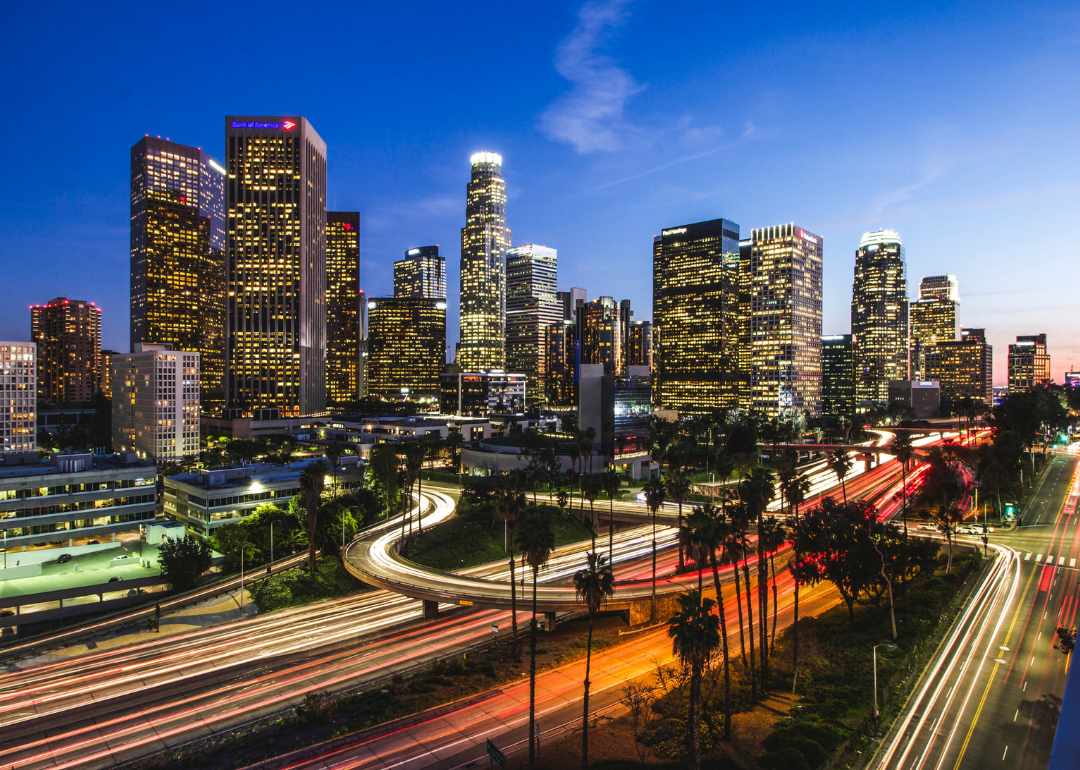
#36. Los Angeles
Los Angeles at dusk.
– Median time-to-crime from 2017 to 2021: 4.2 years
— Crime guns traced to known purchaser: 19,649 (63.8% of all crime guns)
— Average annual traced crime guns per 10k residents: 15.7
You may also like: 50 terms with origins in rural America

Canva
#35. San Bernardino, California
Palm trees outside a building in San Bernardino.
– Median time-to-crime from 2017 to 2021: 4.2 years
— Crime guns traced to known purchaser: 3,299 (69.8% of all crime guns)
— Average annual traced crime guns per 10k residents: 43.0

Canva
#34. Jacksonville, Florida
The Jacksonville skyline as viewed from across the water at night.
– Median time-to-crime from 2017 to 2021: 3.4 years
— Crime guns traced to known purchaser: 11,735 (86.2% of all crime guns)
— Average annual traced crime guns per 10k residents: 29.5
Canva
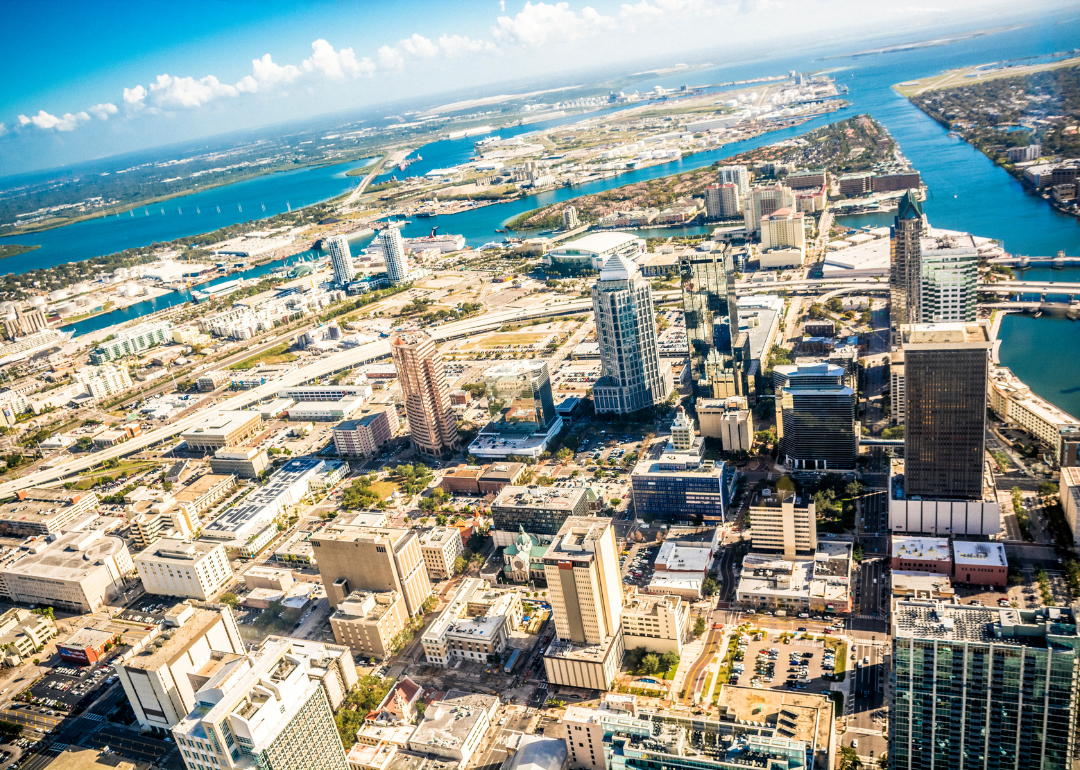
#33. Tampa, Florida
A bird’s-eye view of Tampa’s coastline.
– Median time-to-crime from 2017 to 2021: 3.2 years
— Crime guns traced to known purchaser: 8,595 (82.8% of all crime guns)
— Average annual traced crime guns per 10k residents: 53.7
Canva
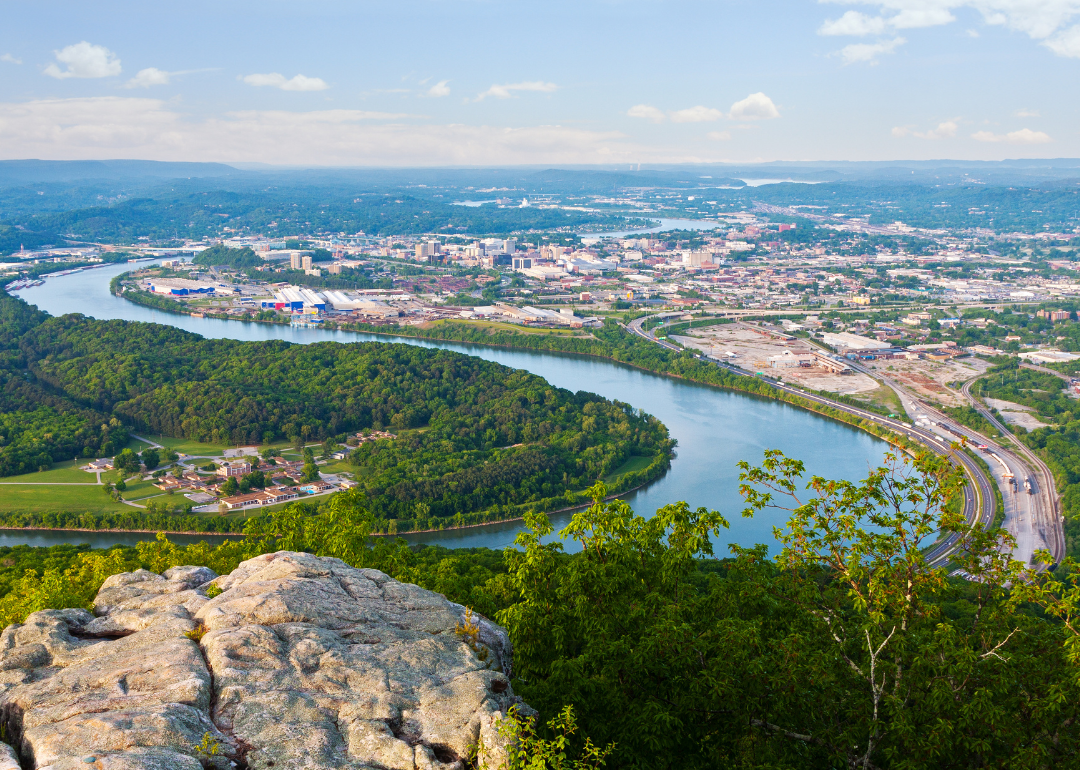
#32. Chattanooga, Tennessee
The Tennessee River looping past Chattanooga.
– Median time-to-crime from 2017 to 2021: 3.1 years
— Crime guns traced to known purchaser: 4,434 (76.8% of all crime guns)
— Average annual traced crime guns per 10k residents: 63.9
Canva
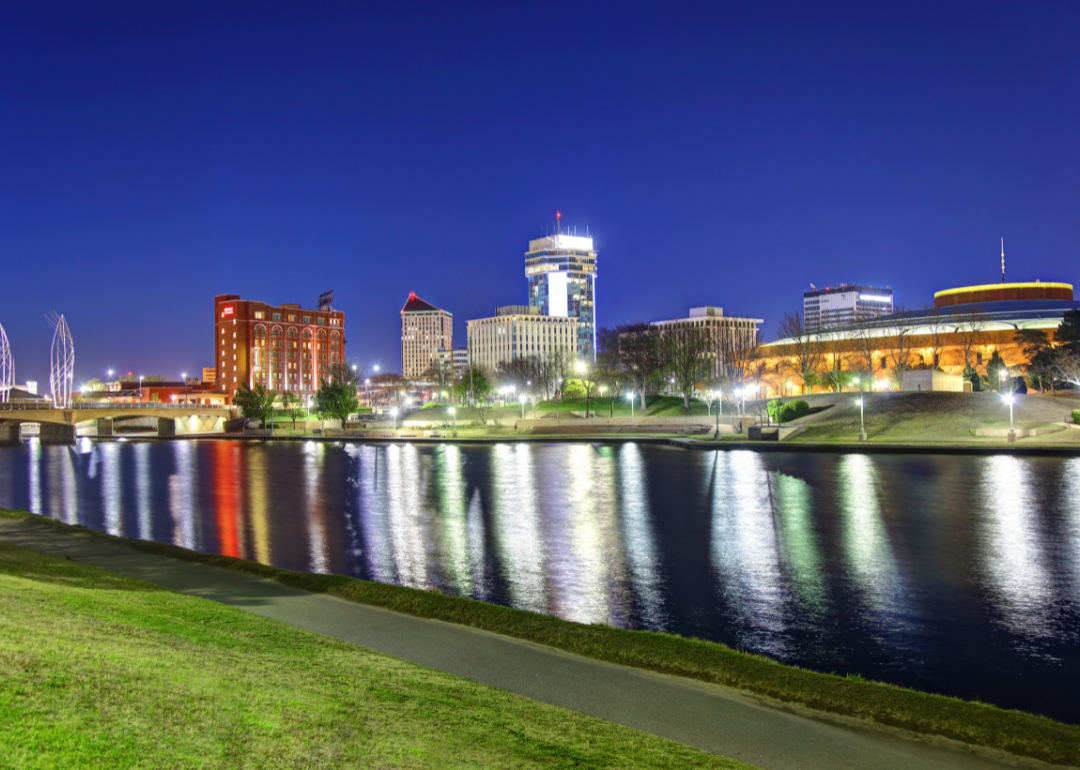
#31. Wichita, Kansas
Wichita’s skyline as seen at night.
– Median time-to-crime from 2017 to 2021: 3.1 years
— Crime guns traced to known purchaser: 5,534 (81.1% of all crime guns)
— Average annual traced crime guns per 10k residents: 34.7
You may also like: Marijuana violations have taken over 10,000 truck drivers off the road this year, adding more supply chain disruptions
Canva
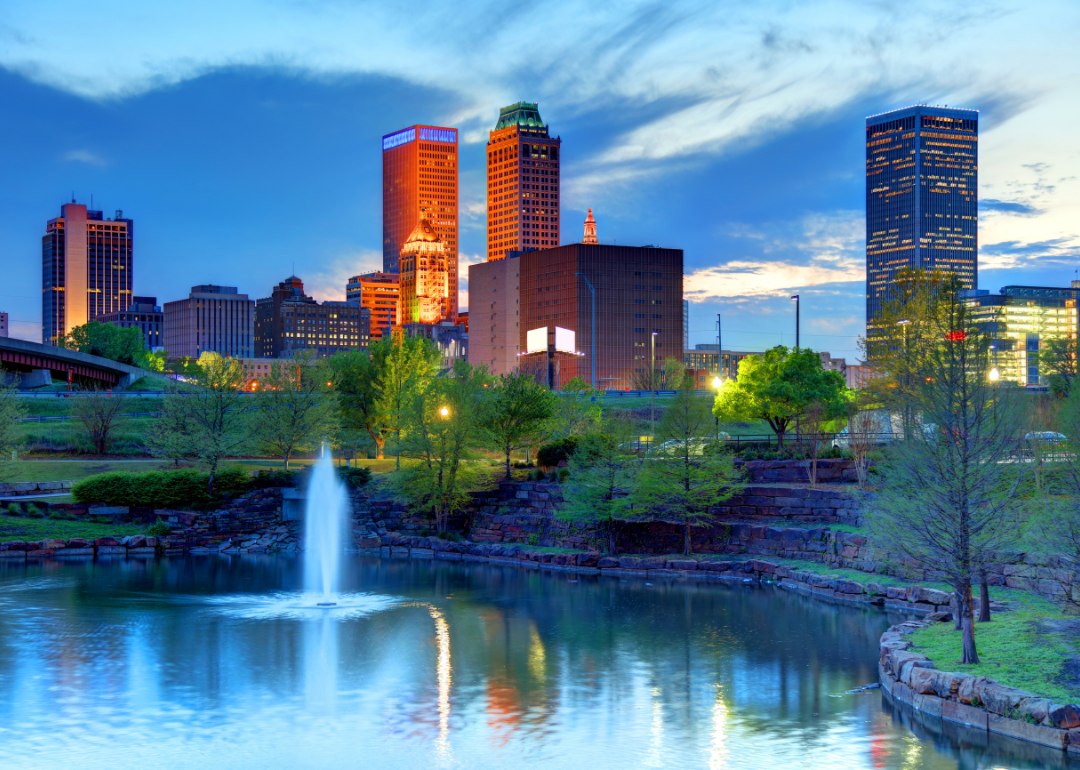
#30. Tulsa, Oklahoma
The downtown Tulsa skyline with a fountain in the foreground.
– Median time-to-crime from 2017 to 2021: 3.1 years
— Crime guns traced to known purchaser: 6,570 (85.2% of all crime guns)
— Average annual traced crime guns per 10k residents: 37.9
Canva
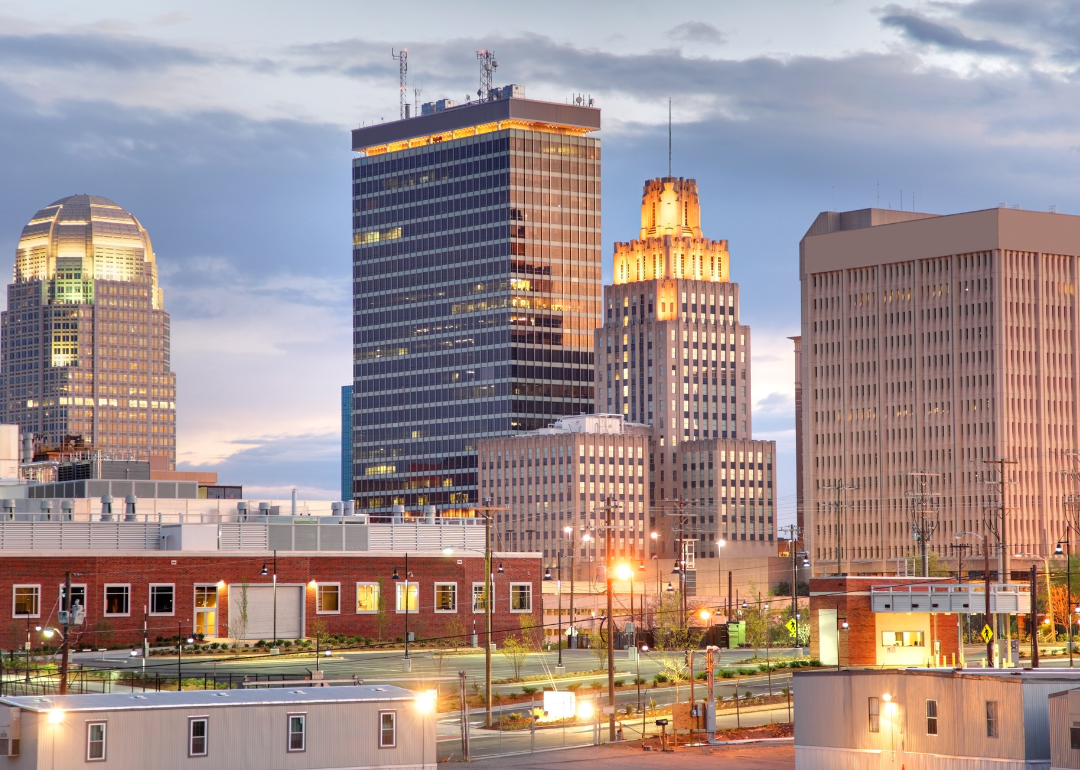
#29. Winston-Salem, North Carolina
The skyline of Winston-Salem on a cloudy day.
– Median time-to-crime from 2017 to 2021: 3 years
— Crime guns traced to known purchaser: 4,008 (77.3% of all crime guns)
— Average annual traced crime guns per 10k residents: 41.9
Canva
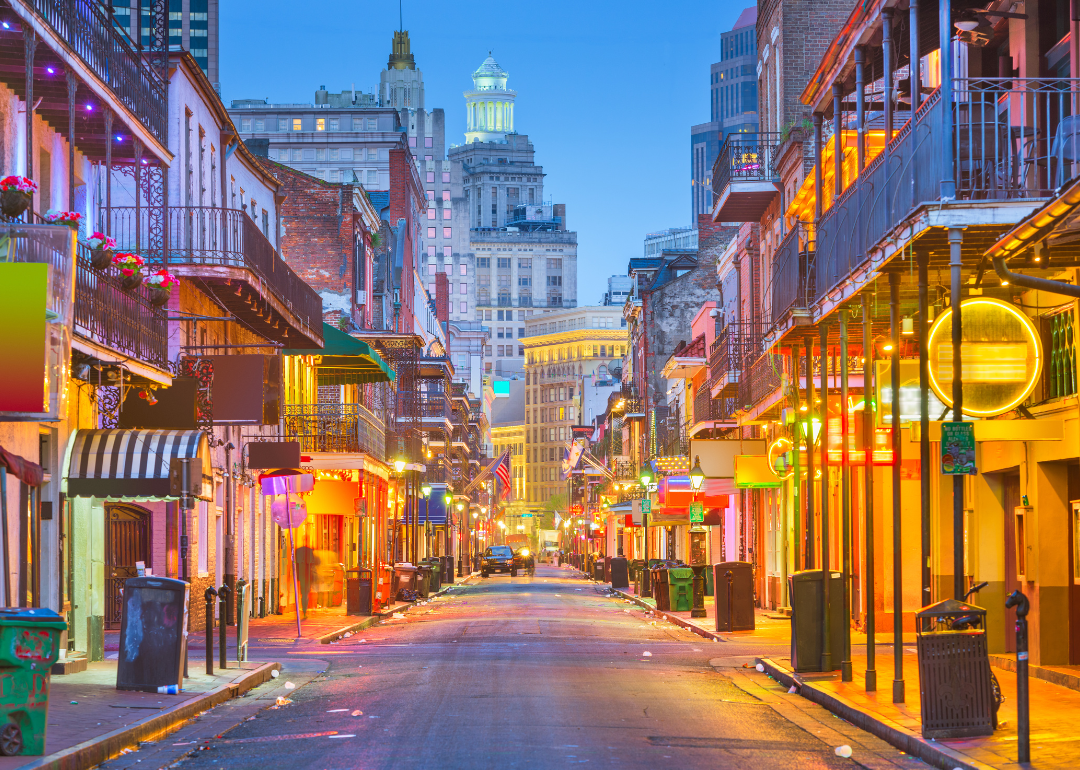
#28. New Orleans
Bourbon Street in New Orleans as seen at street level.
– Median time-to-crime from 2017 to 2021: 2.9 years
— Crime guns traced to known purchaser: 7,497 (83.1% of all crime guns)
— Average annual traced crime guns per 10k residents: 46.8
Canva
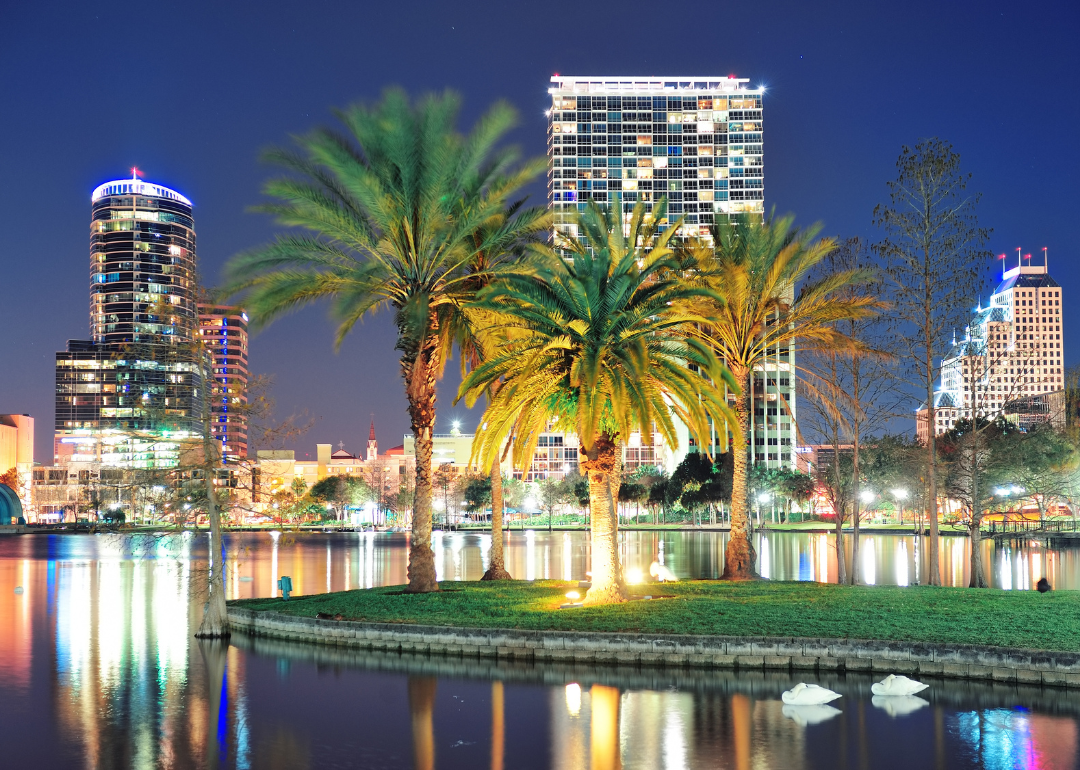
#27. Orlando, Florida
Palm trees outside a building in Orlando at night.
– Median time-to-crime from 2017 to 2021: 2.9 years
— Crime guns traced to known purchaser: 9,789 (87.6% of all crime guns)
— Average annual traced crime guns per 10k residents: 75.9
Canva
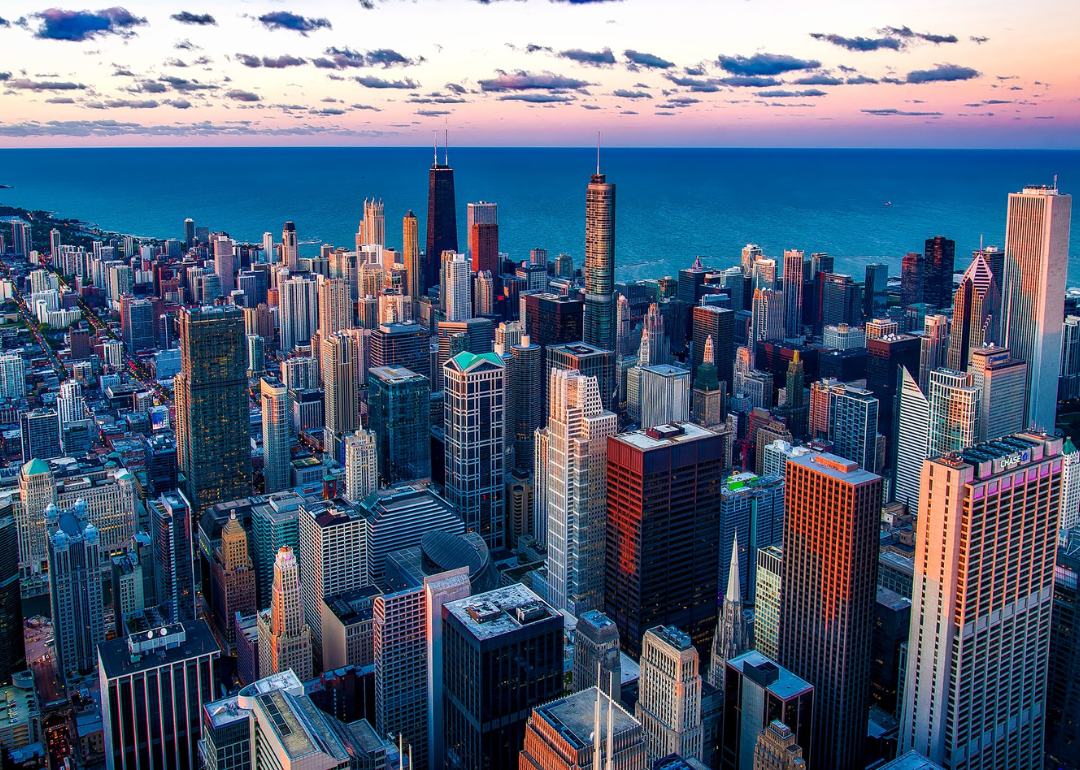
#26. Chicago
An aerial view of Chicago and Lake Michigan.
– Median time-to-crime from 2017 to 2021: 2.8 years
— Crime guns traced to known purchaser: 37,680 (74.9% of all crime guns)
— Average annual traced crime guns per 10k residents: 37.2
You may also like: What kind of data is your car collecting about you?
Canva
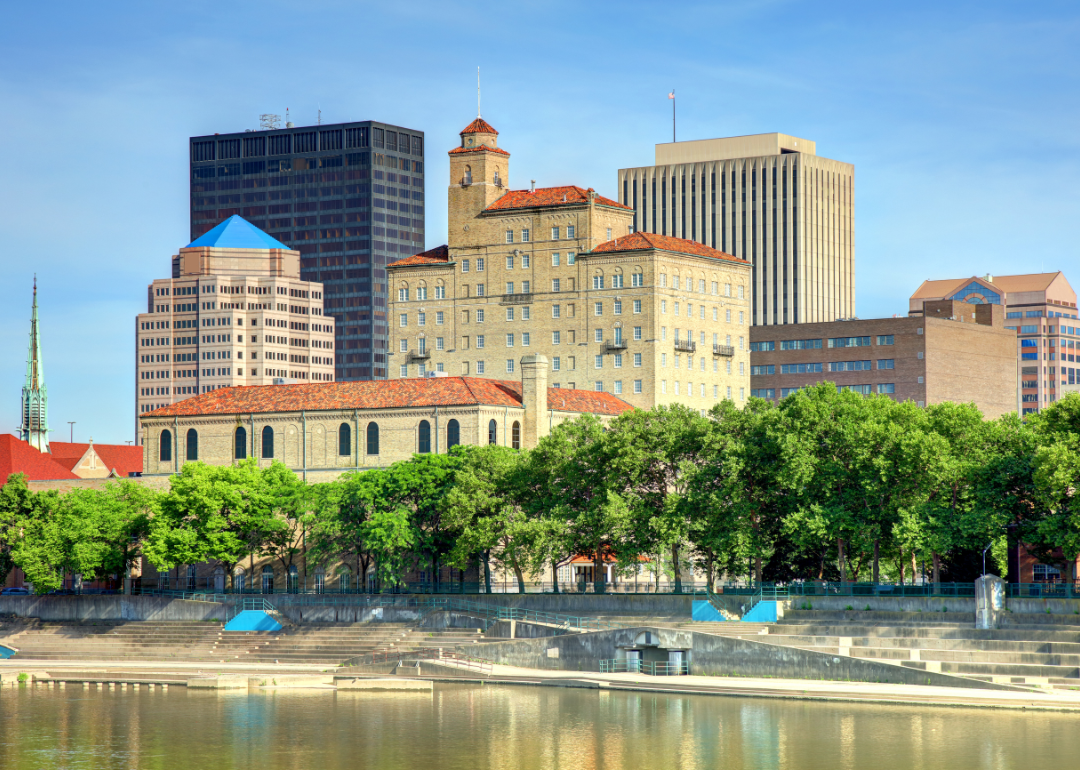
#25. Dayton, Ohio
A historic building on the river in Dayton.
– Median time-to-crime from 2017 to 2021: 2.8 years
— Crime guns traced to known purchaser: 4,089 (80.2% of all crime guns)
— Average annual traced crime guns per 10k residents: 73.4
Canva
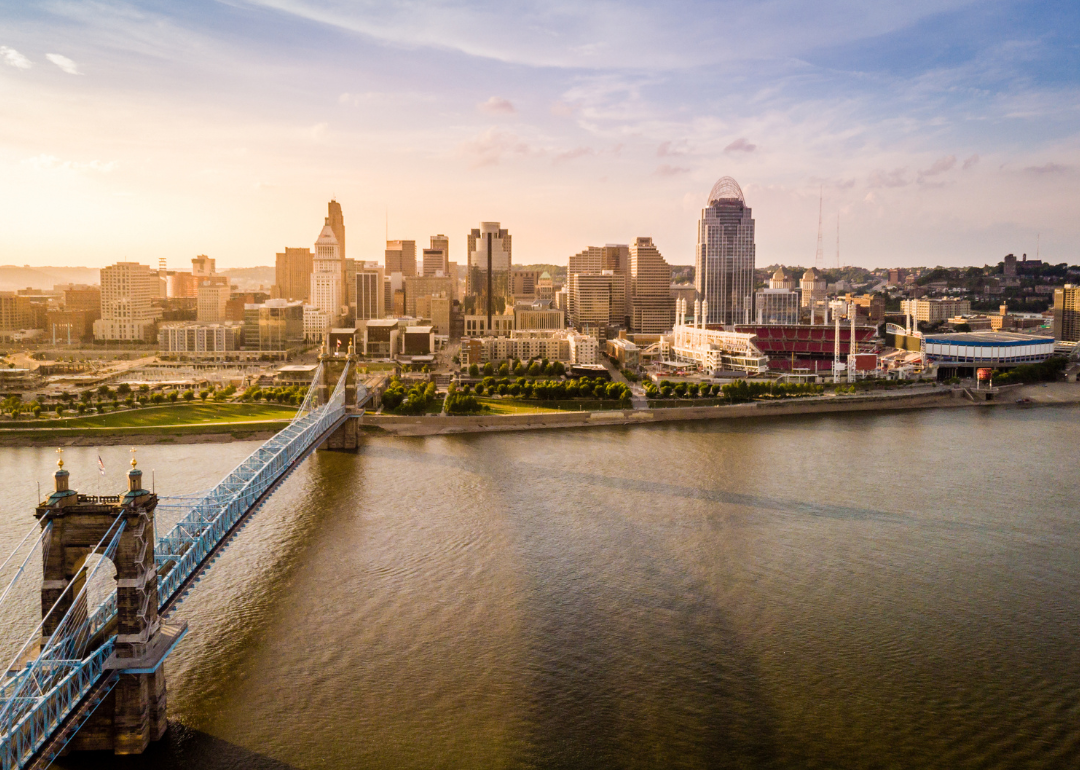
#24. Cincinnati
A bridge leading to downtown Cincinnati.
– Median time-to-crime from 2017 to 2021: 2.7 years
— Crime guns traced to known purchaser: 8,484 (85.0% of all crime guns)
— Average annual traced crime guns per 10k residents: 65.4
Canva
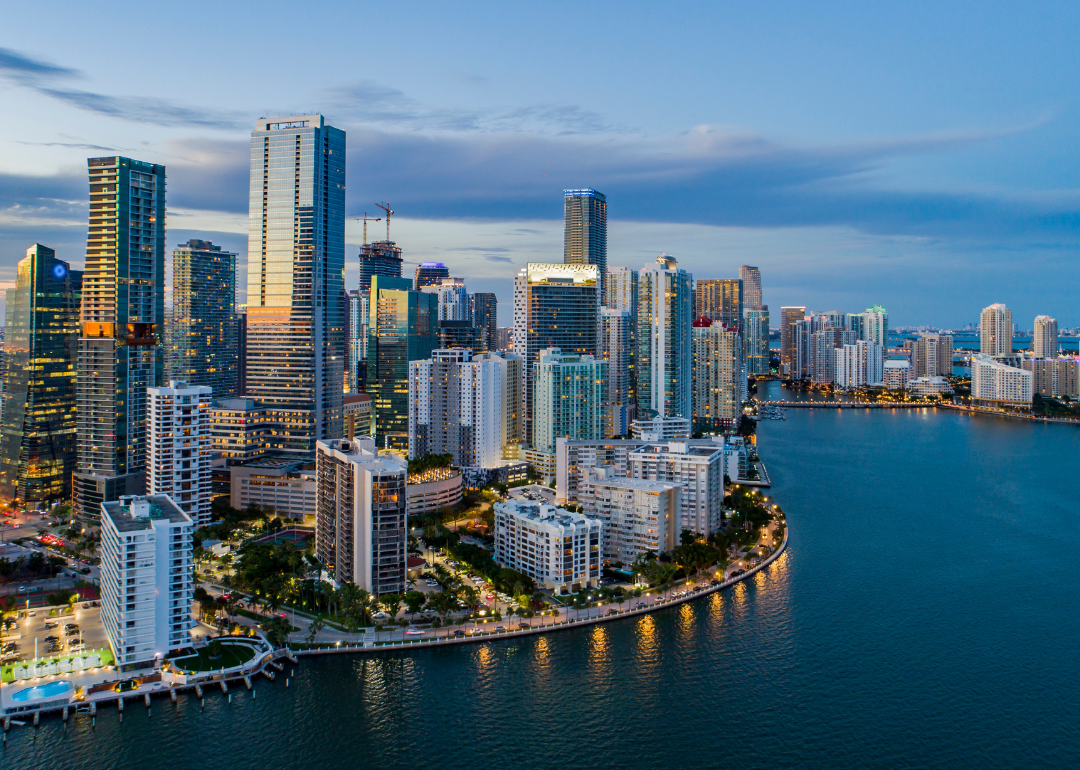
#23. Miami
Miami’s coastline at night.
– Median time-to-crime from 2017 to 2021: 2.5 years
— Crime guns traced to known purchaser: 7,133 (81.4% of all crime guns)
— Average annual traced crime guns per 10k residents: 38.8
Canva
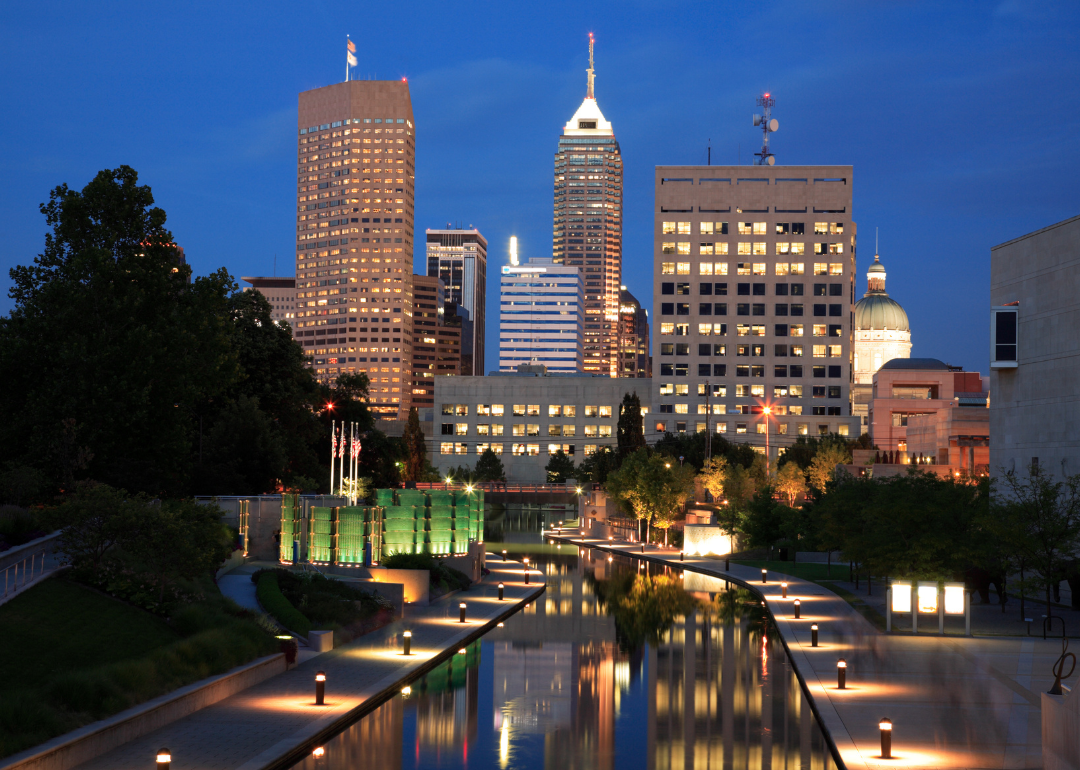
#22. Indianapolis
Indianapolis’s skyline as seen at night.
– Median time-to-crime from 2017 to 2021: 2.5 years
— Crime guns traced to known purchaser: 16,589 (82.0% of all crime guns)
— Average annual traced crime guns per 10k residents: 46.4
Canva
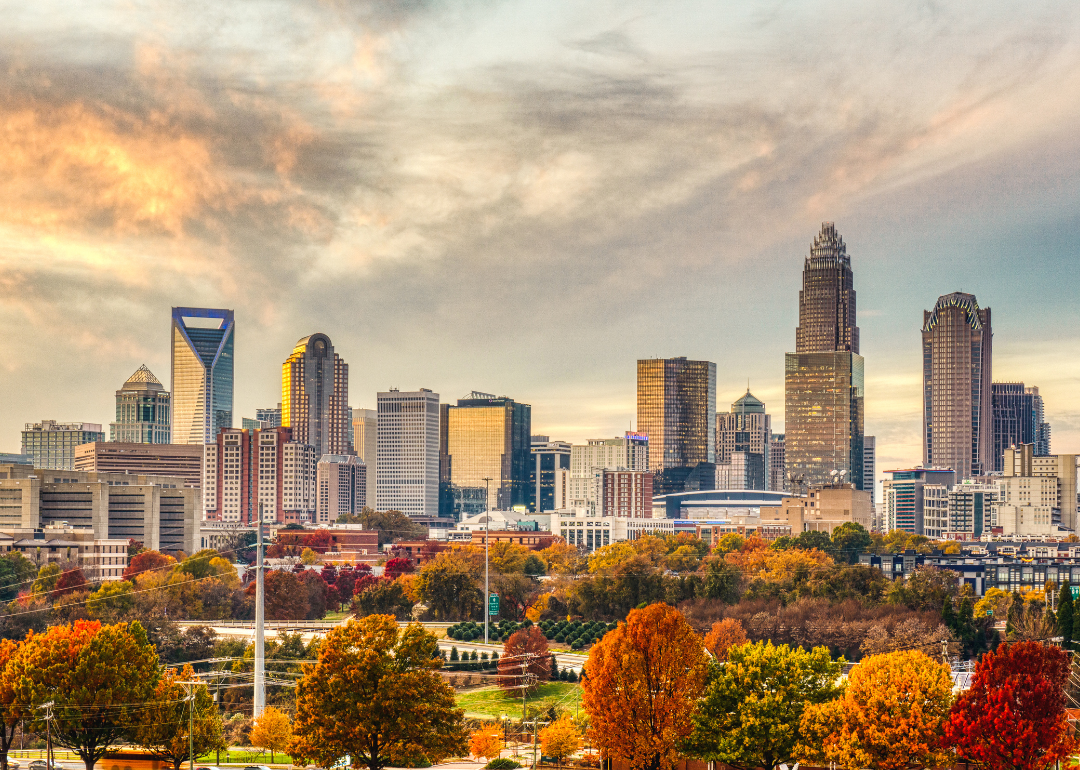
#21. Charlotte, North Carolina
Charlotte’s skyline during fall.
– Median time-to-crime from 2017 to 2021: 2.5 years
— Crime guns traced to known purchaser: 11,882 (82.8% of all crime guns)
— Average annual traced crime guns per 10k residents: 33.0
You may also like: The most financially damaging cybercrimes in your state
Canva
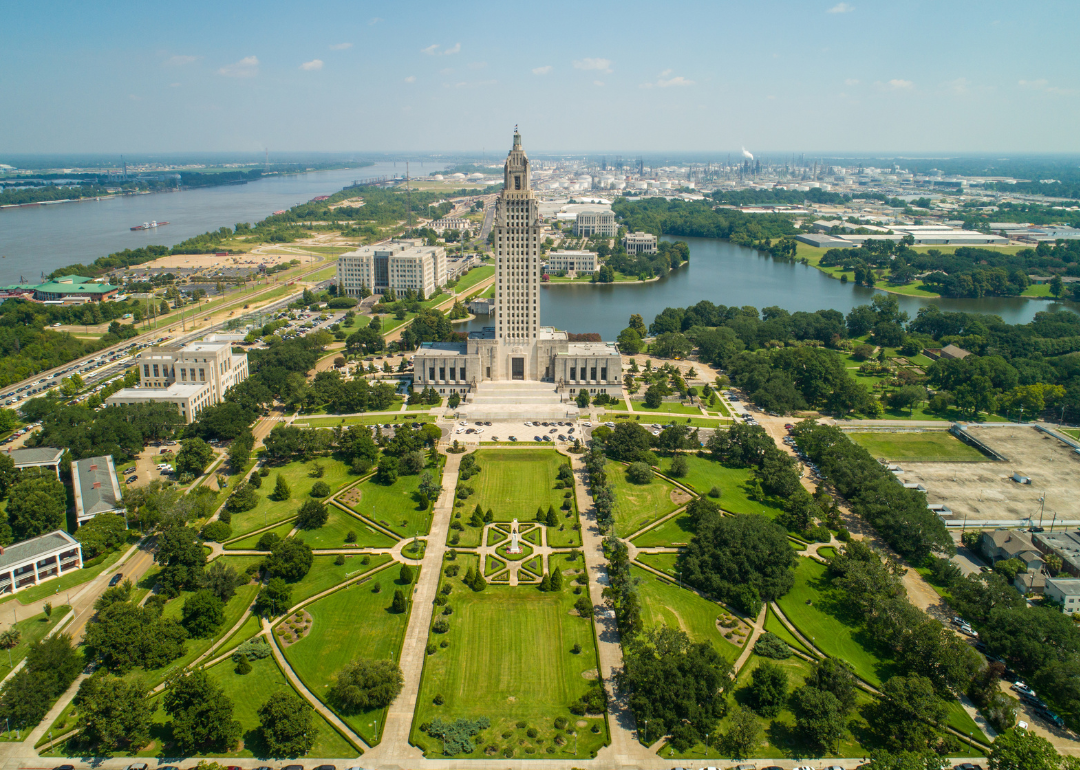
#20. Baton Rouge, Louisiana
An aerial drone photo of State Capitol Park in Baton Rouge.
– Median time-to-crime from 2017 to 2021: 2.5 years
— Crime guns traced to known purchaser: 7,339 (85.9% of all crime guns)
— Average annual traced crime guns per 10k residents: 76.4
Canva
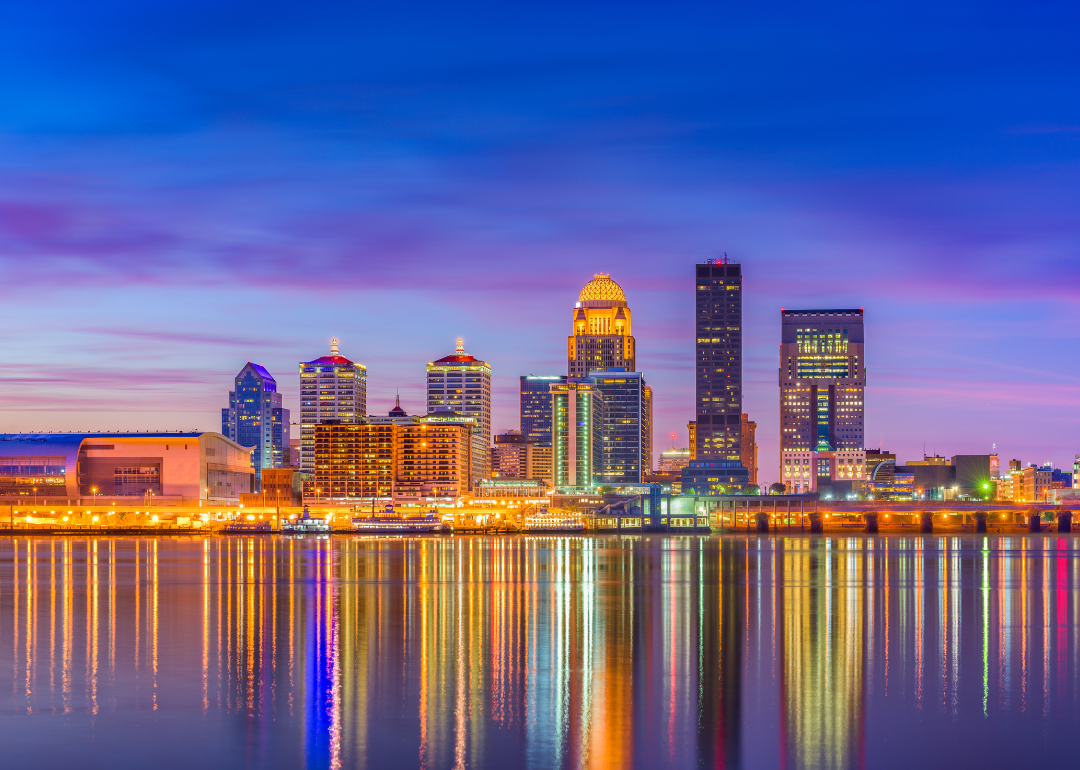
#19. Louisville, Kentucky
Louisville’s skyline and its reflection in water at night.
– Median time-to-crime from 2017 to 2021: 2.4 years
— Crime guns traced to known purchaser: 11,785 (76.9% of all crime guns)
— Average annual traced crime guns per 10k residents: 49.1
Canva
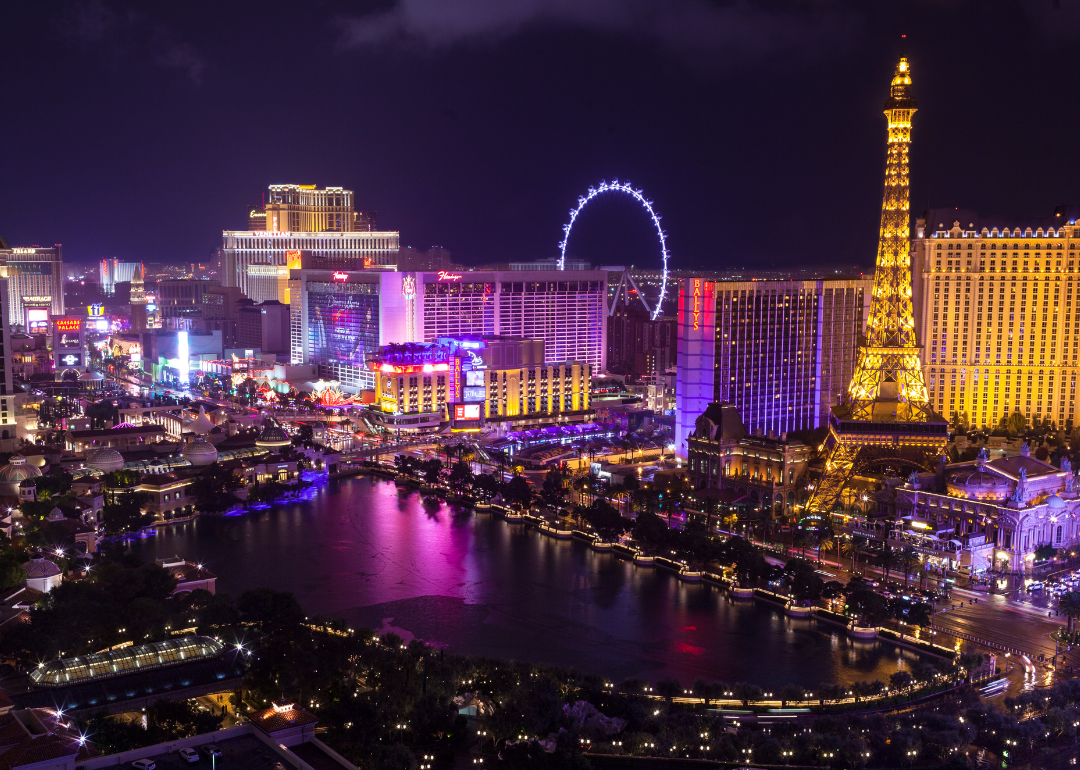
#18. Las Vegas
The Las Vegas Strip at night.
– Median time-to-crime from 2017 to 2021: 2.4 years
— Crime guns traced to known purchaser: 18,867 (80.7% of all crime guns)
— Average annual traced crime guns per 10k residents: 72.6
Canva
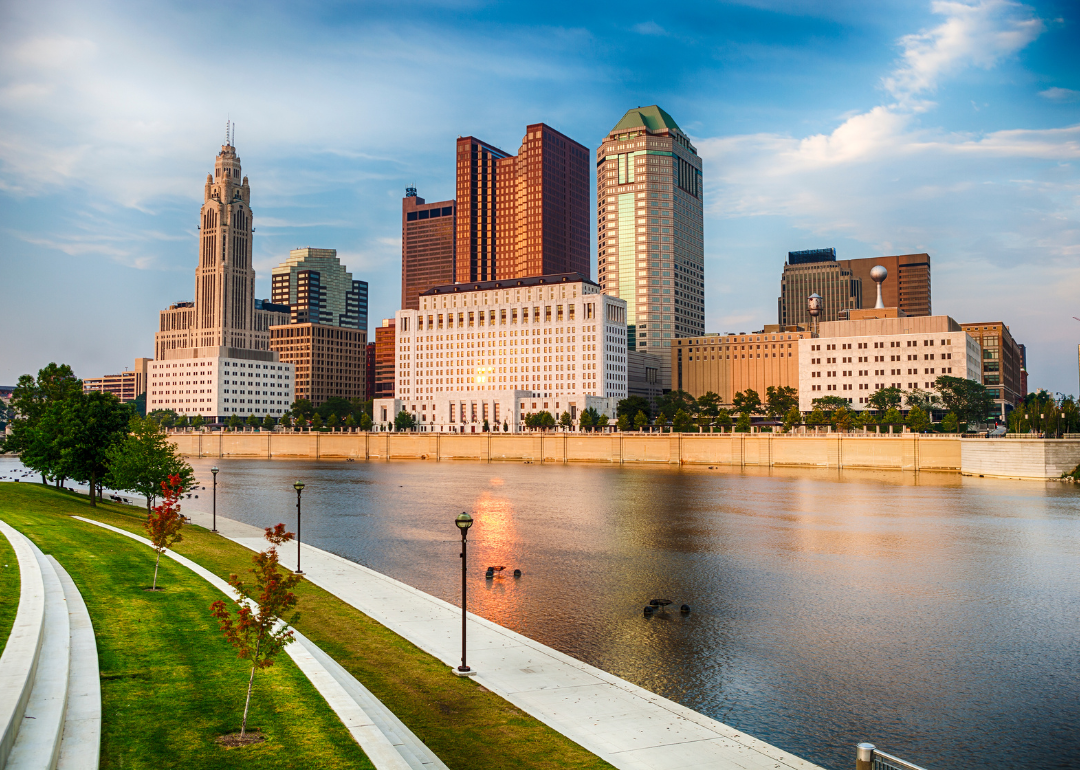
#17. Columbus, Ohio
Columbus’ skyline as seen on a sunny day.
– Median time-to-crime from 2017 to 2021: 2.4 years
— Crime guns traced to known purchaser: 12,147 (82.9% of all crime guns)
— Average annual traced crime guns per 10k residents: 32.8
Canva
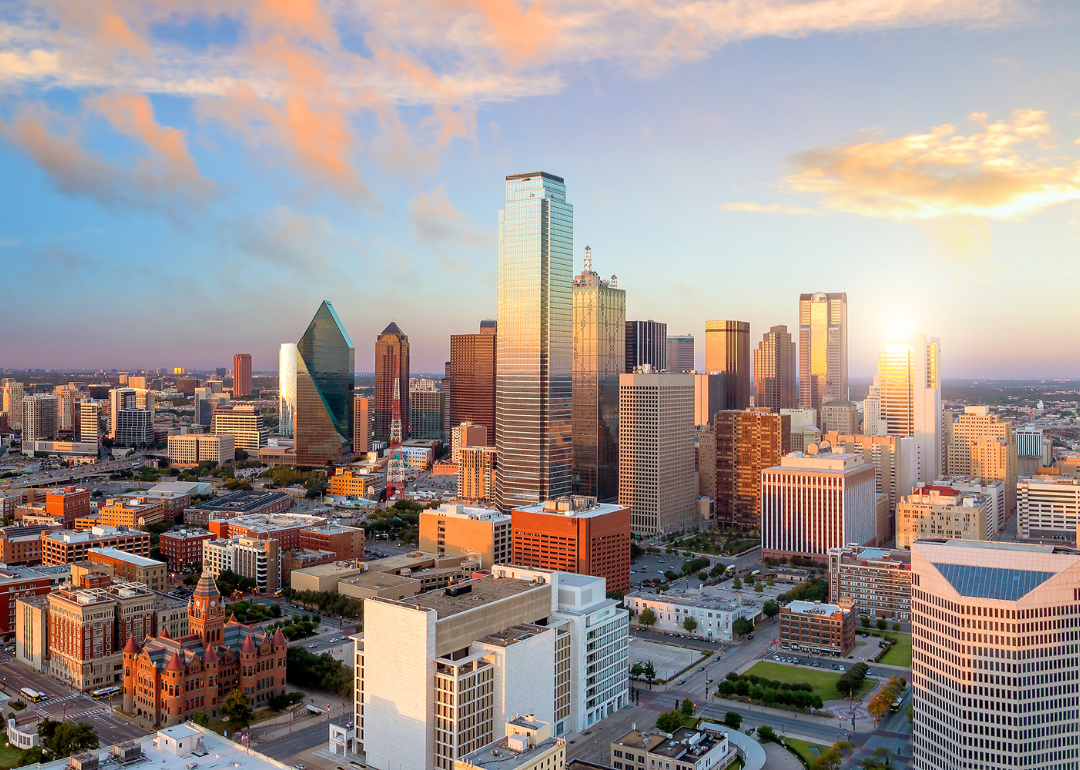
#16. Dallas
An aerial view of downtown Dallas on a sunny day.
– Median time-to-crime from 2017 to 2021: 2.4 years
— Crime guns traced to known purchaser: 16,722 (84.6% of all crime guns)
— Average annual traced crime guns per 10k residents: 30.1
You may also like: States with the most homelessness
Canva
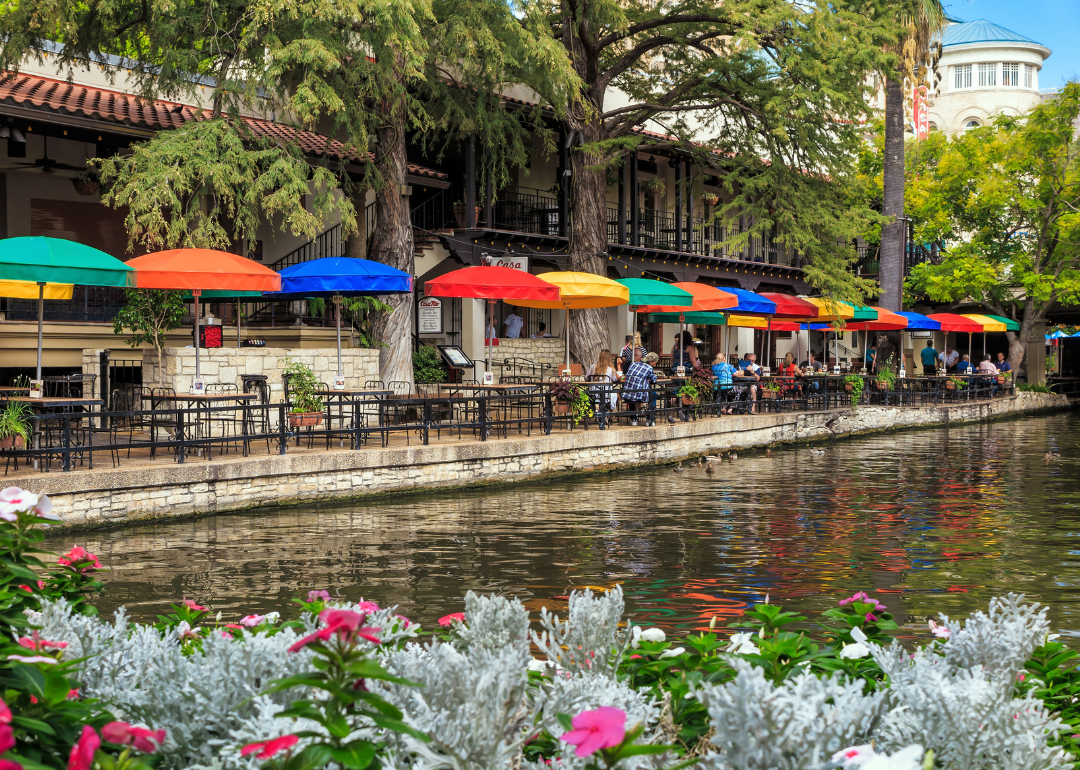
#15. San Antonio
The Riverwalk in San Antonio.
– Median time-to-crime from 2017 to 2021: 2.4 years
— Crime guns traced to known purchaser: 14,868 (85.5% of all crime guns)
— Average annual traced crime guns per 10k residents: 23.5

Canva
#14. Philadelphia
A street-level view of Philadelphia’s City Hall at dusk.
– Median time-to-crime from 2017 to 2021: 2.3 years
— Crime guns traced to known purchaser: 16,626 (70.9% of all crime guns)
— Average annual traced crime guns per 10k residents: 29.7
Canva
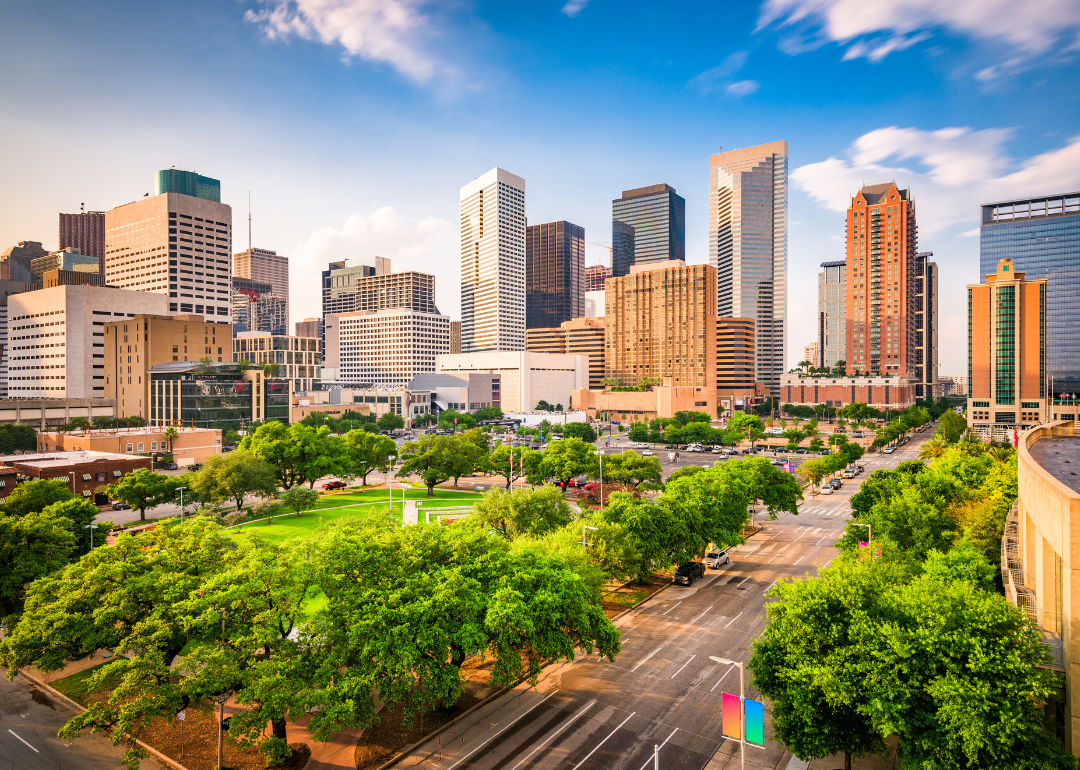
#13. Houston
Houston’s skyline on a sunny day.
– Median time-to-crime from 2017 to 2021: 2.3 years
— Crime guns traced to known purchaser: 38,839 (84.8% of all crime guns)
— Average annual traced crime guns per 10k residents: 39.8
Canva
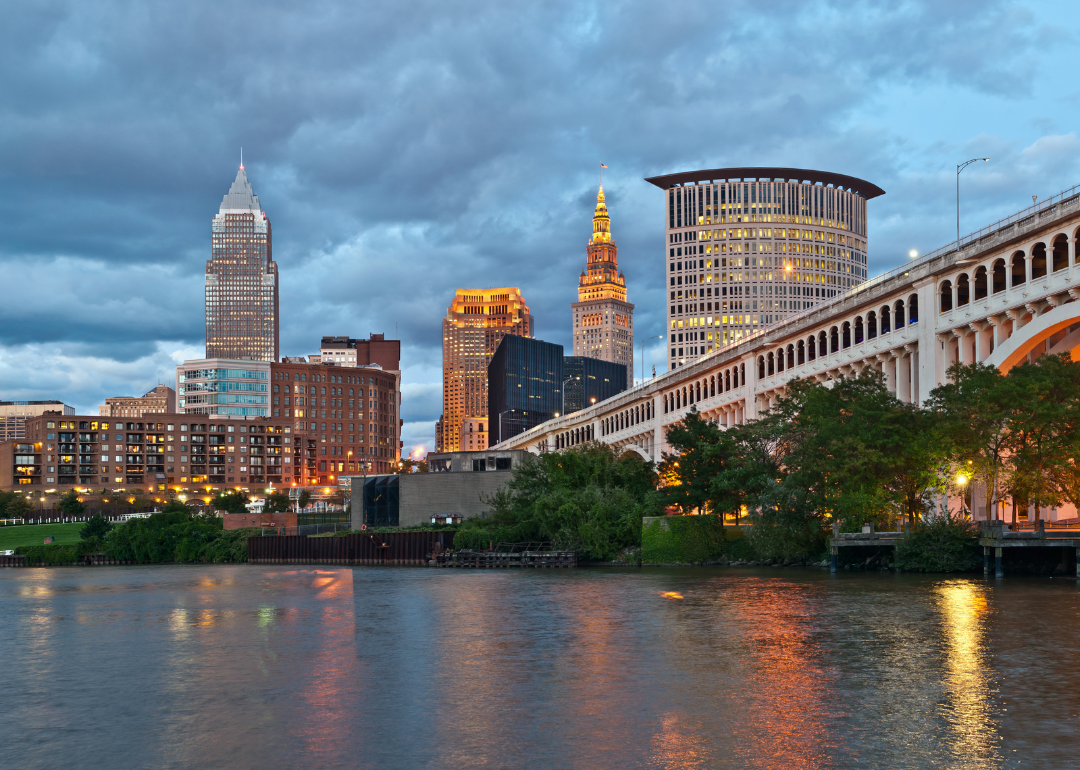
#12. Cleveland
Cleveland’s skyline as seen from across the river on a cloudy day.
– Median time-to-crime from 2017 to 2021: 2.2 years
— Crime guns traced to known purchaser: 7,851 (81.4% of all crime guns)
— Average annual traced crime guns per 10k residents: 51.2

Canva
#11. Huntsville, Alabama
Huntsville’s skyline as viewed at dusk.
– Median time-to-crime from 2017 to 2021: 2.2 years
— Crime guns traced to known purchaser: 4,929 (85.4% of all crime guns)
— Average annual traced crime guns per 10k residents: 56.1
You may also like: Here’s how much legislation in each state restricts or protects trans youth
Canva
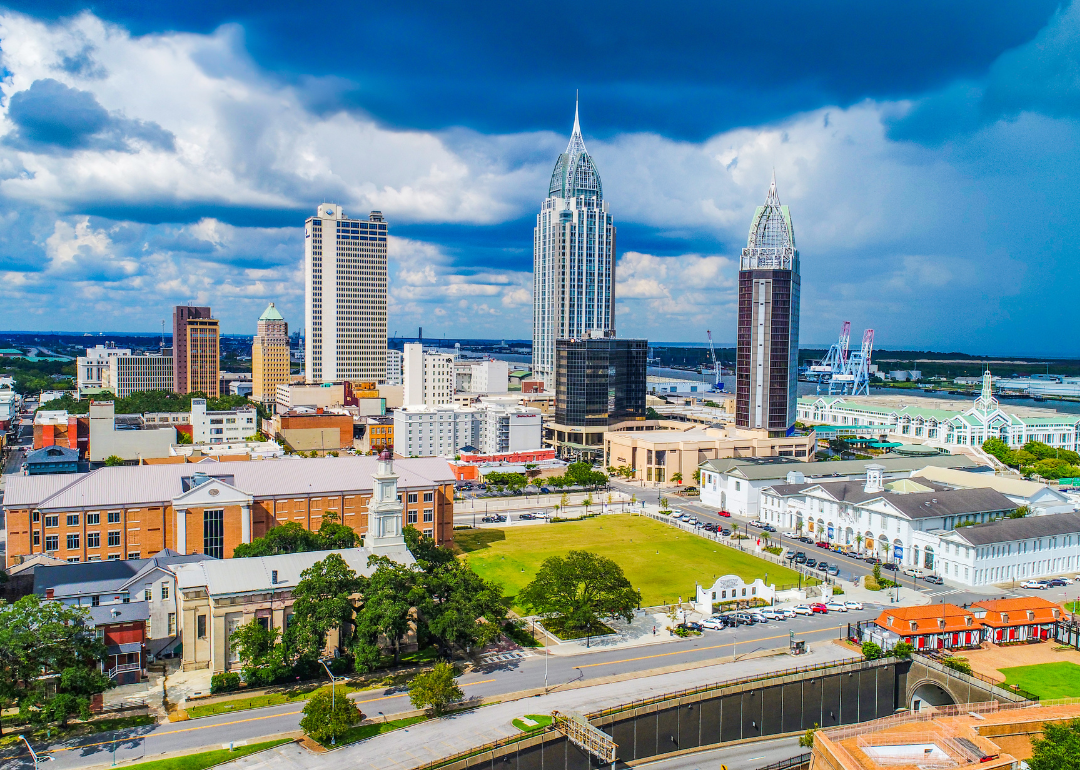
#10. Mobile, Alabama
Downtown Mobile’s skyline on a sunny day.
– Median time-to-crime from 2017 to 2021: 2.2 years
— Crime guns traced to known purchaser: 4,757 (87.0% of all crime guns)
— Average annual traced crime guns per 10k residents: 58.3
Canva
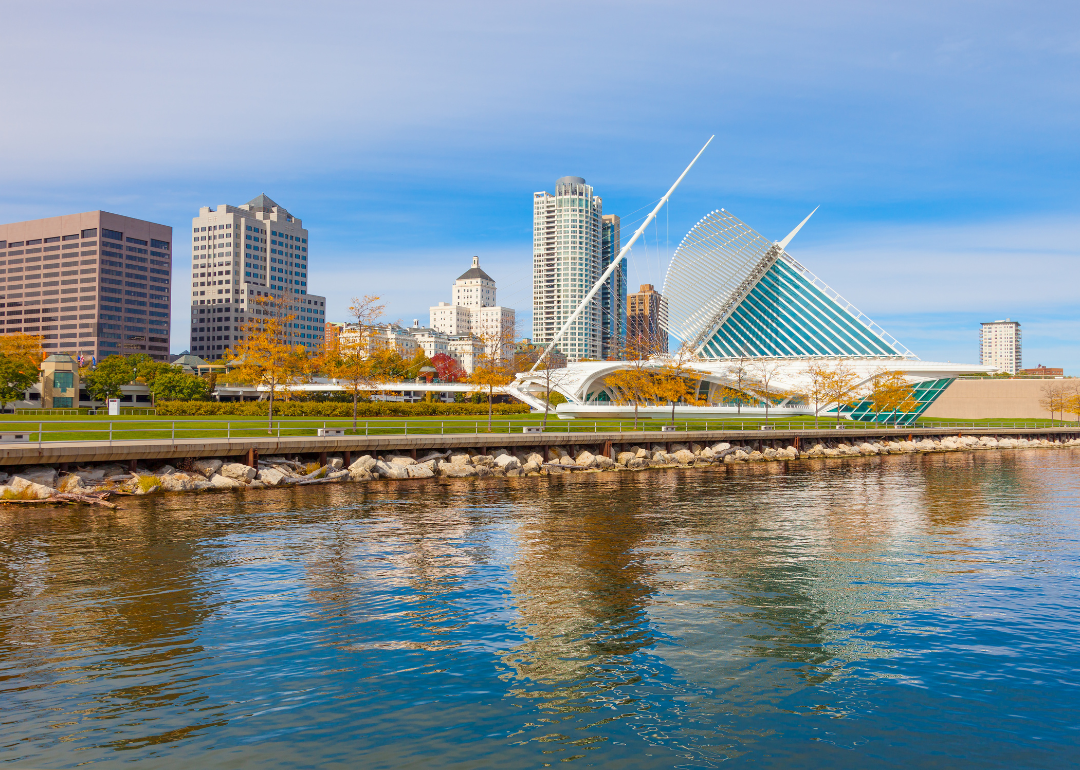
#9. Milwaukee
Milwaukee’s skyline as seen from across the river.
– Median time-to-crime from 2017 to 2021: 2.2 years
— Crime guns traced to known purchaser: 13,072 (88.3% of all crime guns)
— Average annual traced crime guns per 10k residents: 50.9
Canva
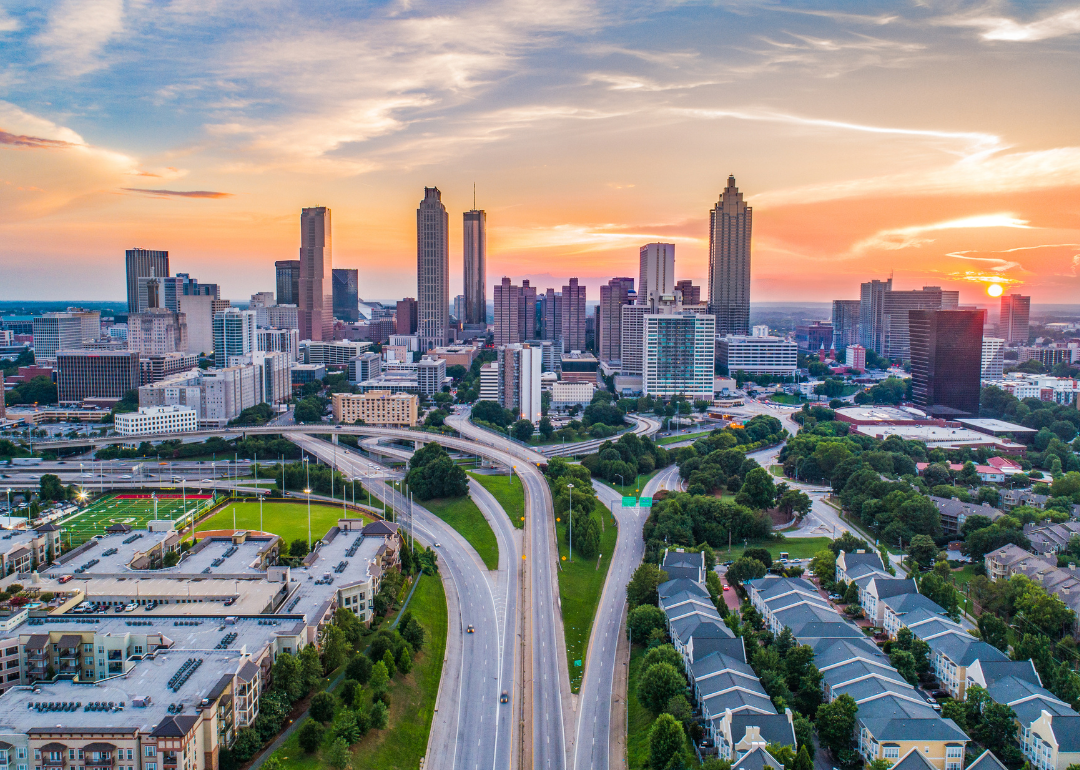
#8. Atlanta
Downtown Atlanta’s skyline at sunset.
– Median time-to-crime from 2017 to 2021: 2.1 years
— Crime guns traced to known purchaser: 13,035 (85.0% of all crime guns)
— Average annual traced crime guns per 10k residents: 62.4
Canva
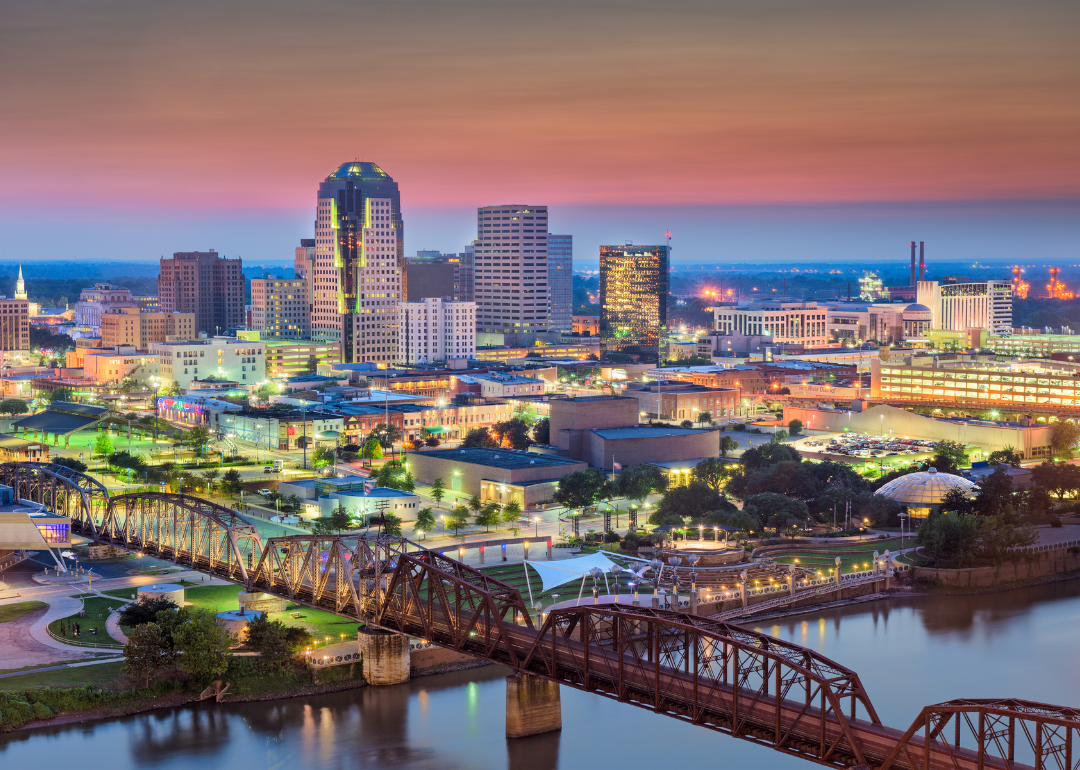
#7. Shreveport, Louisiana
The skyline in Shreveport at night.
– Median time-to-crime from 2017 to 2021: 2 years
— Crime guns traced to known purchaser: 4,550 (85.7% of all crime guns)
— Average annual traced crime guns per 10k residents: 56.5

Canva
#6. Memphis, Tennessee
An aerial view of downtown Memphis’ skyline.
– Median time-to-crime from 2017 to 2021: 1.9 years
— Crime guns traced to known purchaser: 19,369 (78.1% of all crime guns)
— Average annual traced crime guns per 10k residents: 77.5
You may also like: How background checks on popular dating apps and websites work
Canva
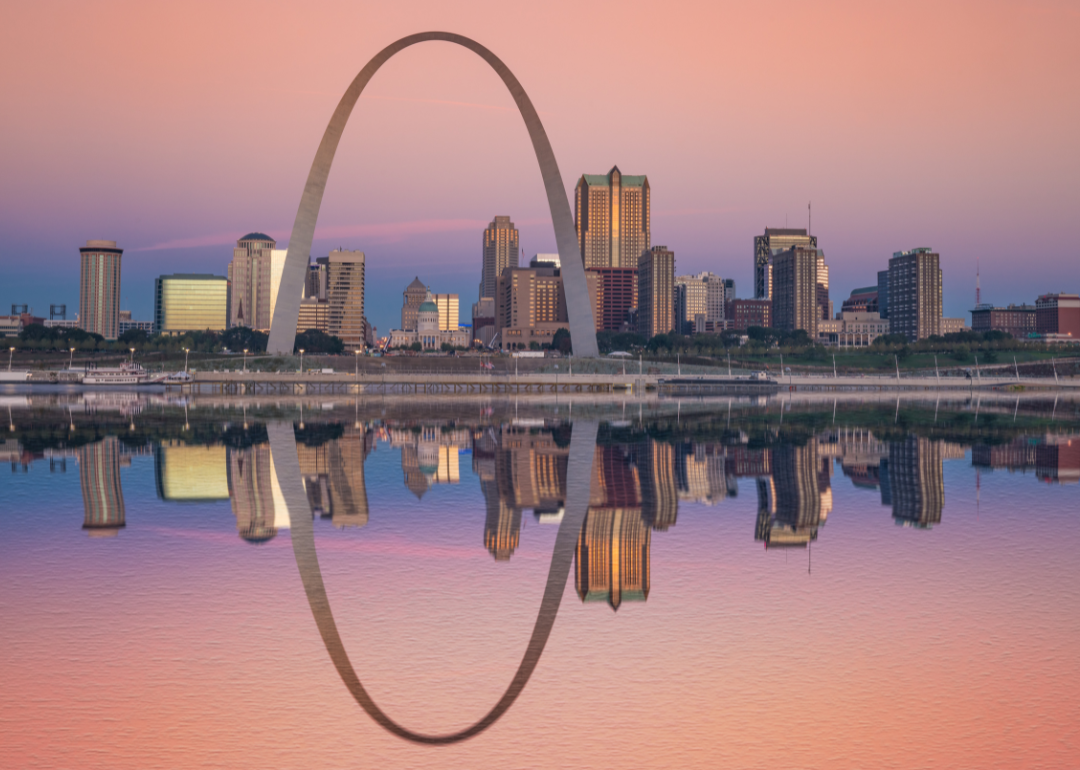
#5. St. Louis
St. Louis and its iconic arch being reflected in water at sunrise.
– Median time-to-crime from 2017 to 2021: 1.9 years
— Crime guns traced to known purchaser: 12,289 (83.8% of all crime guns)
— Average annual traced crime guns per 10k residents: 97.5
Canva
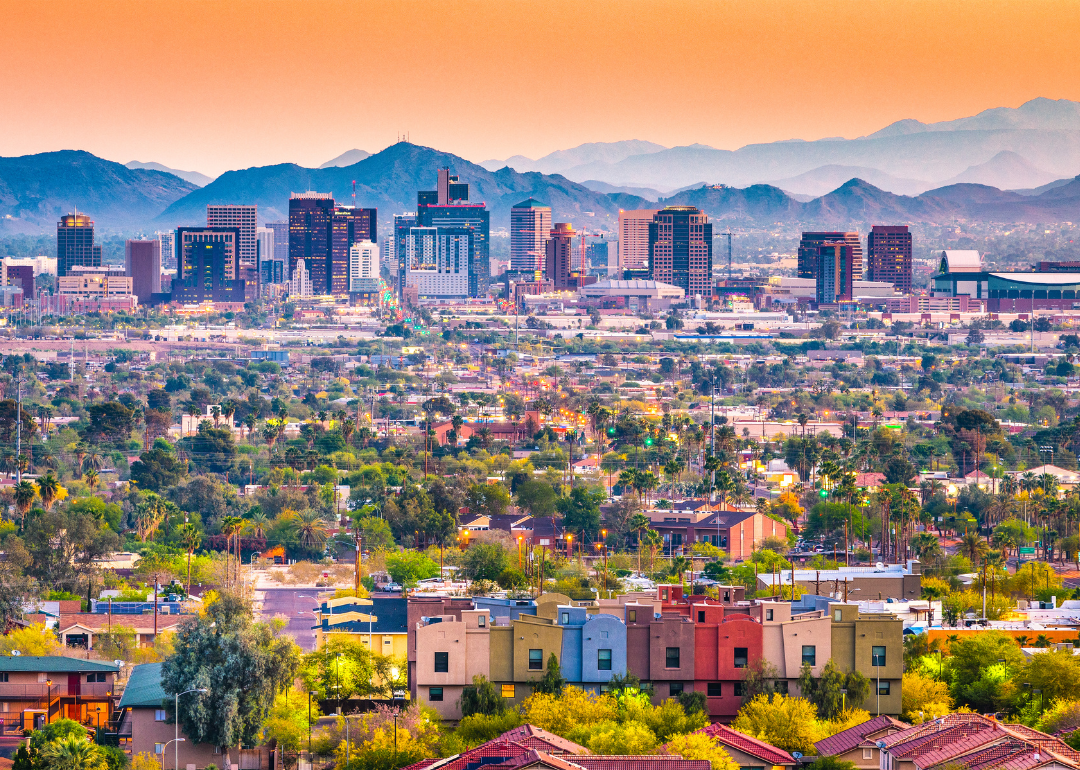
#4. Phoenix
Phoenix’s skyline with mountains in the background as seen from afar.
– Median time-to-crime from 2017 to 2021: 1.8 years
— Crime guns traced to known purchaser: 13,294 (84.1% of all crime guns)
— Average annual traced crime guns per 10k residents: 19.4
Canva
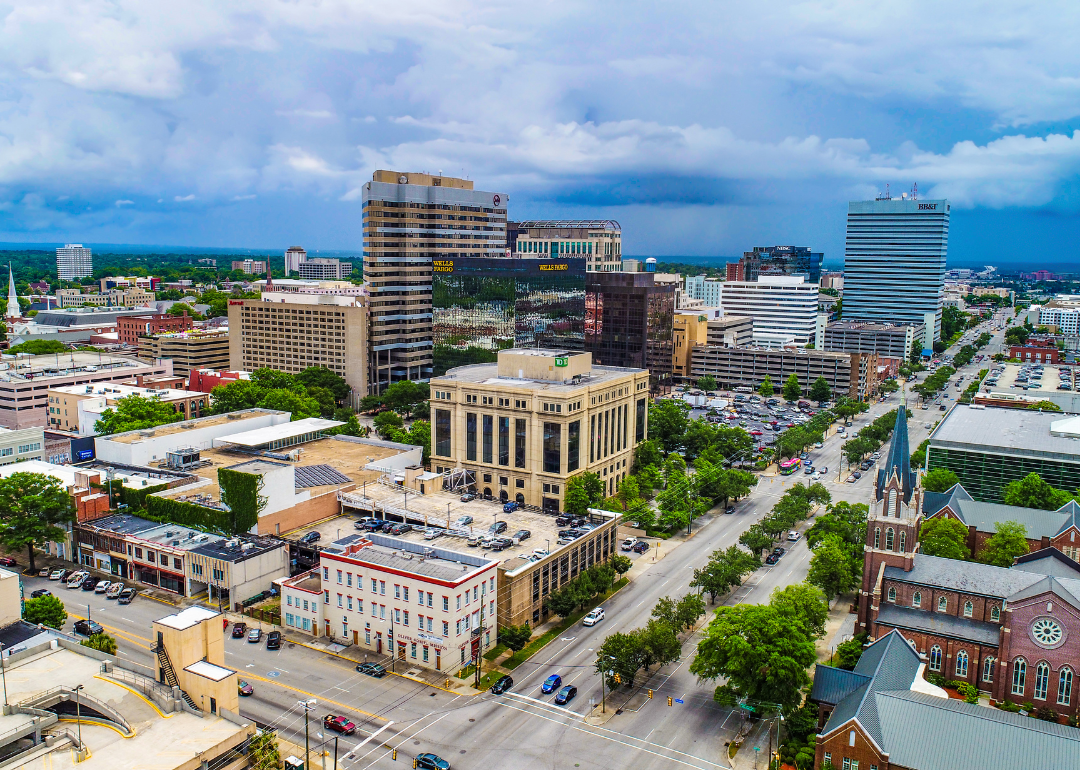
#3. Columbia, South Carolina
An aerial view of downtown Columbia.
– Median time-to-crime from 2017 to 2021: 1.7 years
— Crime guns traced to known purchaser: 5,489 (87.4% of all crime guns)
— Average annual traced crime guns per 10k residents: 96.9
Canva
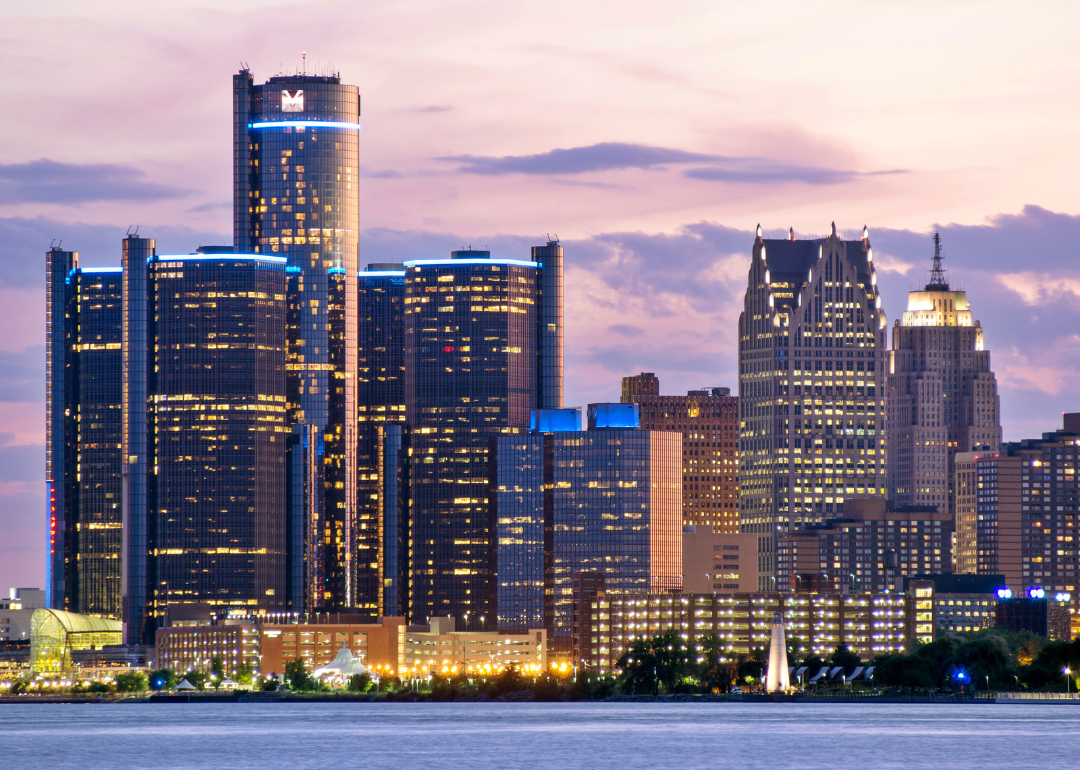
#2. Detroit
Downtown Detroit at sunset.
– Median time-to-crime from 2017 to 2021: 1.6 years
— Crime guns traced to known purchaser: 21,881 (83.9% of all crime guns)
— Average annual traced crime guns per 10k residents: 79.9
Canva
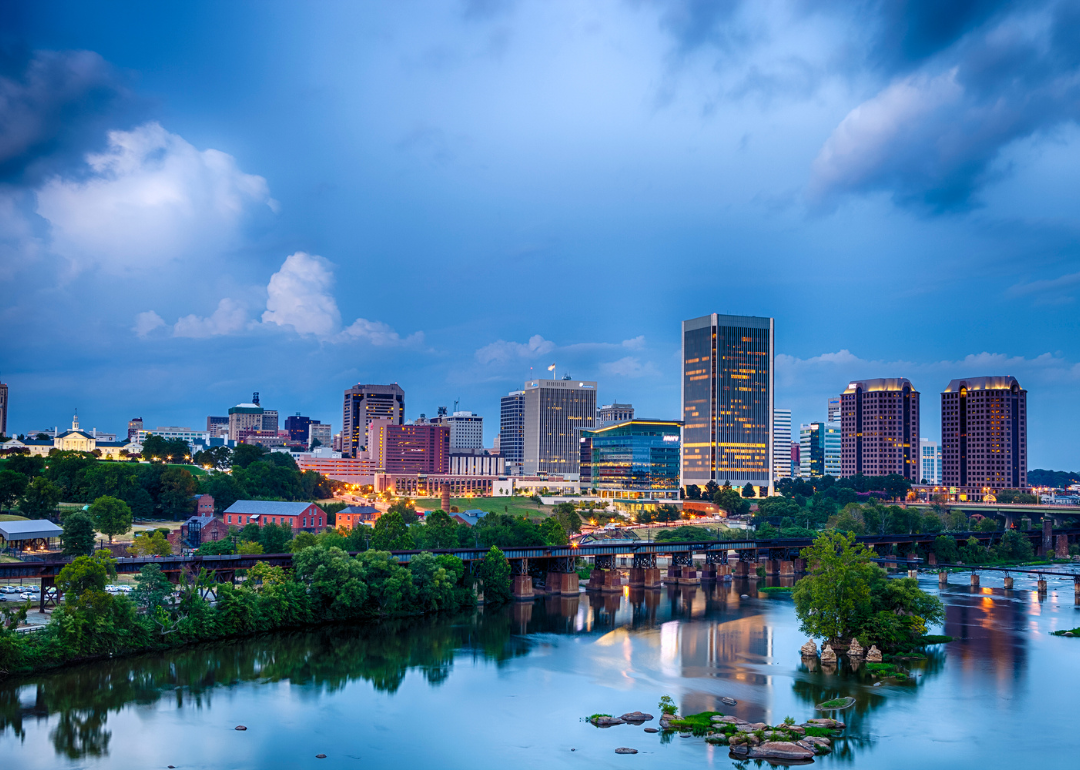
#1. Richmond, Virginia
Richmond’s skyline as viewed from afar.
– Median time-to-crime from 2017 to 2021: 1.5 years
— Crime guns traced to known purchaser: 5,764 (81.7% of all crime guns)
— Average annual traced crime guns per 10k residents: 62.2
You may also like: How to tell you’re being phished and 9 other common online scams to watch out for