Metros with the most unoccupied homes in America
Canva
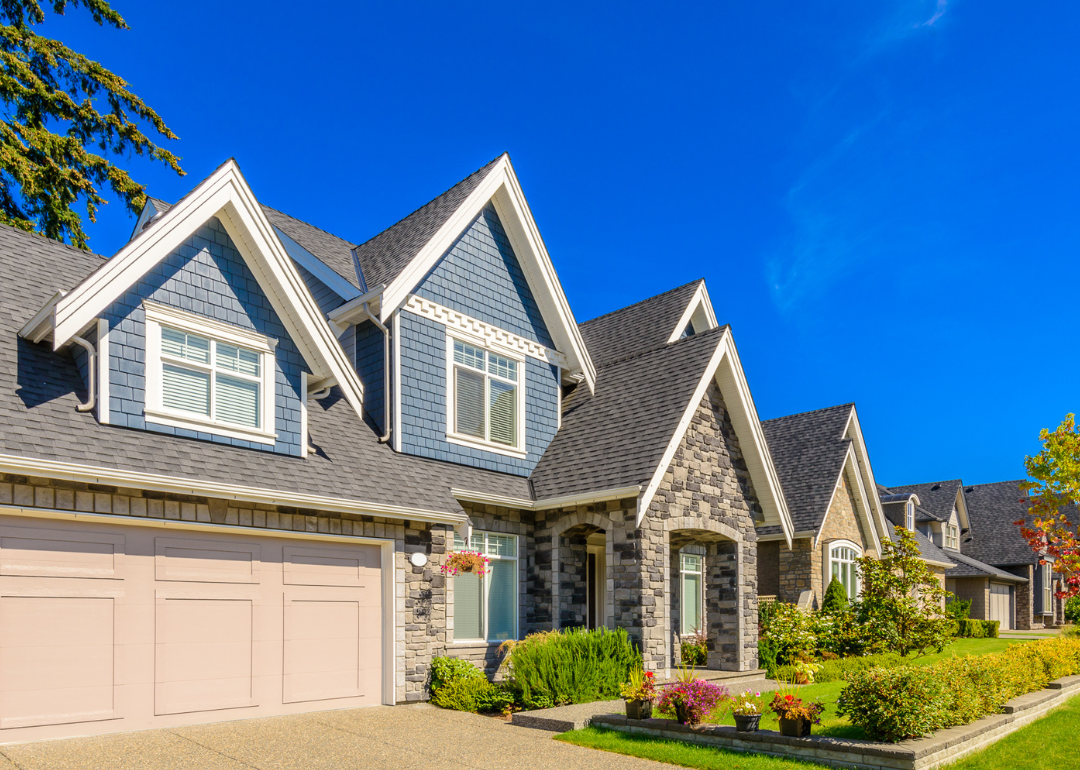
Metros with the most unoccupied homes in America
A row of newly built homes
There are many reasons why a community can wind up with too many houses and not enough people to live in them.
Sometimes, it’s a simple case of population loss or an economic downturn that leads to a rash of foreclosures. Other times, there are larger forces at work, like developers overbuilding in anticipation of a housing boom that never materializes. COVID-19 swiftly and drastically impacted the housing market across many regions, causing a shortage of affordable housing for most and an opportunity for second or even third homes for others.
Stacker compiled a list of the 50 metro areas with the most unoccupied homes by analyzing data from the Census Bureau’s 2021 American Community Survey, released in September 2022 (the most recent available). Metro areas are ranked by the percentage of unoccupied homes out of all the homes in each metro area. Ties were broken by the total number of unoccupied homes in the metro area as a whole.
In 22 of the 50 metros listed, more than 50% of unoccupied homes are for occasional, recreational, or seasonal use.
A nationwide epidemic of unoccupied homes is “America’s other housing crisis,” according to a CityLab report based on a recent Center for Community Progress study. The report cites the “staggering economic and social costs” that mass vacancies tend to create for the communities they affect. It also points out that the 2008 recession sent the number of vacant homes soaring by 26% between 2005 and 2010, from 9.5 million to 12 million. That number has since declined, but vacancies have still not returned to the pre-recession lows.
The dynamic has shifted since then. Vacant homes were long associated with economically distressed urban centers, often described with the umbrella term “inner city.” Today, however, vacancies are the bane of small towns. In post-recession America, rural areas suffer from vacancy rates that are double those found in metropolitan regions.
Keep reading to find out about the metro areas where residents are most likely to live next to an empty house and what factors contribute to the vacancies.
You may also like: Best places to live in the Midwest
![]()
S. Winkvist // Wikimedia Commons
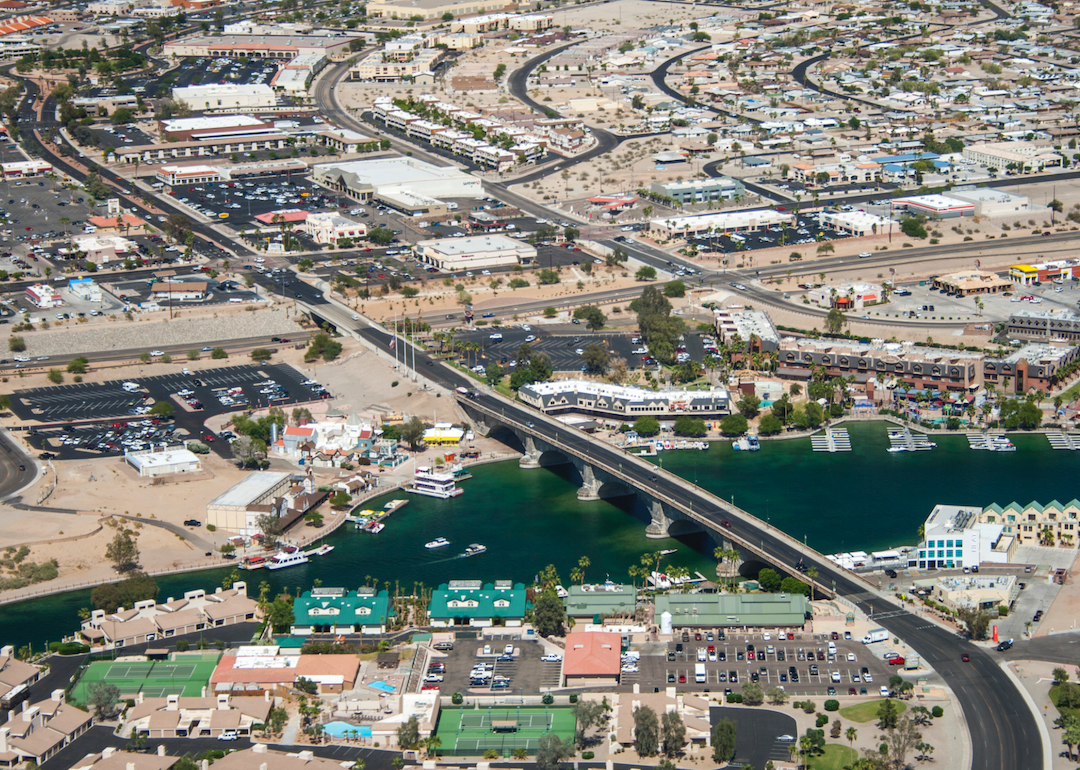
#50. Lake Havasu City, Arizona
Aerial view of Lake Havasu.
– Total homes in metro area: 119,446
– Total unoccupied homes: 17,048 (14.3% of total)
— Homes for rent: 137 (0.1% of total)
— Homes rented but not occupied: 7 (0.0% of unoccupied homes)
— Homes for sale: 905 (0.8% of total)
— Homes sold, but not occupied: 977 (5.7% of unoccupied homes)
— Homes for occasional, recreational, or seasonal use: 11,787 (69.1% of unoccupied homes)
— Homes for migrant workers: 6 (0.0% of unoccupied homes)
— Other vacant homes: 3,229 (18.9% of unoccupied homes)
Nick Fox // Shutterstock
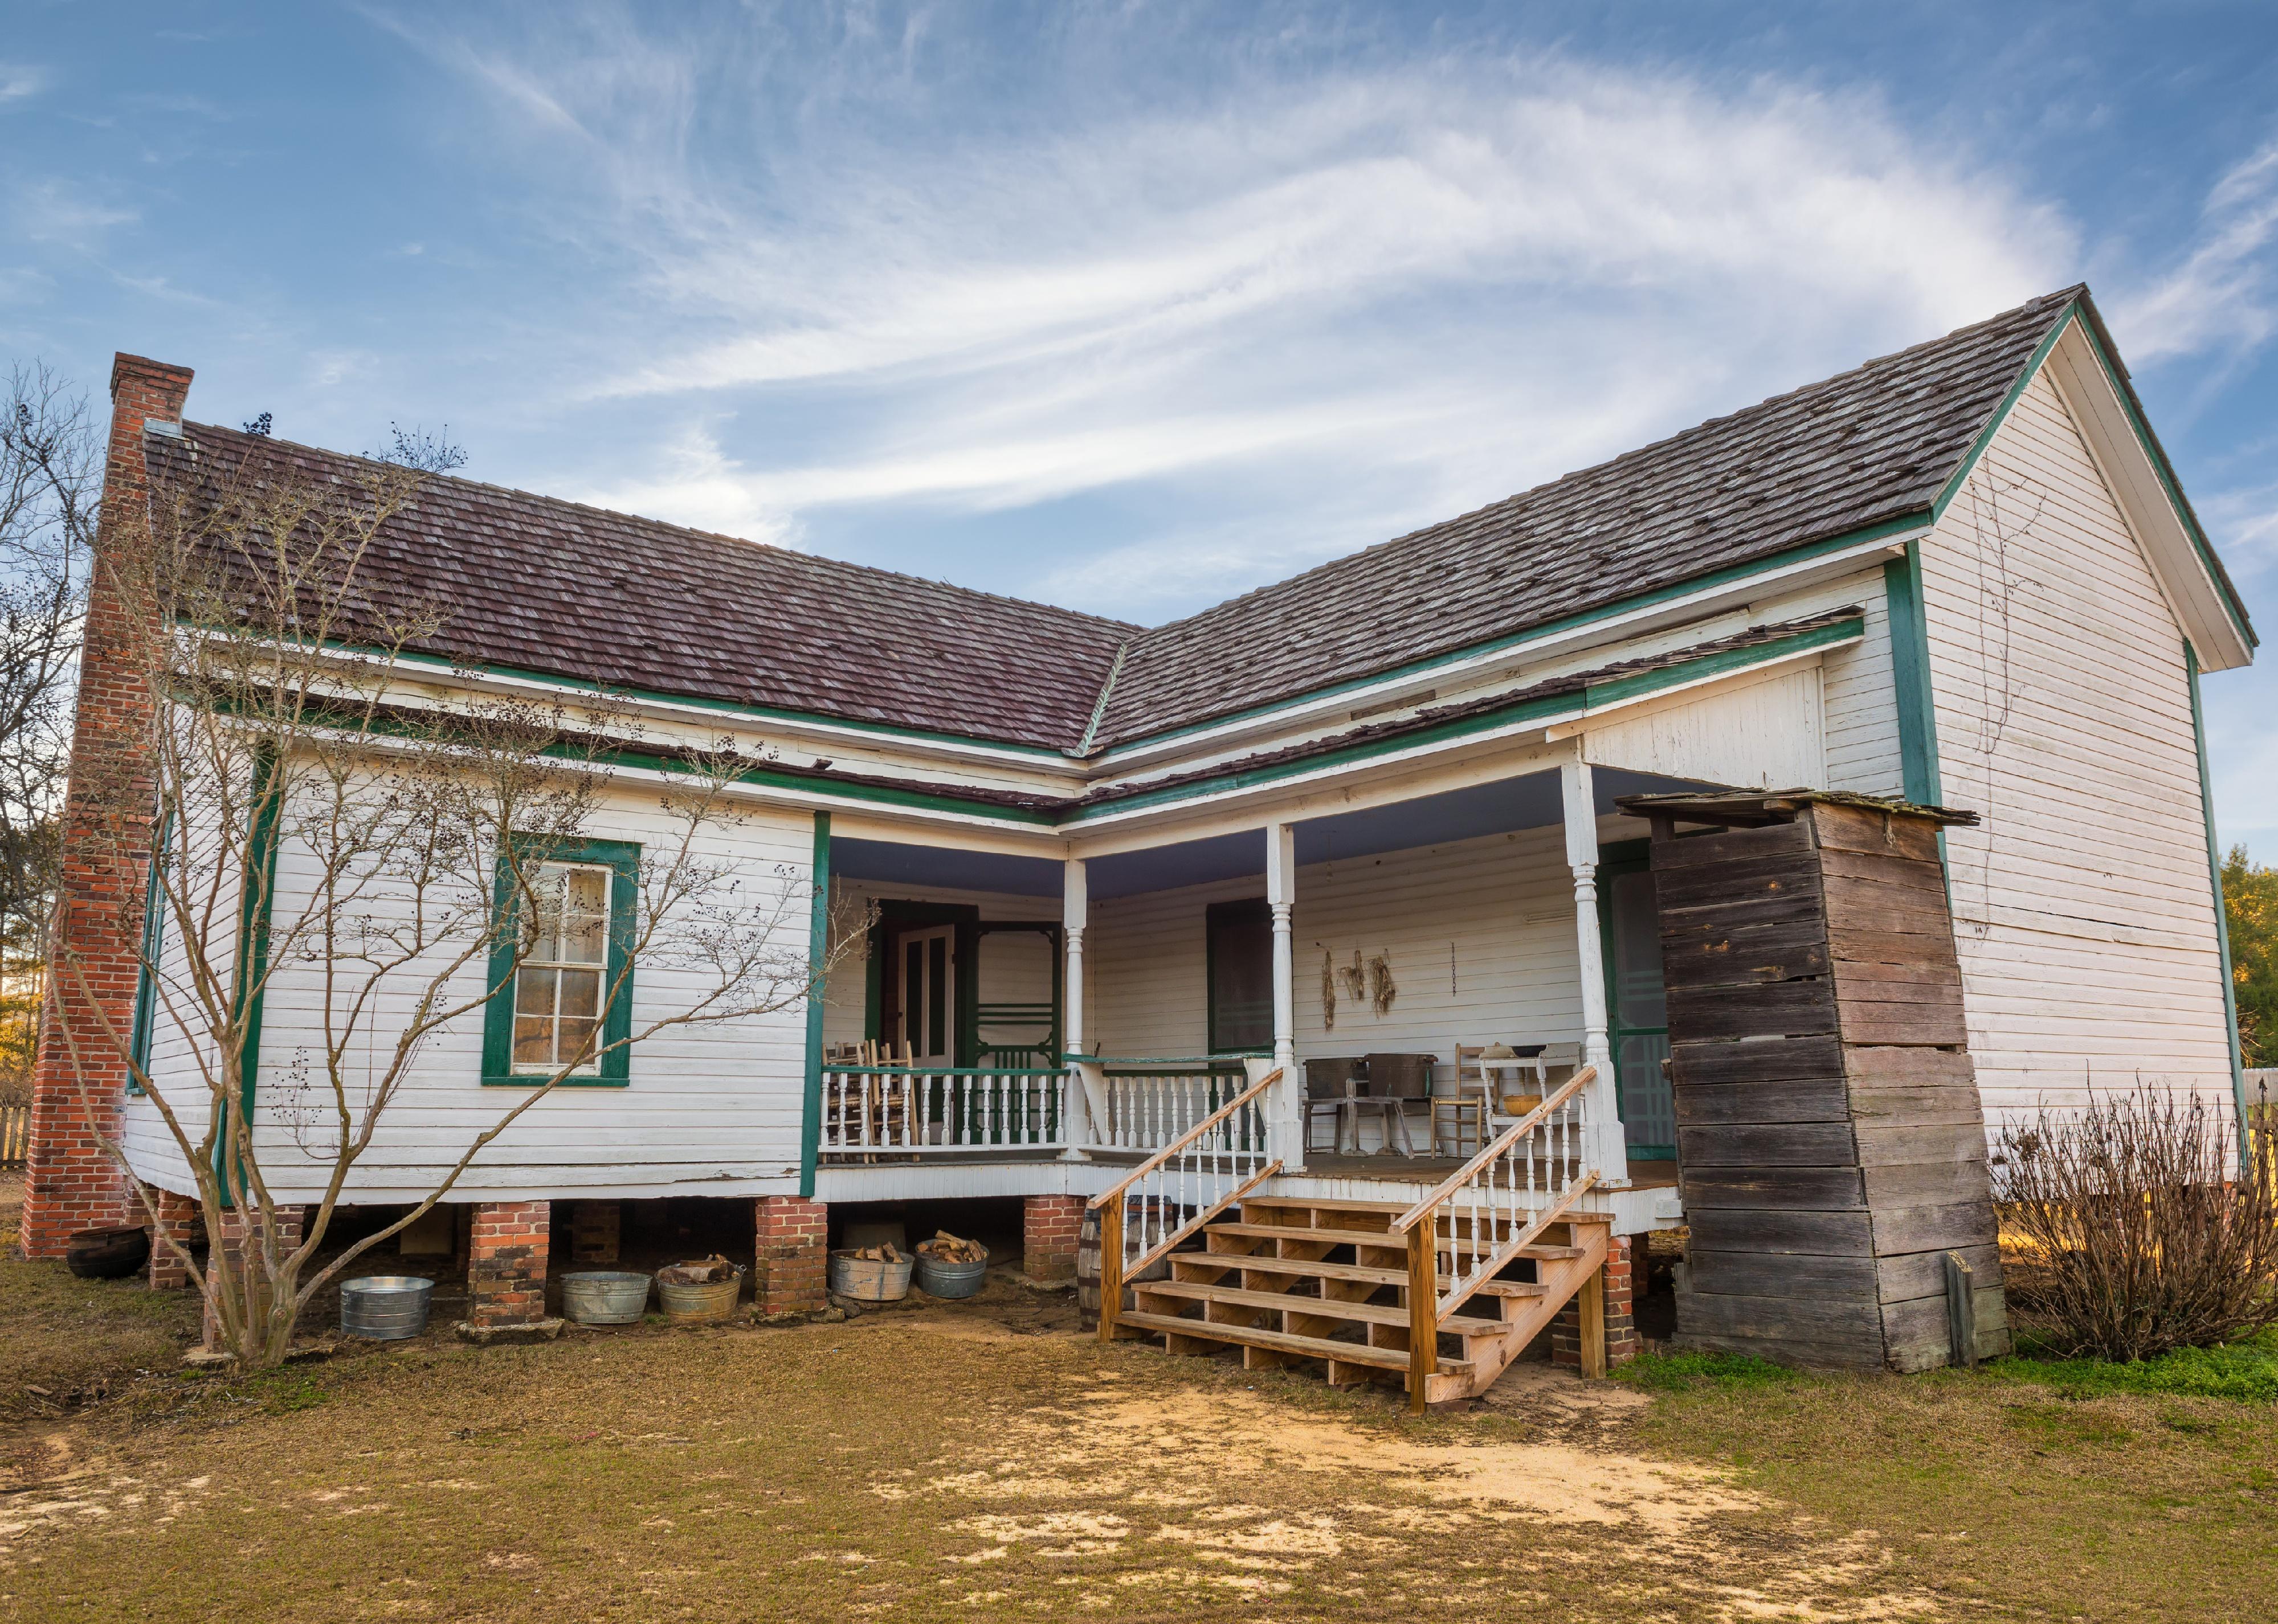
#49. Dothan, Alabama
Old farmhouse in the historic landmark park near Dothan, Alabama.
– Total homes in metro area: 71,409
– Total unoccupied homes: 10,236 (14.3% of total)
— Homes for rent: 1,060 (1.5% of total)
— Homes rented but not occupied: 192 (1.9% of unoccupied homes)
— Homes for sale: 989 (1.4% of total)
— Homes sold, but not occupied: 413 (4.0% of unoccupied homes)
— Homes for occasional, recreational, or seasonal use: 983 (9.6% of unoccupied homes)
— Homes for migrant workers: 0 (0.0% of unoccupied homes)
— Other vacant homes: 6,599 (64.5% of unoccupied homes)
Felix Mizioznikov // Shutterstock
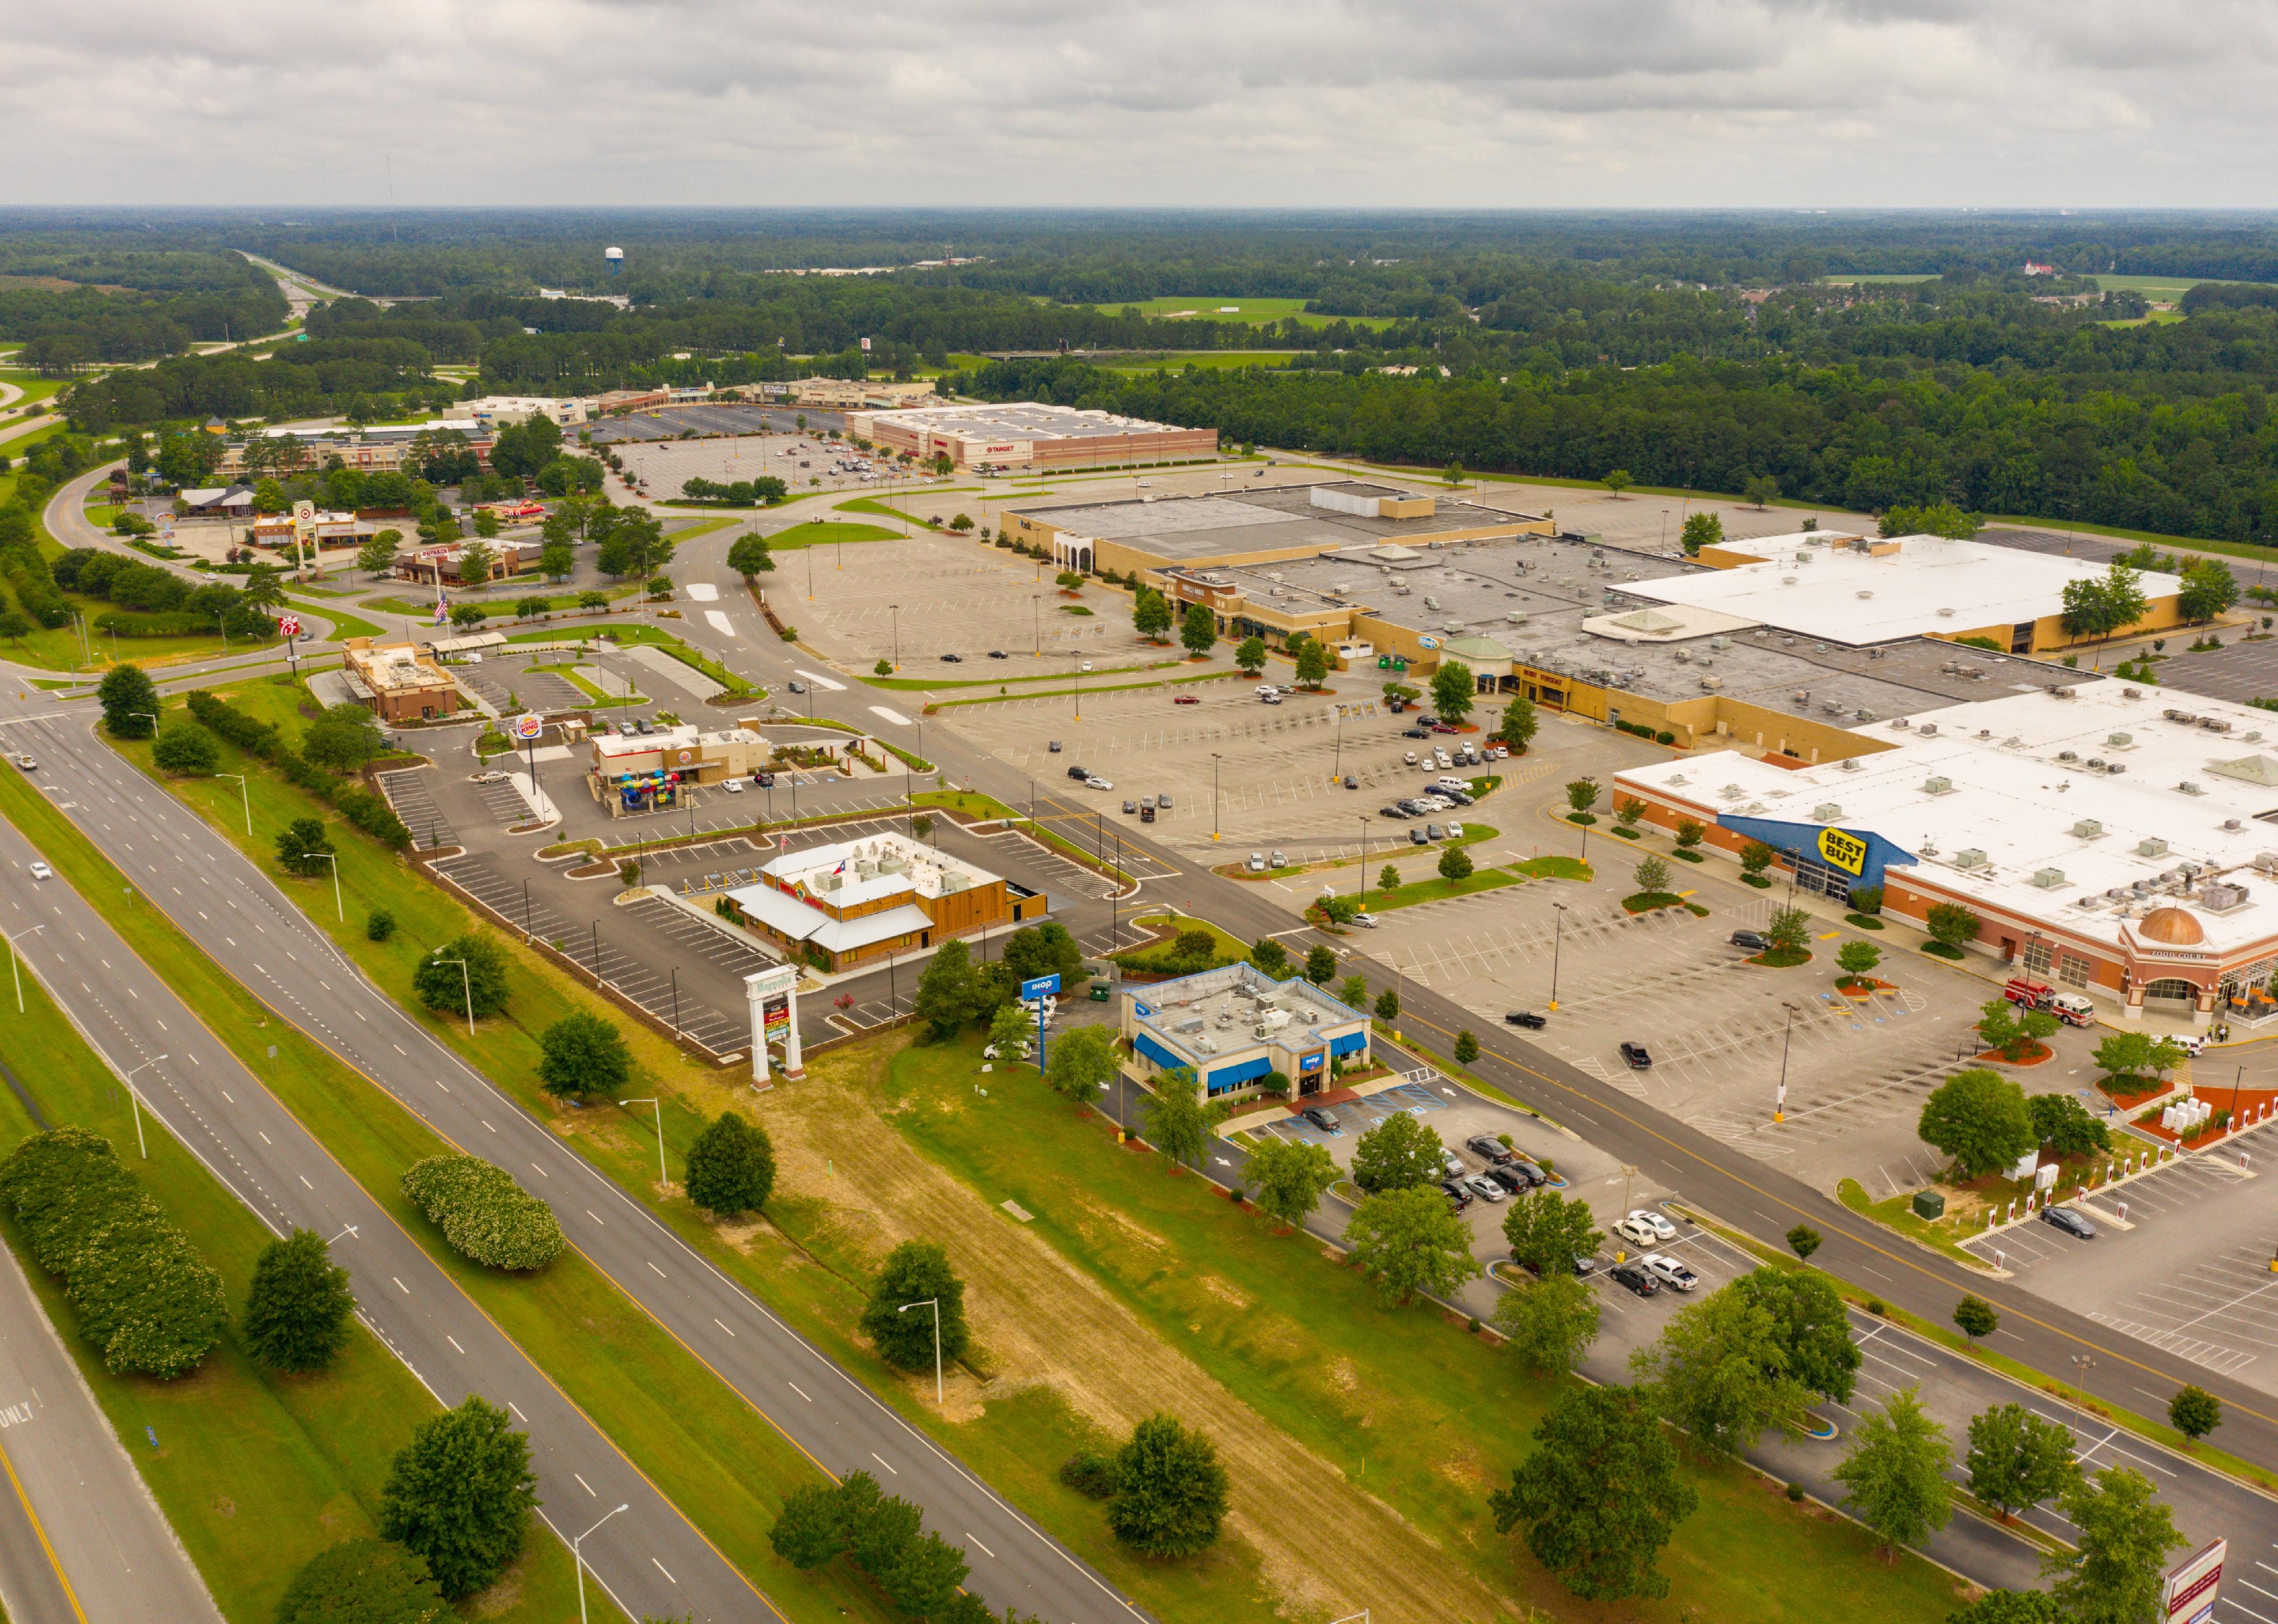
#48. Florence, South Carolina
Aerial photo Magnolia Mall in Florence.
– Total homes in metro area: 91,081
– Total unoccupied homes: 13,163 (14.5% of total)
— Homes for rent: 2,056 (2.3% of total)
— Homes rented but not occupied: 408 (3.1% of unoccupied homes)
— Homes for sale: 901 (1.0% of total)
— Homes sold, but not occupied: 196 (1.5% of unoccupied homes)
— Homes for occasional, recreational, or seasonal use: 347 (2.6% of unoccupied homes)
— Homes for migrant workers: 130 (1.0% of unoccupied homes)
— Other vacant homes: 9,125 (69.3% of unoccupied homes)

Susanne Pommer // Shutterstock
#47. Charleston, South Carolina
St. Michaels Church and Broad St. in Charleston.
– Total homes in metro area: 370,105
– Total unoccupied homes: 53,727 (14.5% of total)
— Homes for rent: 16,890 (4.6% of total)
— Homes rented but not occupied: 1,094 (2.0% of unoccupied homes)
— Homes for sale: 4,319 (1.2% of total)
— Homes sold, but not occupied: 2,440 (4.5% of unoccupied homes)
— Homes for occasional, recreational, or seasonal use: 14,764 (27.5% of unoccupied homes)
— Homes for migrant workers: 136 (0.3% of unoccupied homes)
— Other vacant homes: 14,084 (26.2% of unoccupied homes)
Felix Mizioznikov // Shutterstock
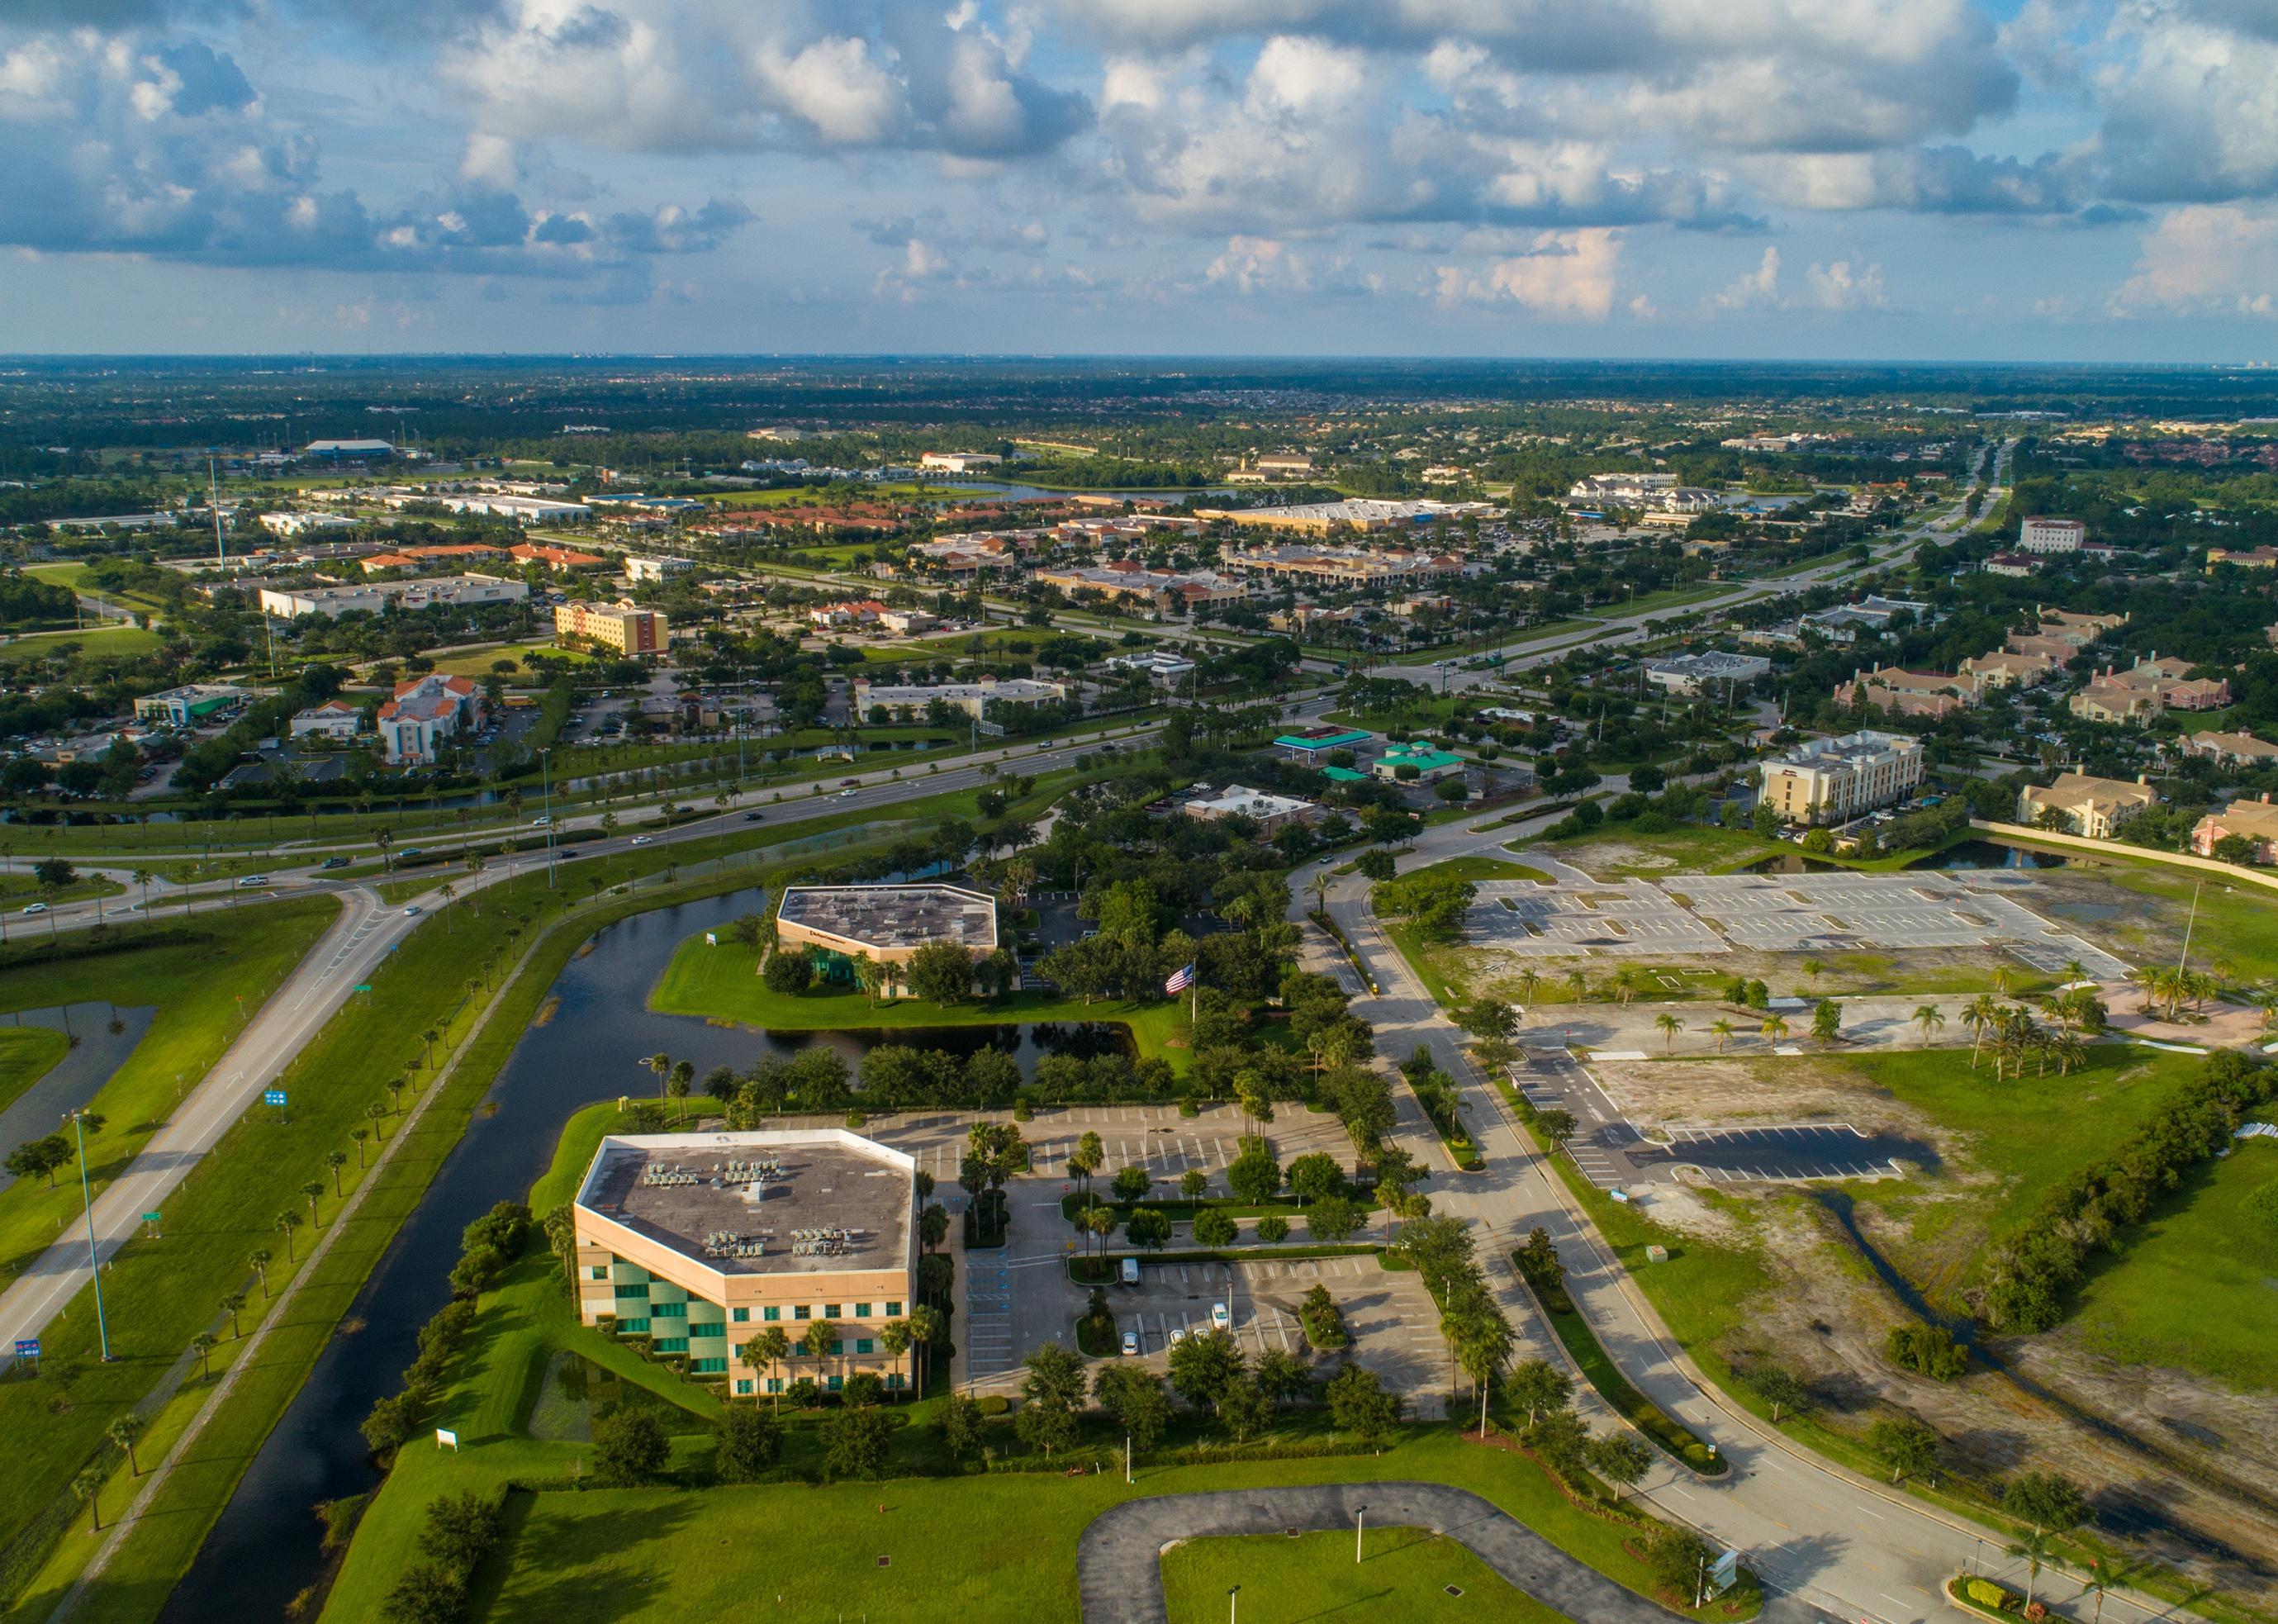
#46. Port St. Lucie, Florida
Aerial drone image of Port St Lucie.
– Total homes in metro area: 235,345
– Total unoccupied homes: 34,391 (14.6% of total)
— Homes for rent: 3,236 (1.4% of total)
— Homes rented but not occupied: 486 (1.4% of unoccupied homes)
— Homes for sale: 2,515 (1.1% of total)
— Homes sold, but not occupied: 1,655 (4.8% of unoccupied homes)
— Homes for occasional, recreational, or seasonal use: 24,128 (70.2% of unoccupied homes)
— Homes for migrant workers: 0 (0.0% of unoccupied homes)
— Other vacant homes: 2,371 (6.9% of unoccupied homes)
Logan Bush // Shutterstock
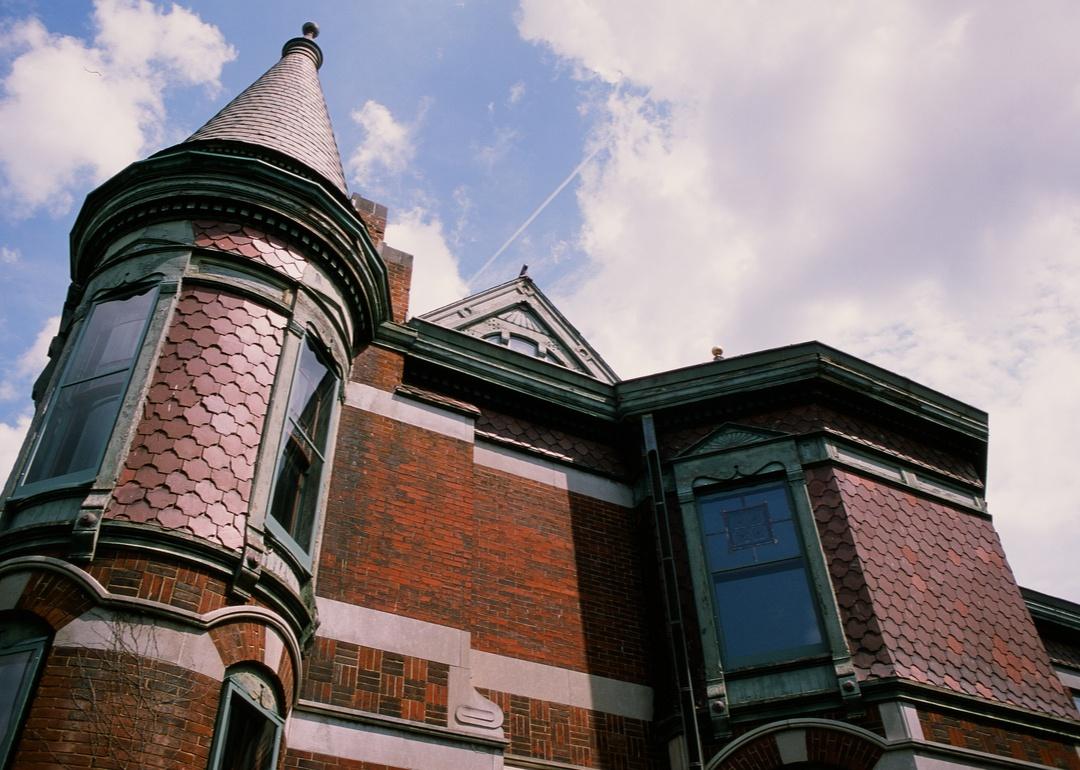
#45. Niles, Michigan
An old-style, red brick home under a blue sky.
– Total homes in metro area: 77,035
– Total unoccupied homes: 11,271 (14.6% of total)
— Homes for rent: 351 (0.5% of total)
— Homes rented but not occupied: 0 (0.0% of unoccupied homes)
— Homes for sale: 251 (0.3% of total)
— Homes sold, but not occupied: 452 (4.0% of unoccupied homes)
— Homes for occasional, recreational, or seasonal use: 7,386 (65.5% of unoccupied homes)
— Homes for migrant workers: 100 (0.9% of unoccupied homes)
— Other vacant homes: 2,731 (24.2% of unoccupied homes)
gurezende // Shutterstock
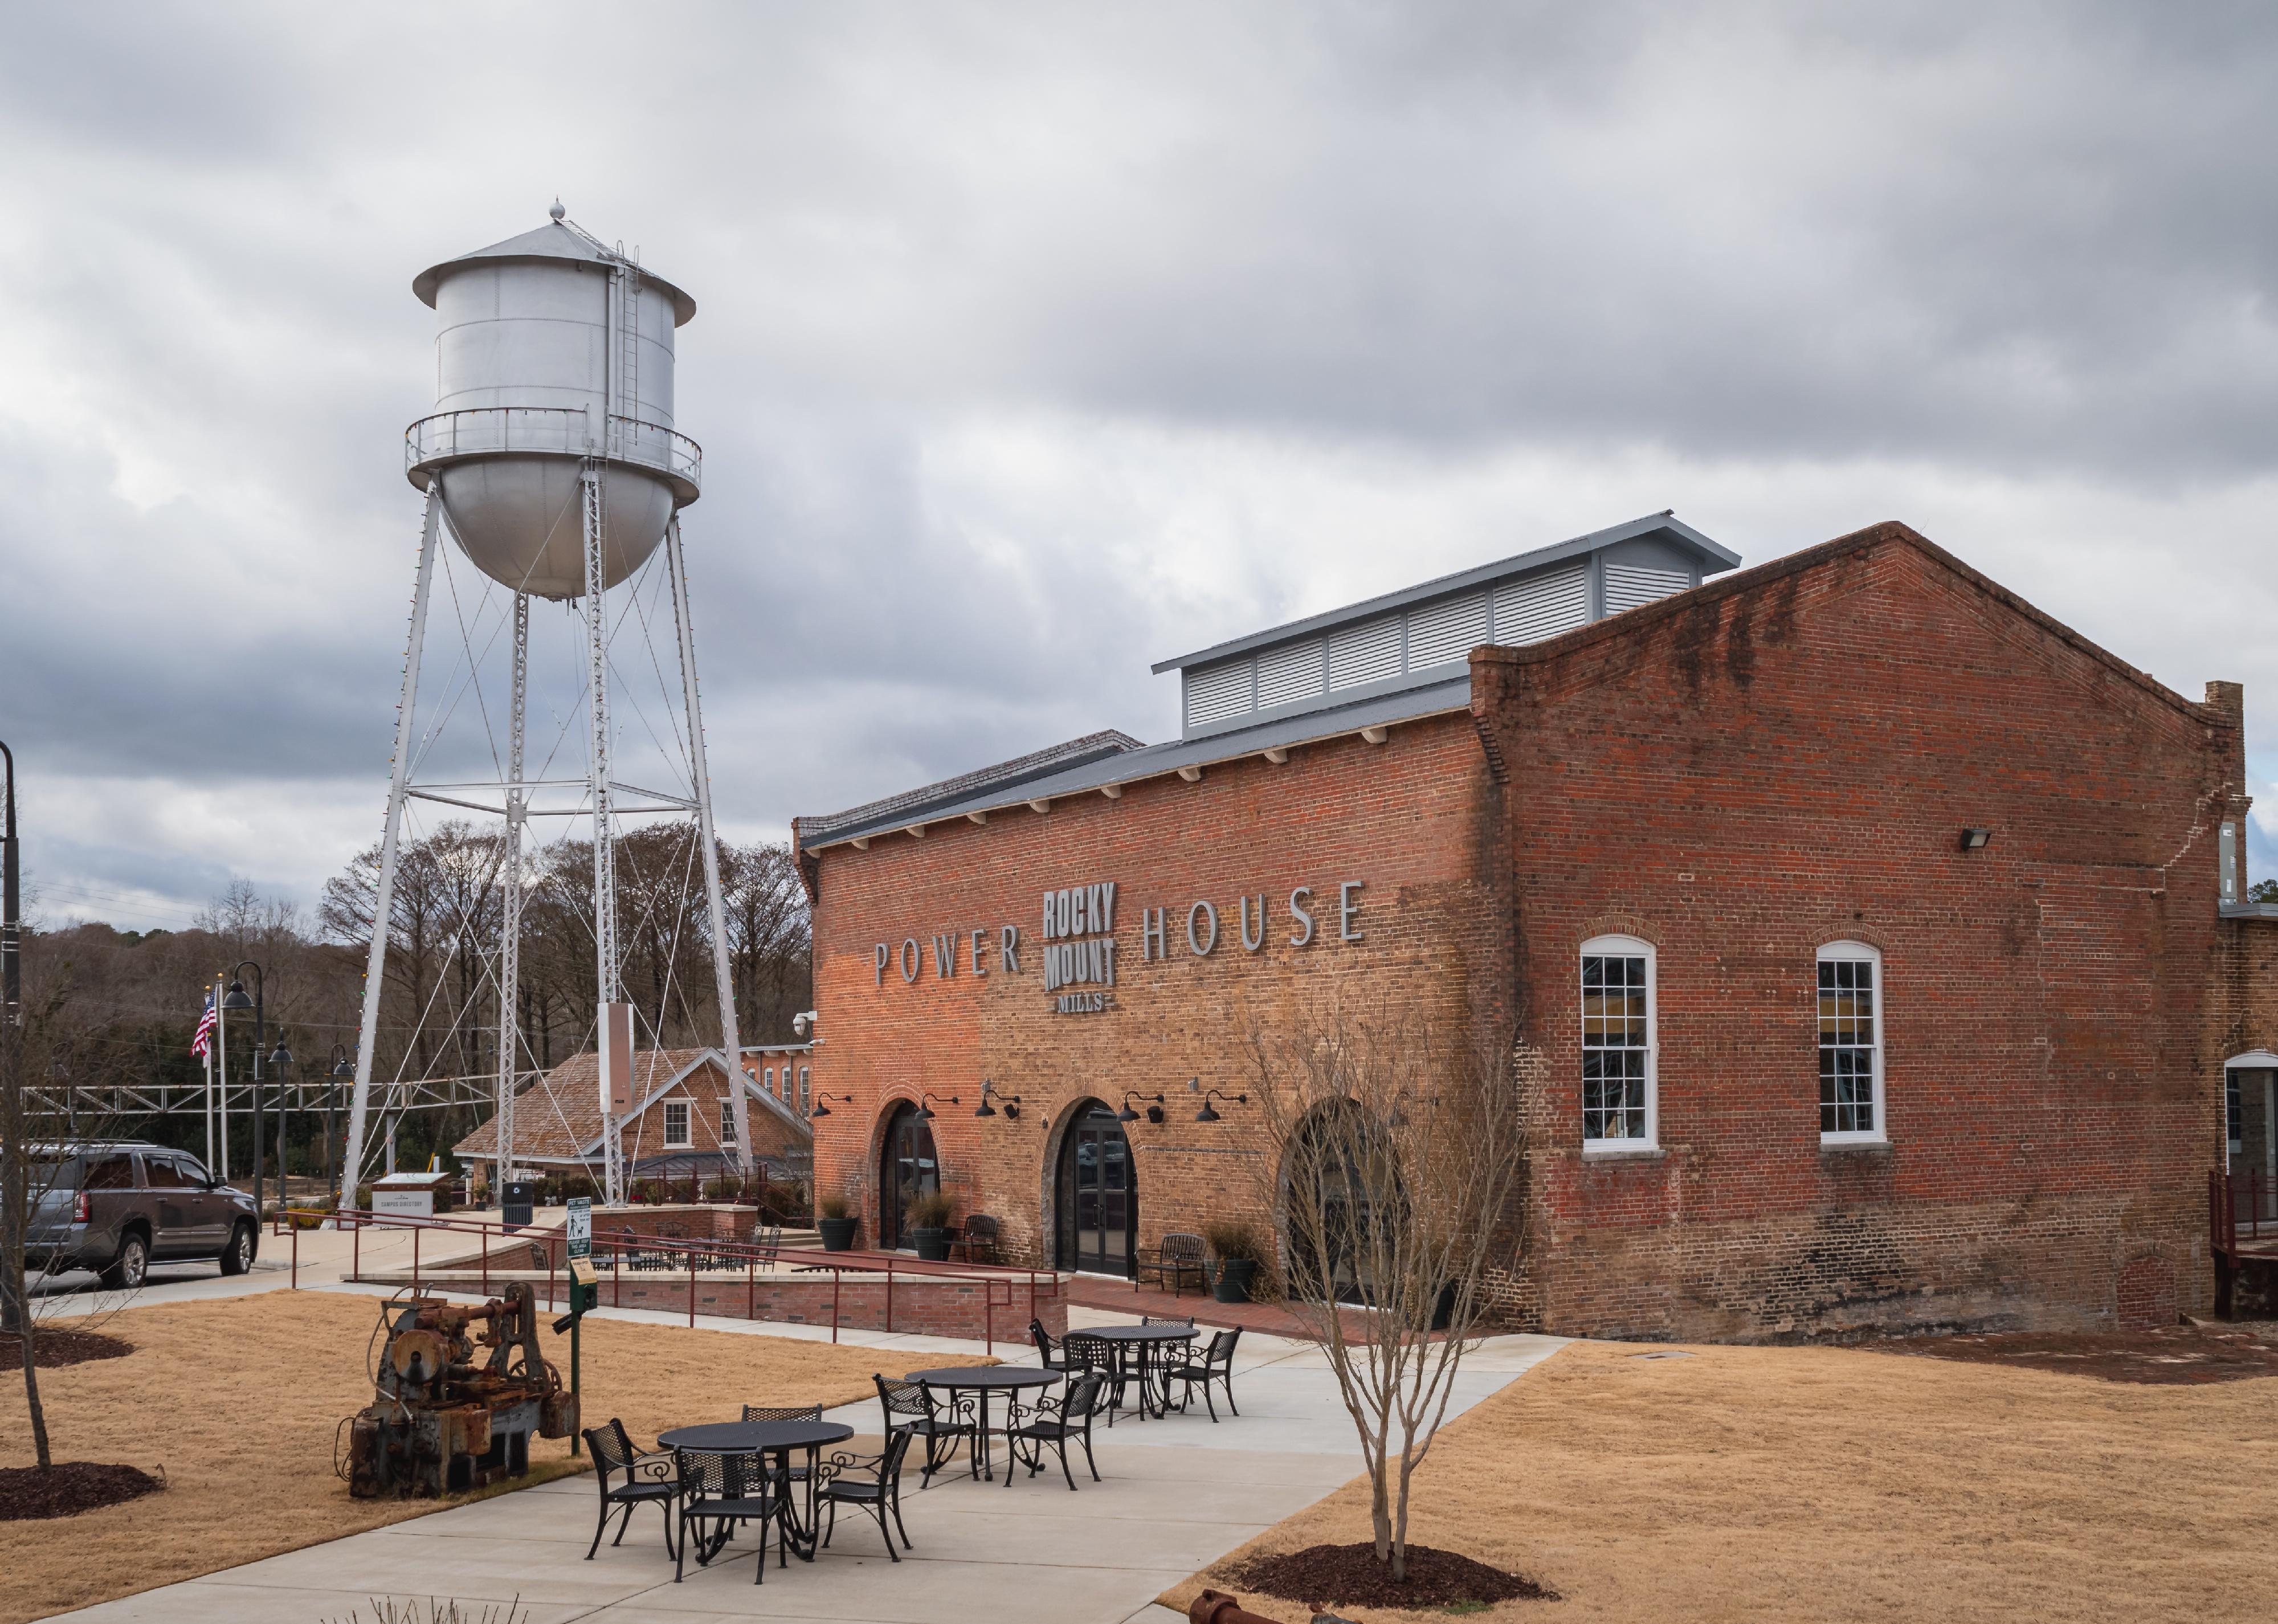
#44. Rocky Mount, North Carolina
Rocky Mount Mills in North Carolina.
– Total homes in metro area: 66,587
– Total unoccupied homes: 9,747 (14.6% of total)
— Homes for rent: 454 (0.7% of total)
— Homes rented but not occupied: 128 (1.3% of unoccupied homes)
— Homes for sale: 448 (0.7% of total)
— Homes sold, but not occupied: 271 (2.8% of unoccupied homes)
— Homes for occasional, recreational, or seasonal use: 562 (5.8% of unoccupied homes)
— Homes for migrant workers: 0 (0.0% of unoccupied homes)
— Other vacant homes: 7,884 (80.9% of unoccupied homes)
Shoppy22 // Shutterstock
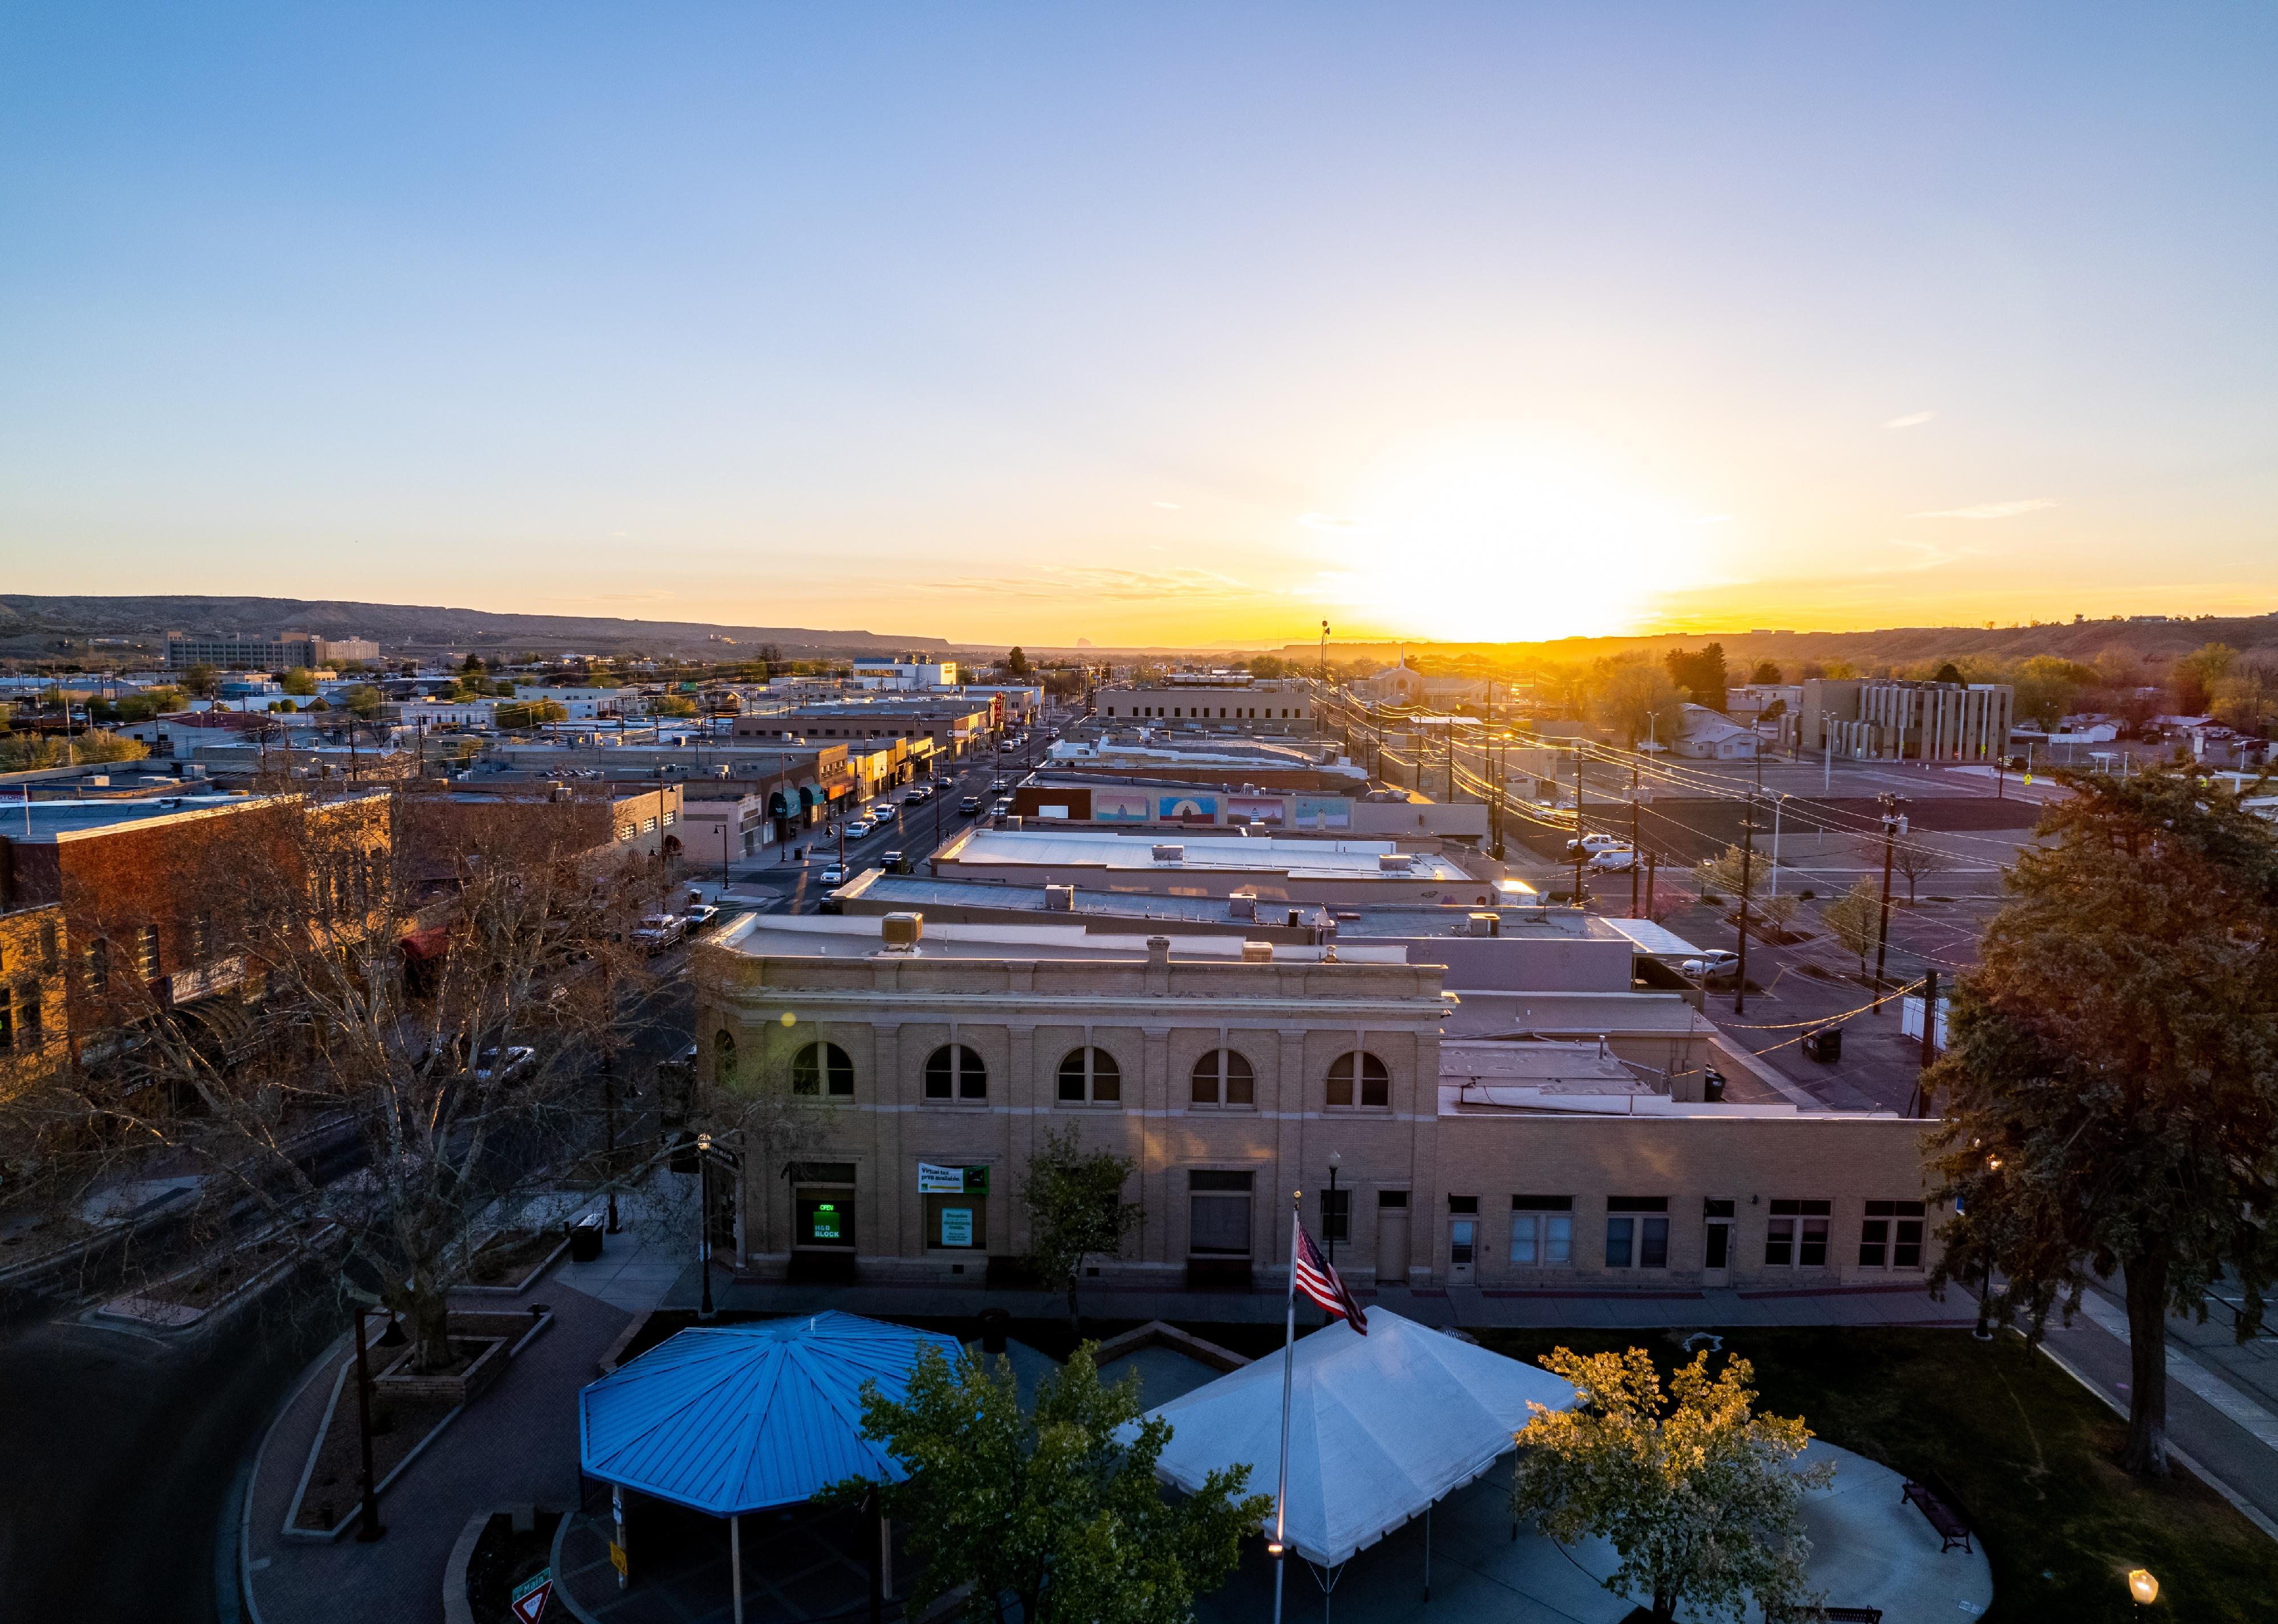
#43. Farmington, New Mexico
Downtown sunset of Farmington.
– Total homes in metro area: 47,980
– Total unoccupied homes: 7,136 (14.9% of total)
— Homes for rent: 675 (1.4% of total)
— Homes rented but not occupied: 23 (0.3% of unoccupied homes)
— Homes for sale: 635 (1.3% of total)
— Homes sold, but not occupied: 0 (0.0% of unoccupied homes)
— Homes for occasional, recreational, or seasonal use: 1,275 (17.9% of unoccupied homes)
— Homes for migrant workers: 27 (0.4% of unoccupied homes)
— Other vacant homes: 4,501 (63.1% of unoccupied homes)
Jarred Armfield // Shutterstock
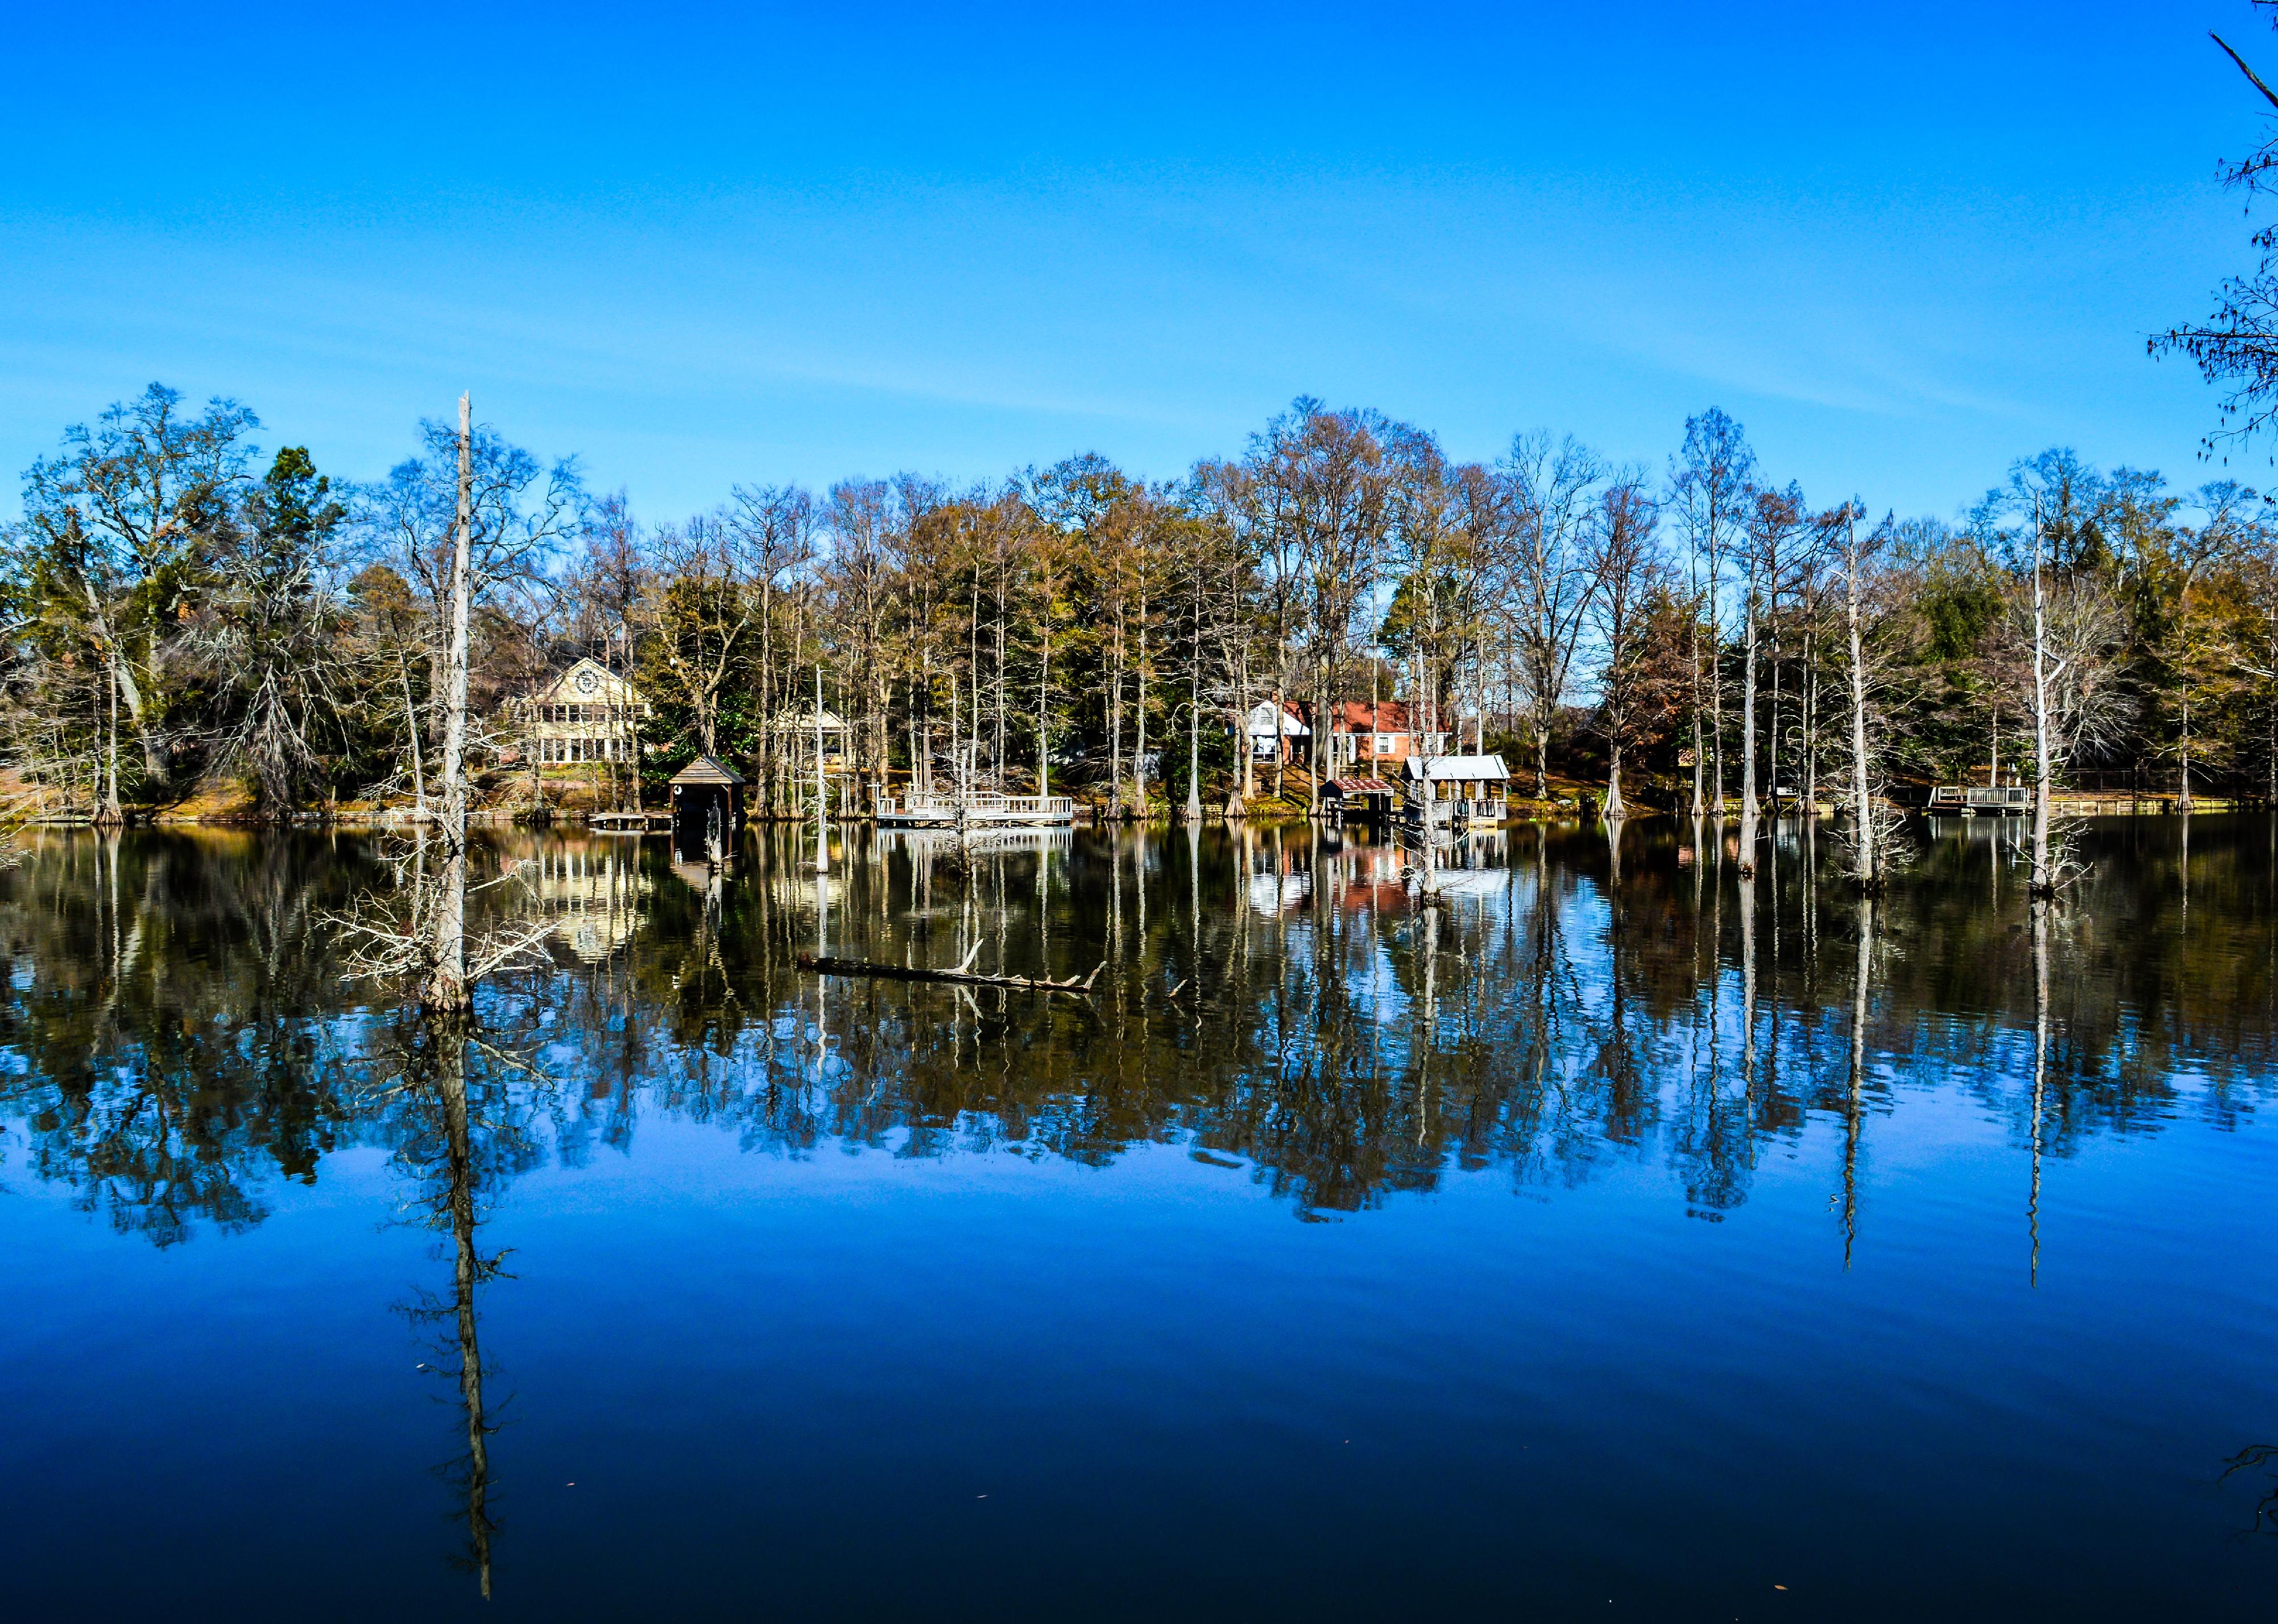
#42. Monroe, Louisiana
Ouachita River in Monroe.
– Total homes in metro area: 94,433
– Total unoccupied homes: 14,099 (14.9% of total)
— Homes for rent: 1,835 (1.9% of total)
— Homes rented but not occupied: 481 (3.4% of unoccupied homes)
— Homes for sale: 326 (0.3% of total)
— Homes sold, but not occupied: 431 (3.1% of unoccupied homes)
— Homes for occasional, recreational, or seasonal use: 1,141 (8.1% of unoccupied homes)
— Homes for migrant workers: 0 (0.0% of unoccupied homes)
— Other vacant homes: 9,885 (70.1% of unoccupied homes)
Real Window Creative // Shutterstock
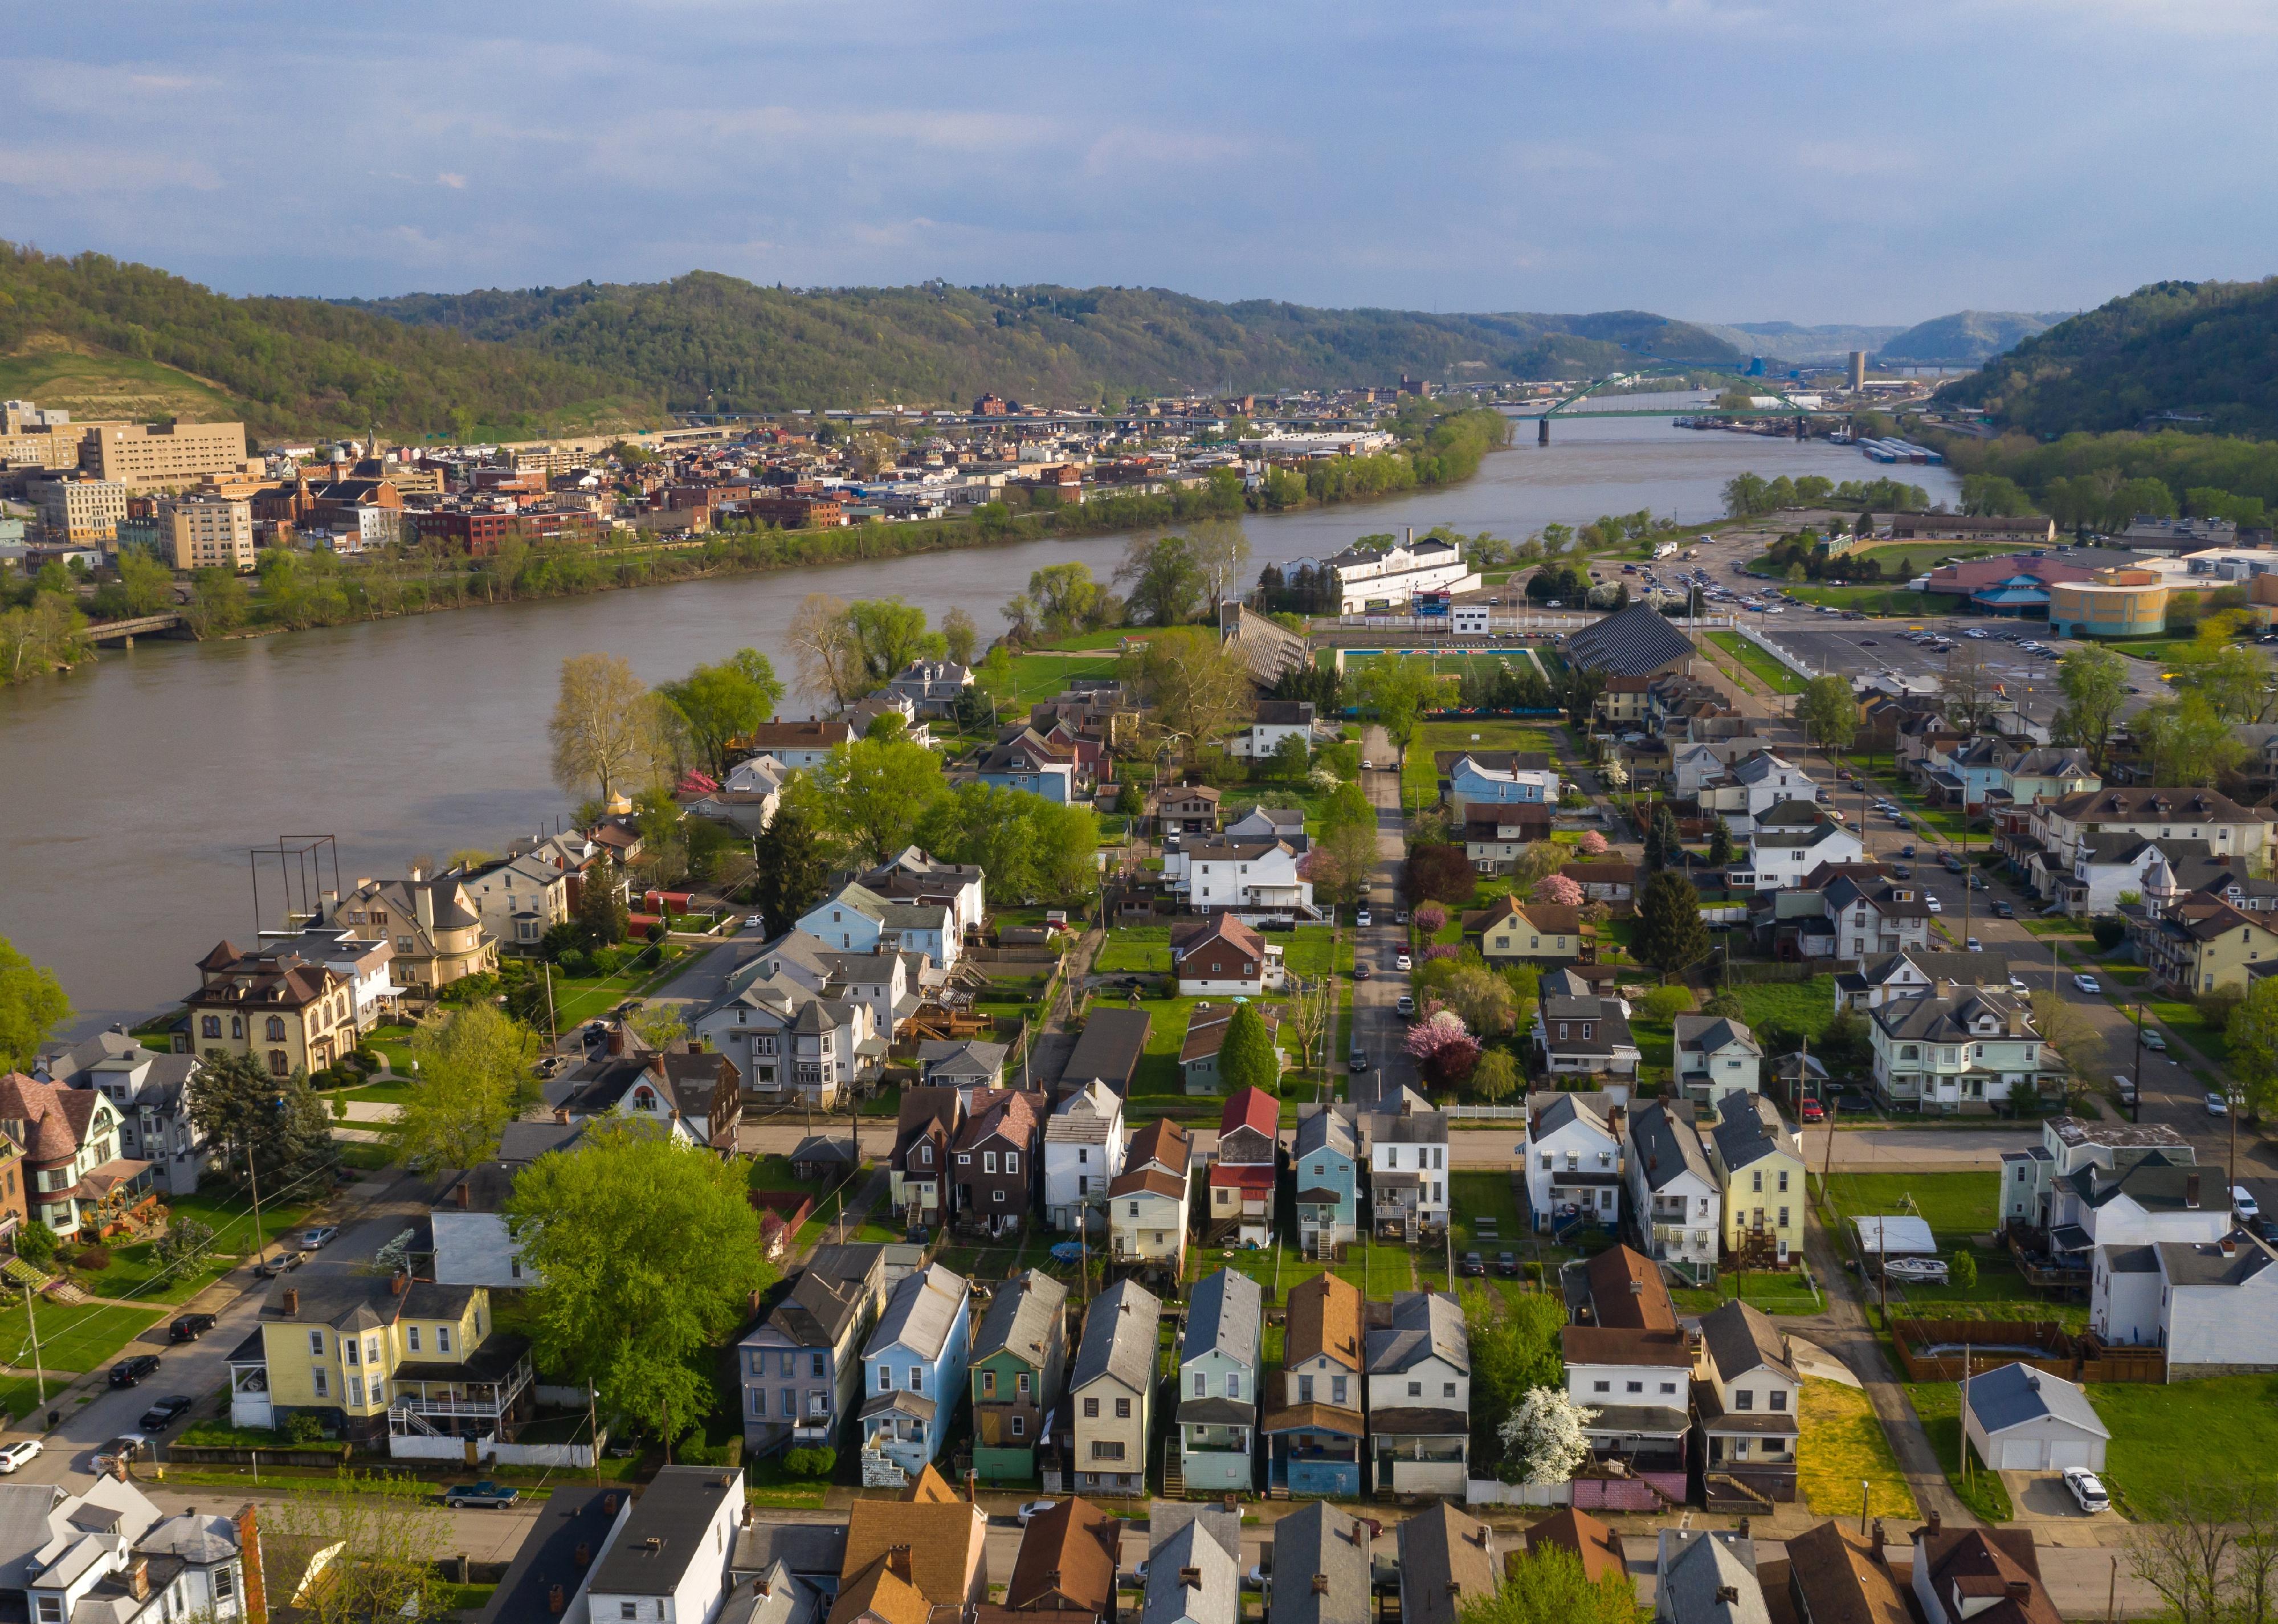
#41. Wheeling, West Virginia
Structures dot the landscape of Wheeling Island in West Virgina.
– Total homes in metro area: 67,417
– Total unoccupied homes: 10,085 (15.0% of total)
— Homes for rent: 1,898 (2.8% of total)
— Homes rented but not occupied: 295 (2.9% of unoccupied homes)
— Homes for sale: 378 (0.6% of total)
— Homes sold, but not occupied: 340 (3.4% of unoccupied homes)
— Homes for occasional, recreational, or seasonal use: 1,094 (10.8% of unoccupied homes)
— Homes for migrant workers: 69 (0.7% of unoccupied homes)
— Other vacant homes: 6,011 (59.6% of unoccupied homes)
Jessica Kourkounis // Getty Images
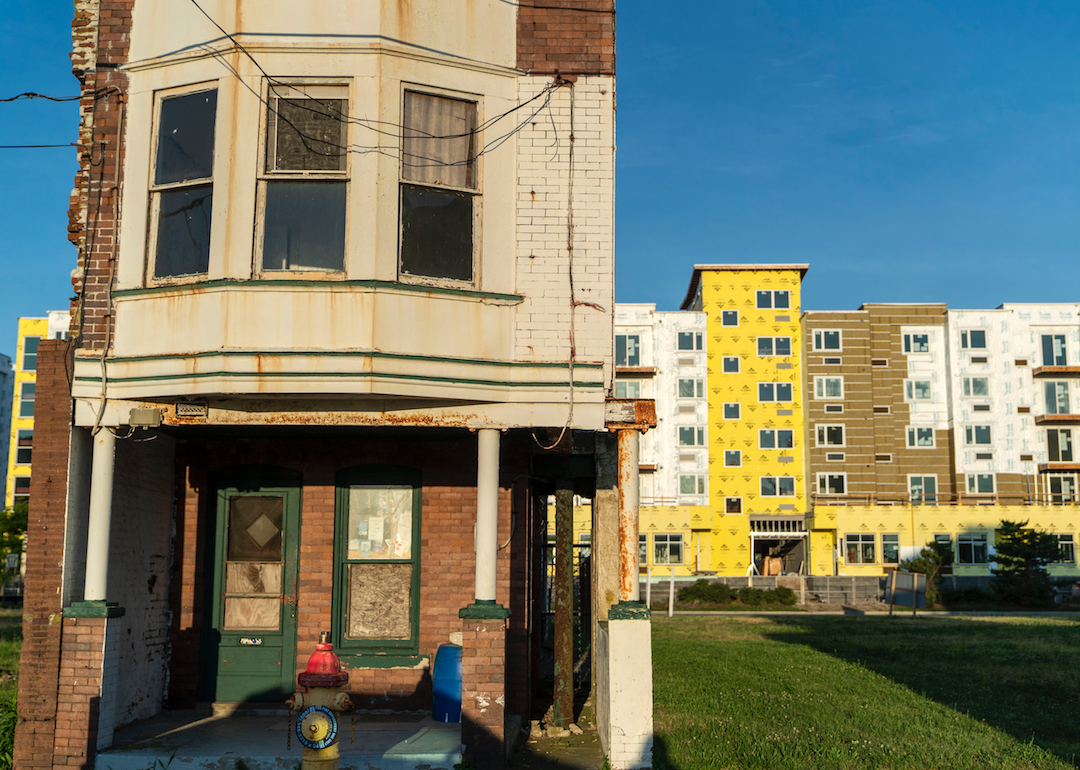
#40. Atlantic City, New Jersey
An abandoned house in Atlantic City.
– Total homes in metro area: 132,214
– Total unoccupied homes: 19,915 (15.1% of total)
— Homes for rent: 731 (0.6% of total)
— Homes rented but not occupied: 0 (0.0% of unoccupied homes)
— Homes for sale: 1,051 (0.8% of total)
— Homes sold, but not occupied: 690 (3.5% of unoccupied homes)
— Homes for occasional, recreational, or seasonal use: 15,213 (76.4% of unoccupied homes)
— Homes for migrant workers: 0 (0.0% of unoccupied homes)
— Other vacant homes: 2,230 (11.2% of unoccupied homes)

YuniqueB // Shutterstock
#39. Lawton, Oklahoma
Medicine Park in Lawton.
– Total homes in metro area: 55,351
– Total unoccupied homes: 8,435 (15.2% of total)
— Homes for rent: 1,427 (2.6% of total)
— Homes rented but not occupied: 622 (7.4% of unoccupied homes)
— Homes for sale: 429 (0.8% of total)
— Homes sold, but not occupied: 559 (6.6% of unoccupied homes)
— Homes for occasional, recreational, or seasonal use: 391 (4.6% of unoccupied homes)
— Homes for migrant workers: 0 (0.0% of unoccupied homes)
— Other vacant homes: 5,007 (59.4% of unoccupied homes)
Explorecdale // Wikimedia Commons
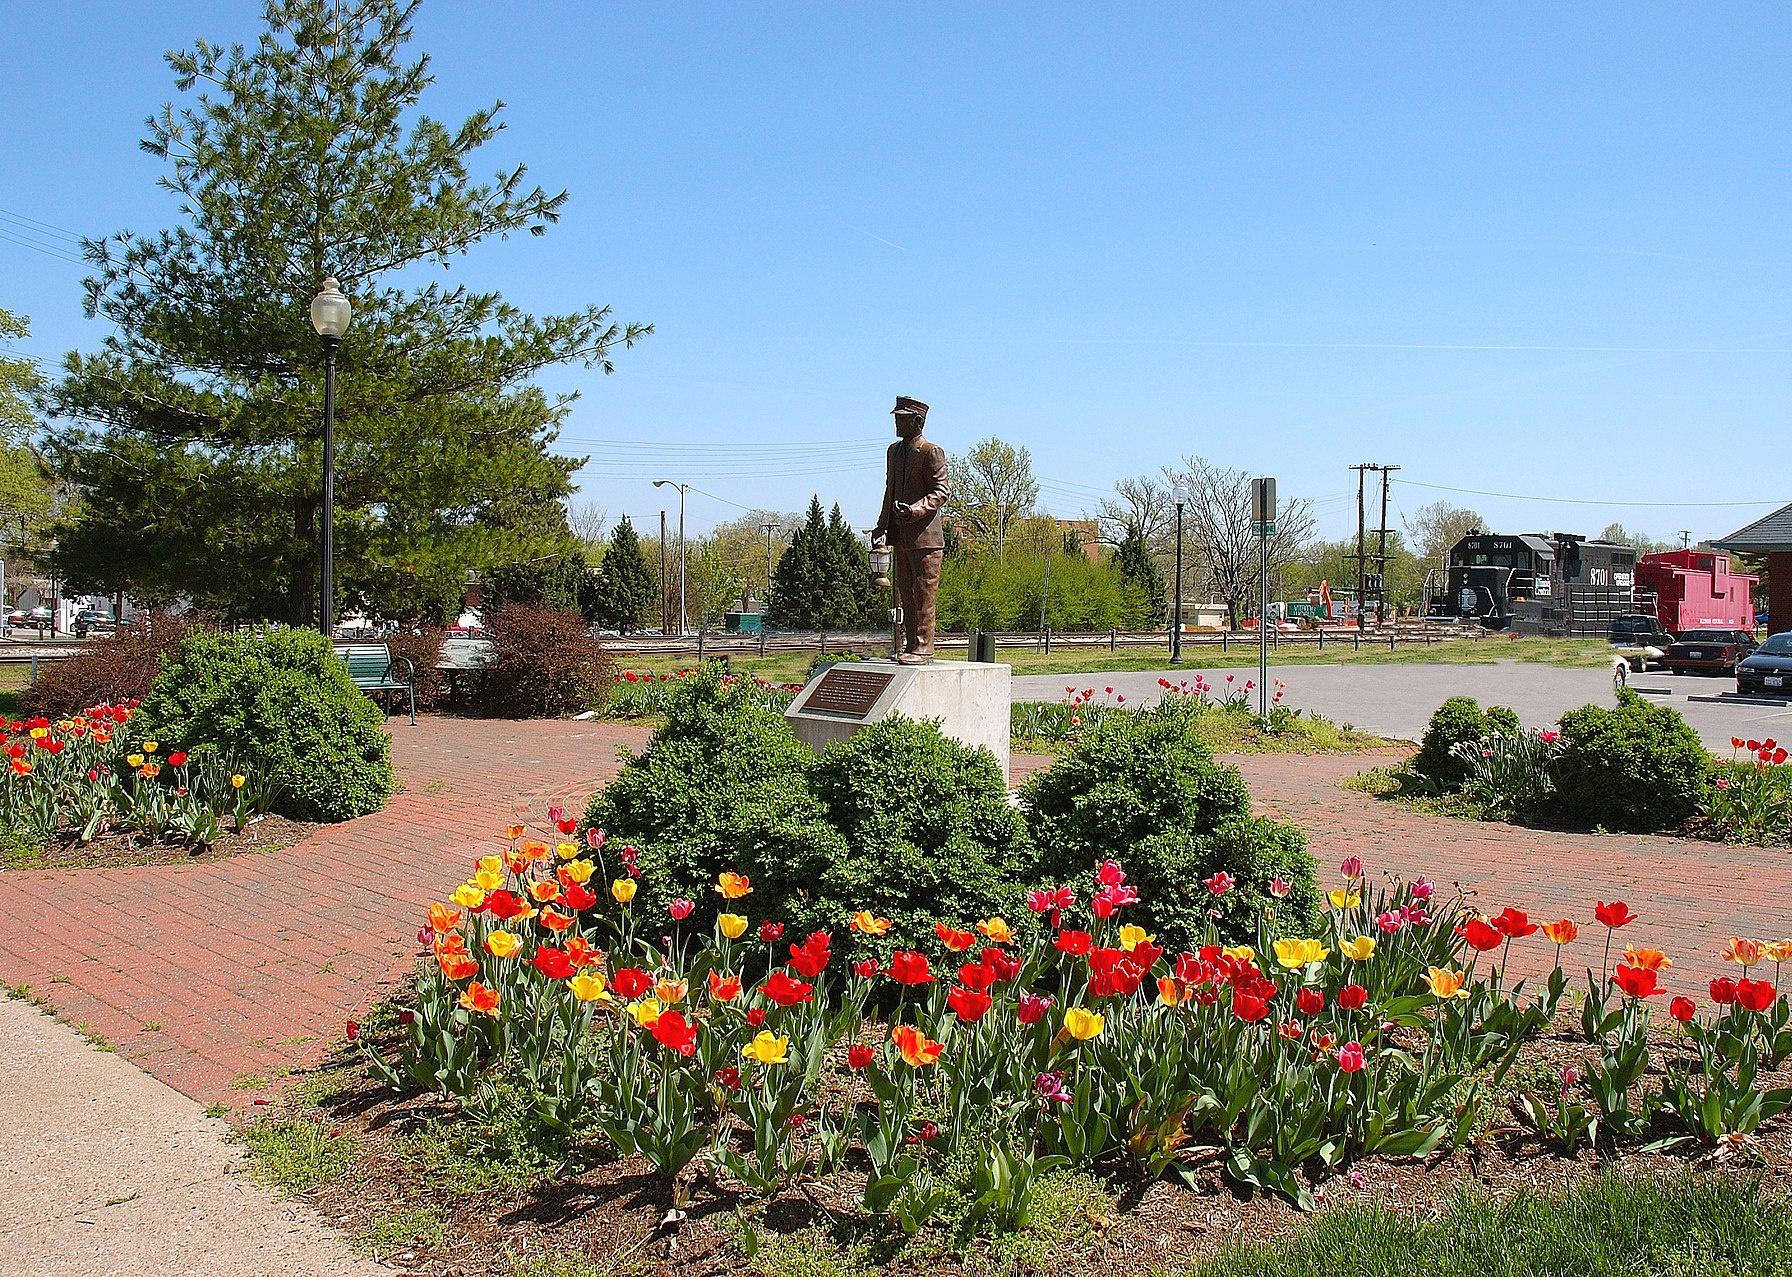
#38. Carbondale, Illinois
Statue by Carbondale’s rail station.
– Total homes in metro area: 65,363
– Total unoccupied homes: 10,071 (15.4% of total)
— Homes for rent: 1,634 (2.5% of total)
— Homes rented but not occupied: 723 (7.2% of unoccupied homes)
— Homes for sale: 241 (0.4% of total)
— Homes sold, but not occupied: 0 (0.0% of unoccupied homes)
— Homes for occasional, recreational, or seasonal use: 2,040 (20.3% of unoccupied homes)
— Homes for migrant workers: 0 (0.0% of unoccupied homes)
— Other vacant homes: 5,433 (53.9% of unoccupied homes)

Roberto Galan // Shutterstock
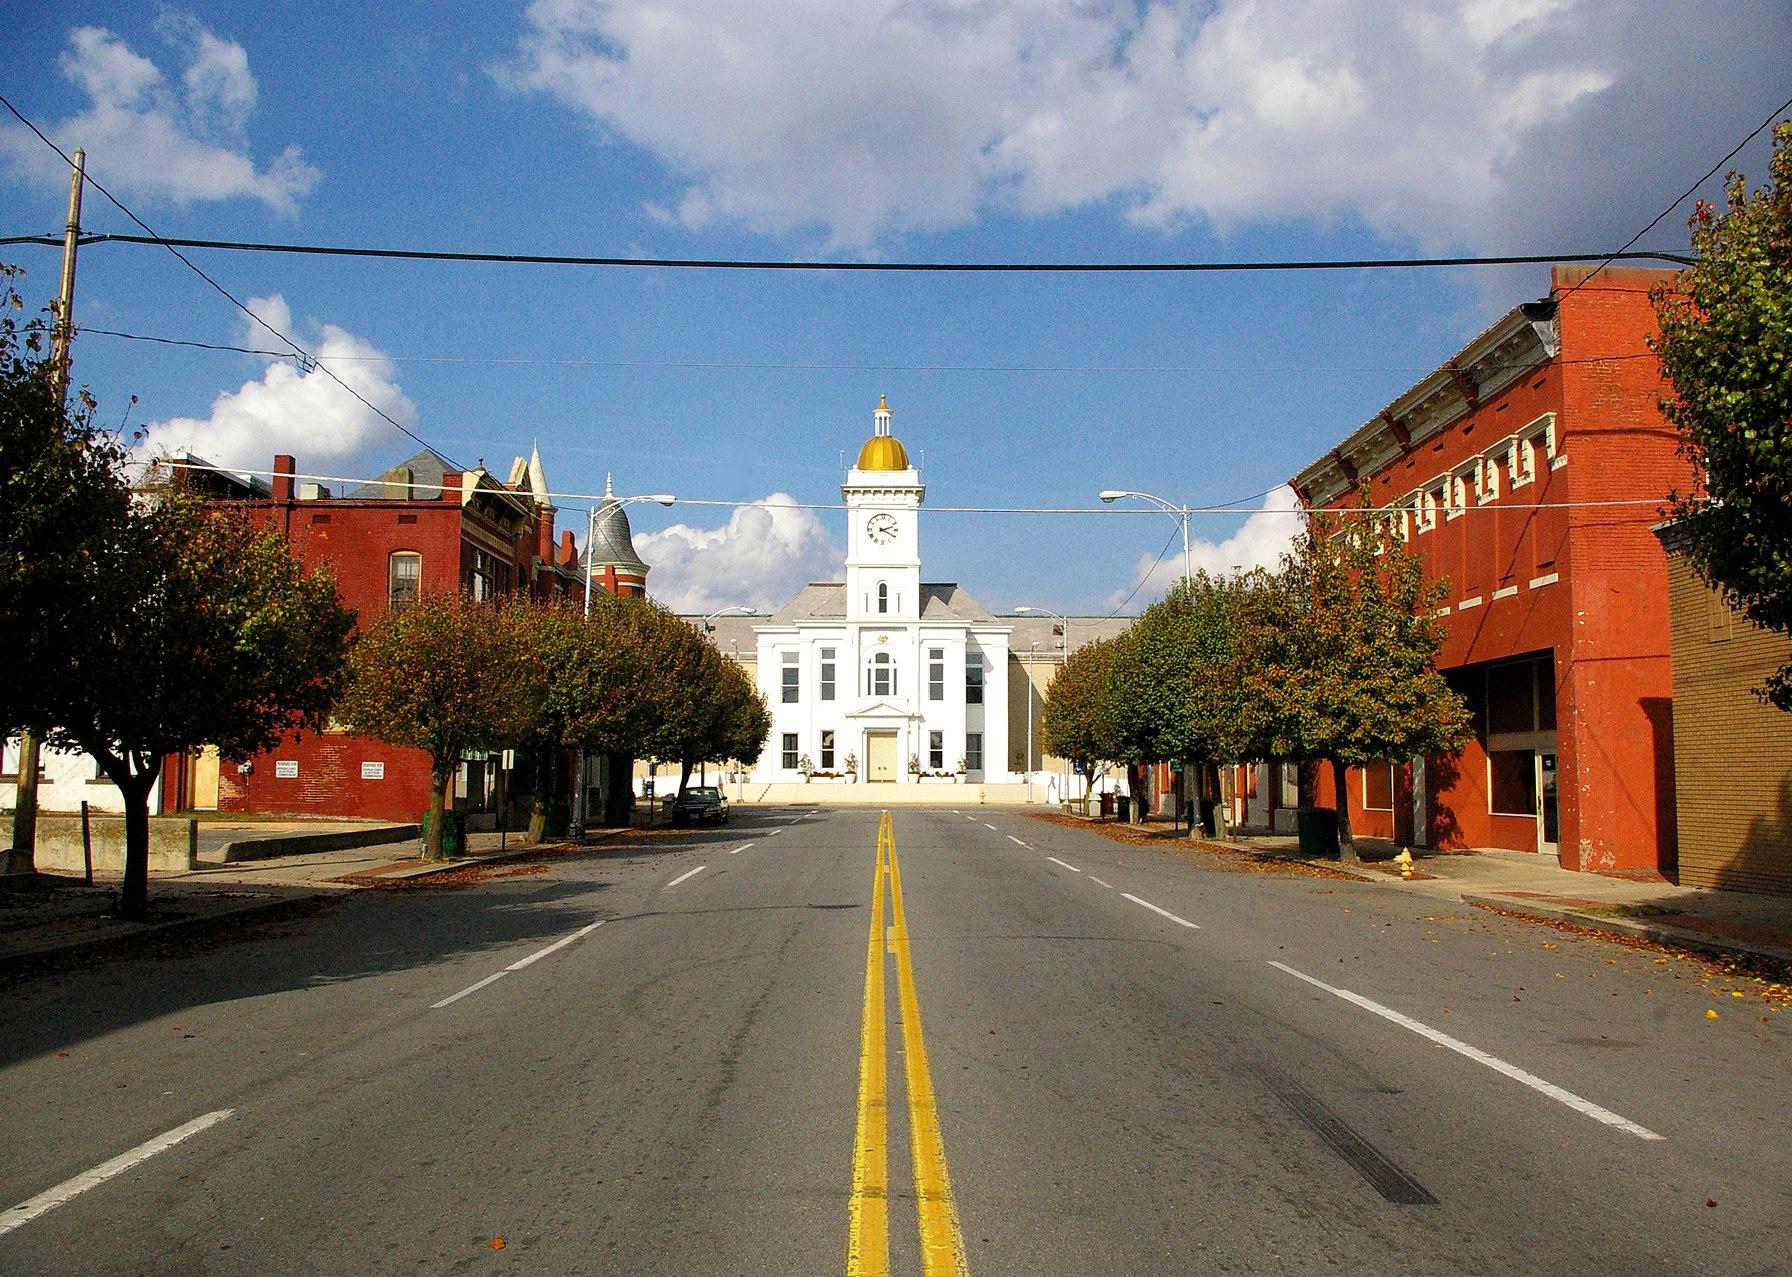
#37. Danville, Illinois
The Vermilion County Courthouse in Danville.
– Total homes in metro area: 34,351
– Total unoccupied homes: 5,344 (15.6% of total)
— Homes for rent: 1,405 (4.1% of total)
— Homes rented but not occupied: 121 (2.3% of unoccupied homes)
— Homes for sale: 179 (0.5% of total)
— Homes sold, but not occupied: 3,129 (58.6% of unoccupied homes)
— Homes for occasional, recreational, or seasonal use: 34 (0.6% of unoccupied homes)
— Homes for migrant workers: 122 (2.3% of unoccupied homes)
— Other vacant homes: 354 (6.6% of unoccupied homes)
Tim Roberts Photography // Shutterstock
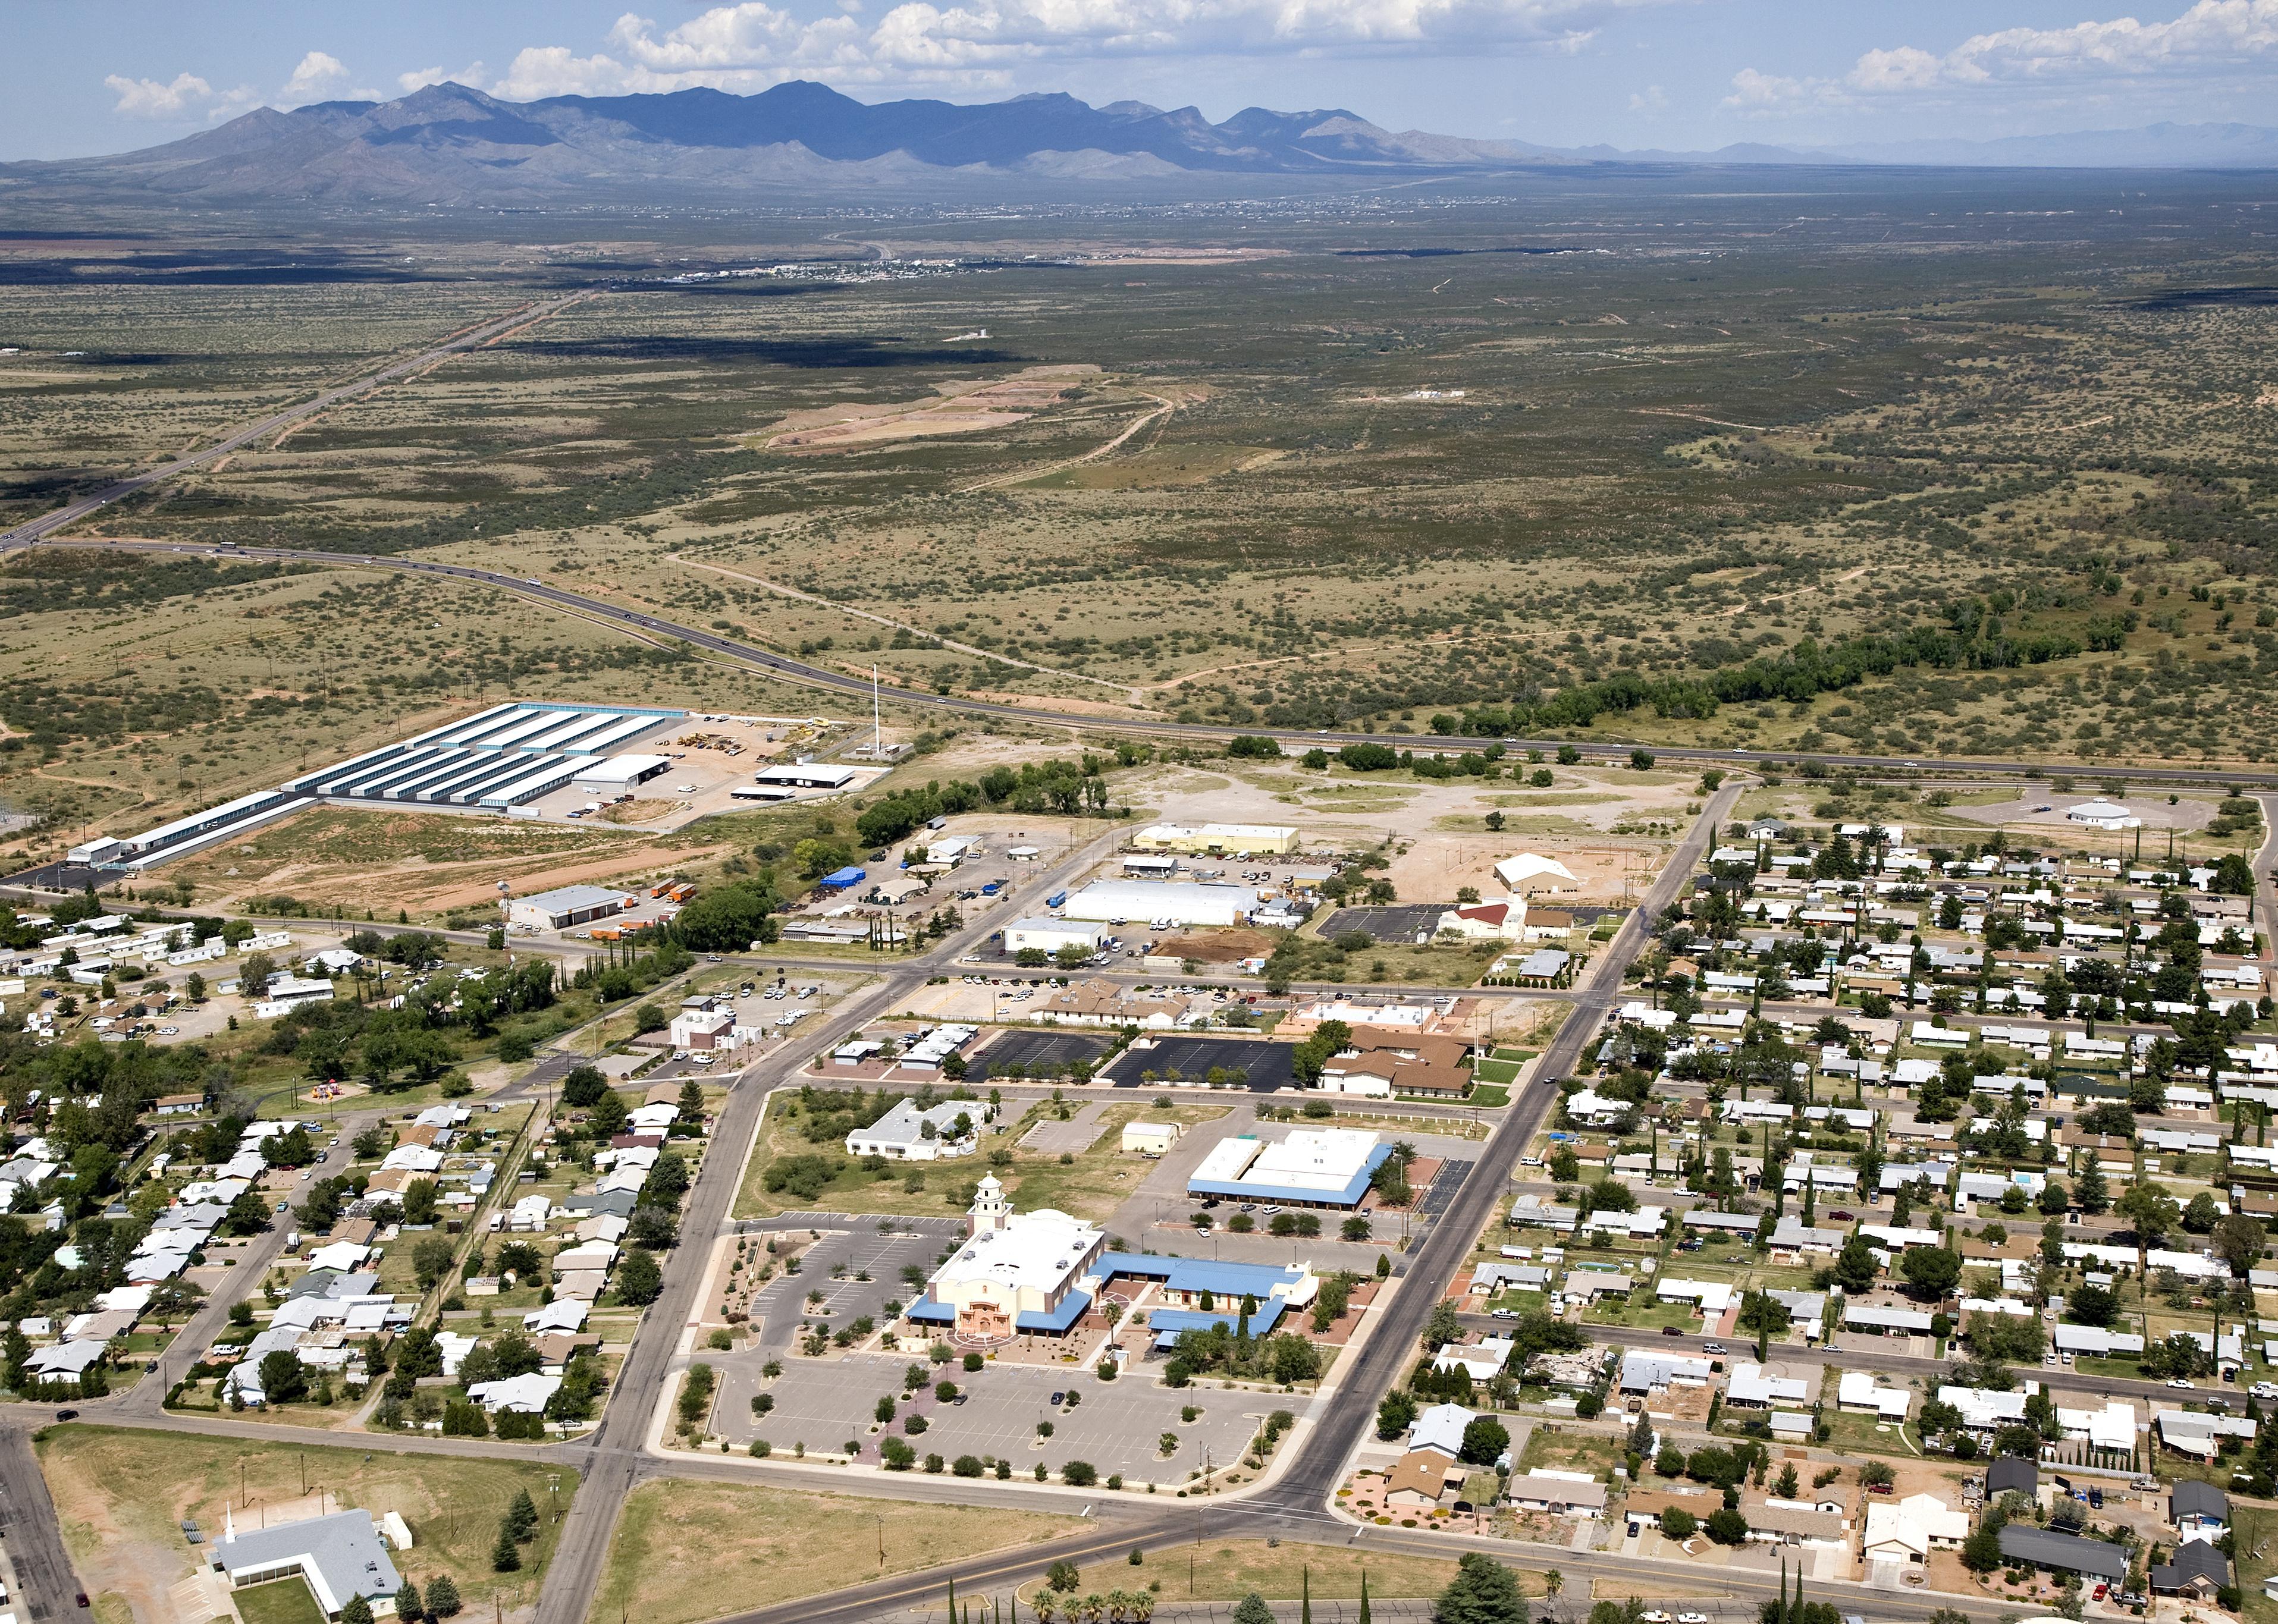
#36. Sierra Vista, Arizona
Sierra Vista landscape from above.
– Total homes in metro area: 59,159
– Total unoccupied homes: 9,207 (15.6% of total)
— Homes for rent: 792 (1.3% of total)
— Homes rented but not occupied: 573 (6.2% of unoccupied homes)
— Homes for sale: 582 (1.0% of total)
— Homes sold, but not occupied: 368 (4.0% of unoccupied homes)
— Homes for occasional, recreational, or seasonal use: 2,761 (30.0% of unoccupied homes)
— Homes for migrant workers: 0 (0.0% of unoccupied homes)
— Other vacant homes: 4,131 (44.9% of unoccupied homes)

Sean Pavone // Shutterstock
#35. Charleston, West Virginia
Charleston skyline on the Kanawha River.
– Total homes in metro area: 126,013
– Total unoccupied homes: 19,703 (15.6% of total)
— Homes for rent: 1,720 (1.4% of total)
— Homes rented but not occupied: 56 (0.3% of unoccupied homes)
— Homes for sale: 1,015 (0.8% of total)
— Homes sold, but not occupied: 112 (0.6% of unoccupied homes)
— Homes for occasional, recreational, or seasonal use: 1,912 (9.7% of unoccupied homes)
— Homes for migrant workers: 0 (0.0% of unoccupied homes)
— Other vacant homes: 14,888 (75.6% of unoccupied homes)

Sean Pavone // Shutterstock
#34. Lakeland, Florida
Downtown Lakeland cityscape at city hall during dusk.
– Total homes in metro area: 327,817
– Total unoccupied homes: 51,348 (15.7% of total)
— Homes for rent: 2,879 (0.9% of total)
— Homes rented but not occupied: 1,414 (2.8% of unoccupied homes)
— Homes for sale: 1,387 (0.4% of total)
— Homes sold, but not occupied: 1,352 (2.6% of unoccupied homes)
— Homes for occasional, recreational, or seasonal use: 32,536 (63.4% of unoccupied homes)
— Homes for migrant workers: 146 (0.3% of unoccupied homes)
— Other vacant homes: 11,634 (22.7% of unoccupied homes)

JMcQ // Shutterstock
#33. Anniston, Alabama
Historic Calhoun County Courthouse in Anniston.
– Total homes in metro area: 53,211
– Total unoccupied homes: 8,580 (16.1% of total)
— Homes for rent: 1,098 (2.1% of total)
— Homes rented but not occupied: 248 (2.9% of unoccupied homes)
— Homes for sale: 521 (1.0% of total)
— Homes sold, but not occupied: 0 (0.0% of unoccupied homes)
— Homes for occasional, recreational, or seasonal use: 1,224 (14.3% of unoccupied homes)
— Homes for migrant workers: 0 (0.0% of unoccupied homes)
— Other vacant homes: 5,489 (64.0% of unoccupied homes)
Sabrina Janelle Gordon // Shutterstock
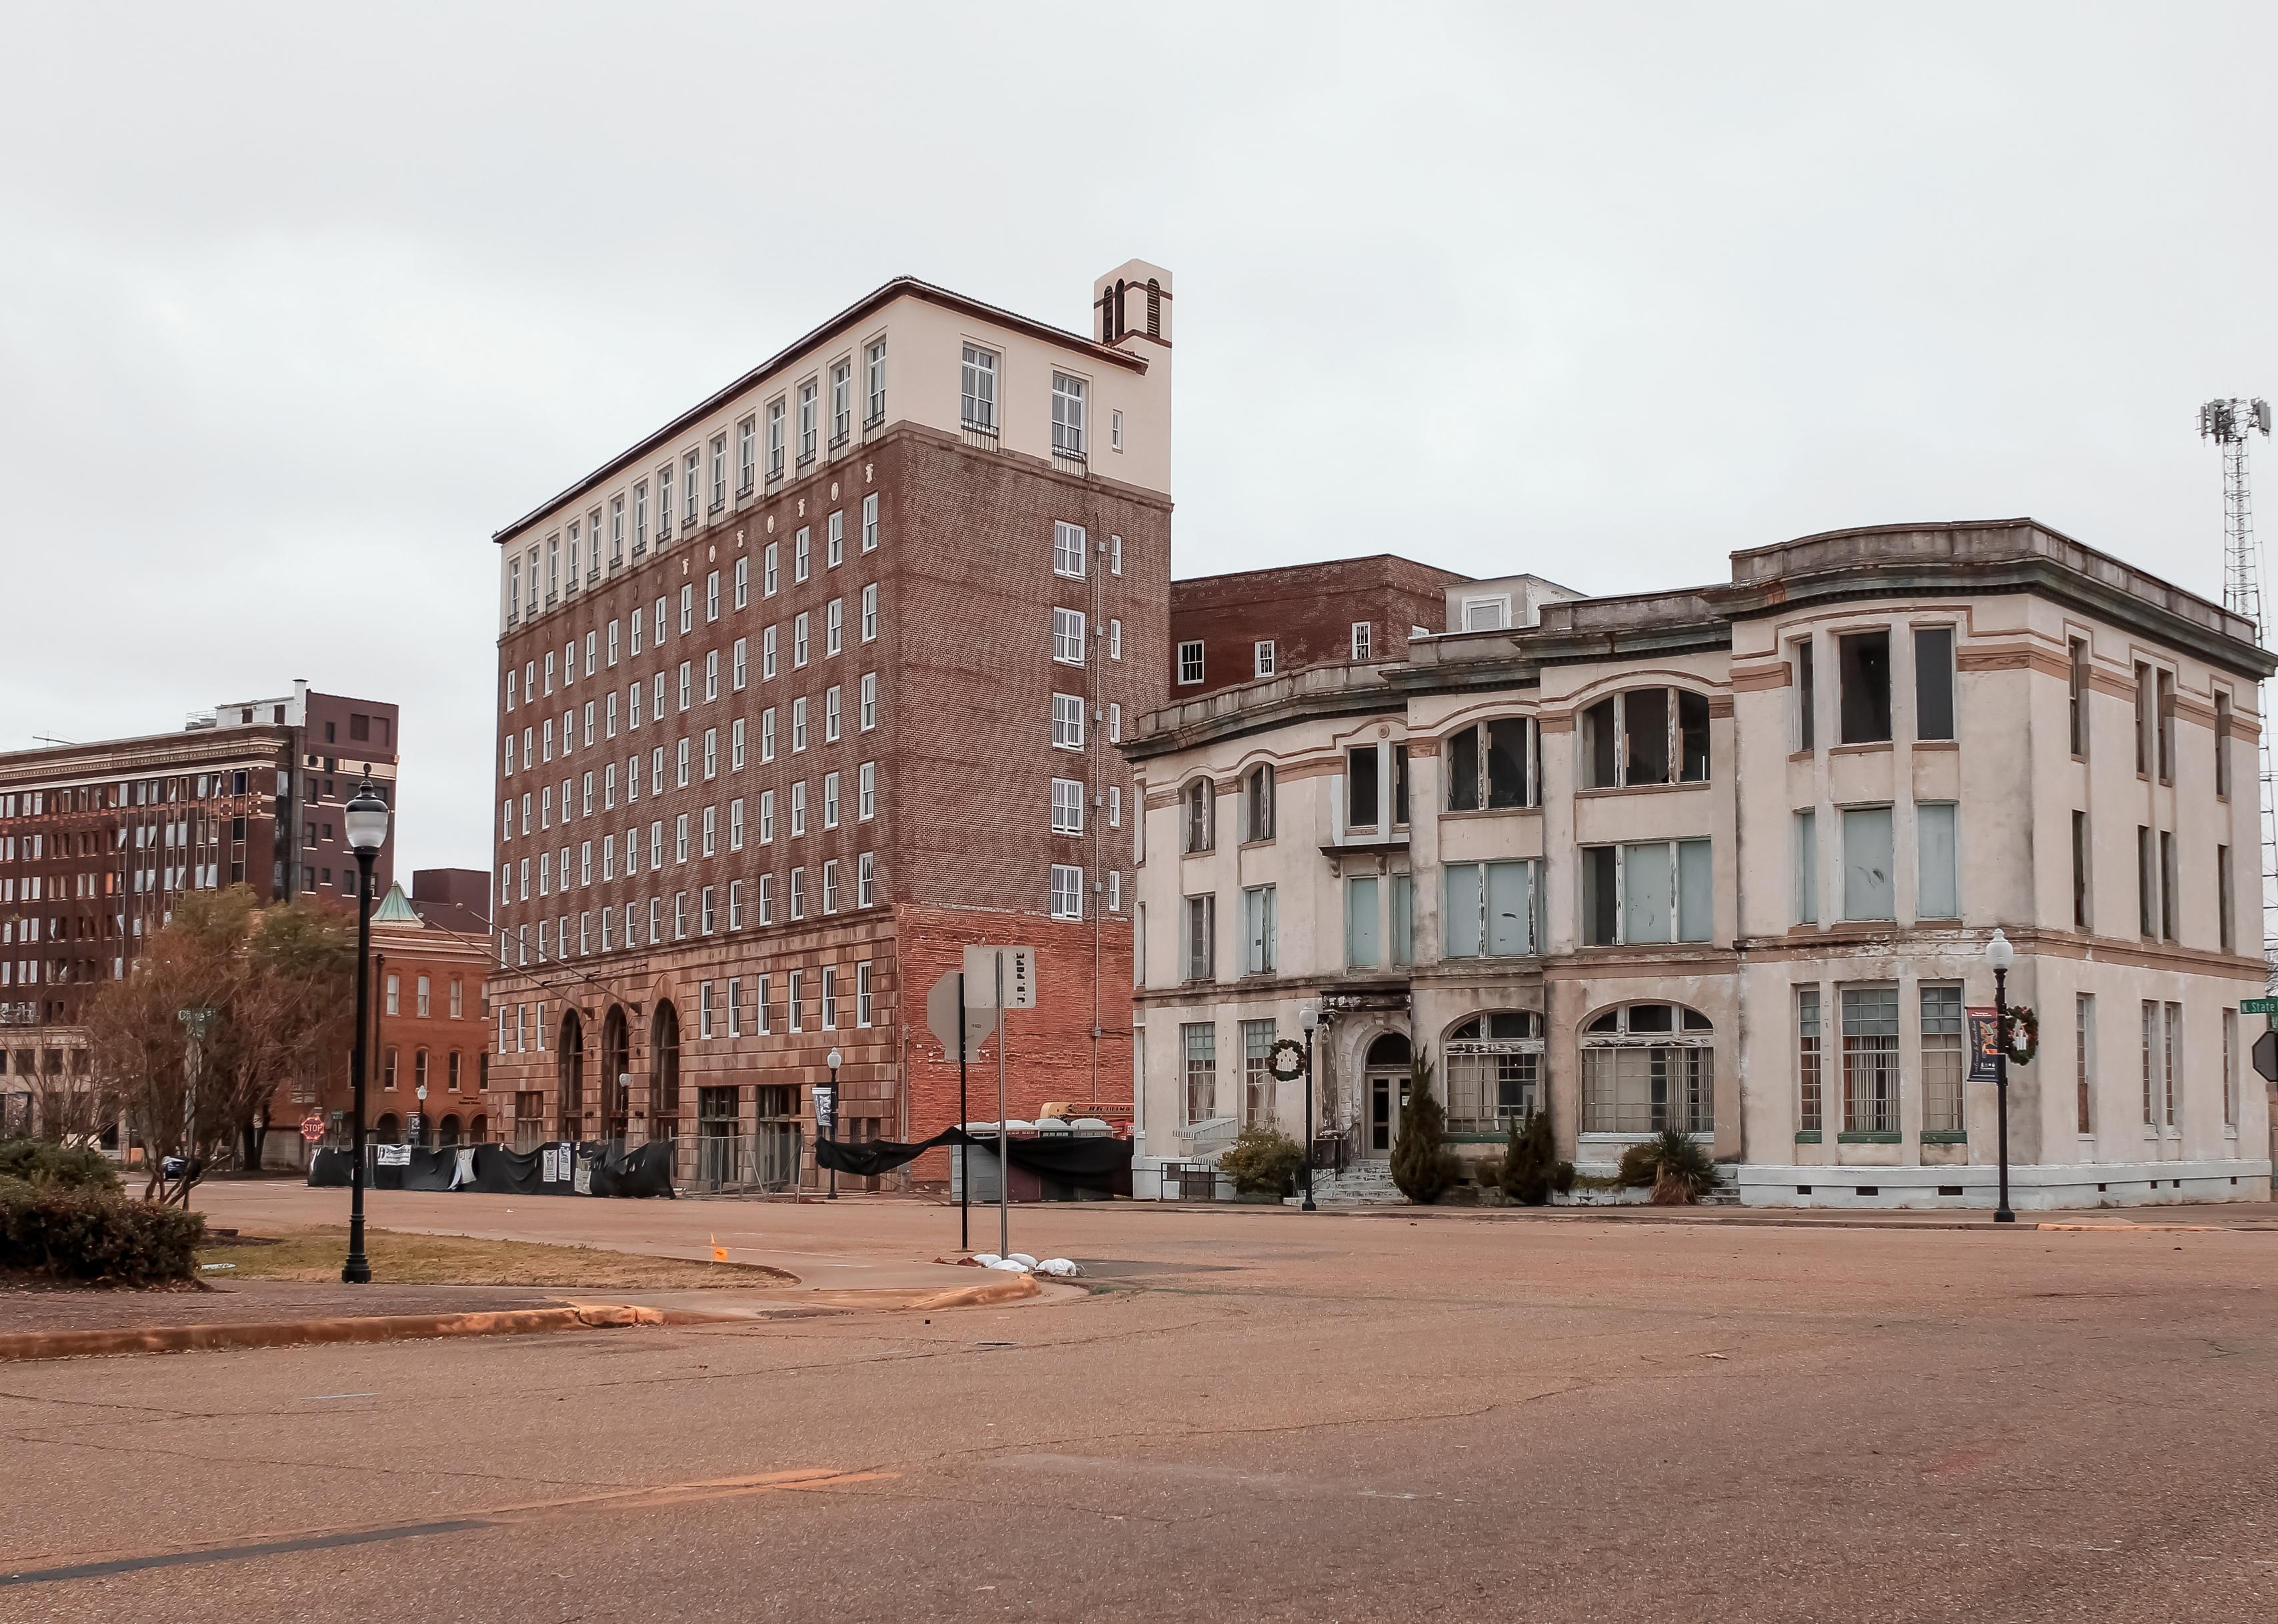
#32. Texarkana, Texas
Downtown buildings in Texarkana.
– Total homes in metro area: 65,823
– Total unoccupied homes: 10,644 (16.2% of total)
— Homes for rent: 1,124 (1.7% of total)
— Homes rented but not occupied: 381 (3.6% of unoccupied homes)
— Homes for sale: 262 (0.4% of total)
— Homes sold, but not occupied: 411 (3.9% of unoccupied homes)
— Homes for occasional, recreational, or seasonal use: 335 (3.1% of unoccupied homes)
— Homes for migrant workers: 0 (0.0% of unoccupied homes)
— Other vacant homes: 8,131 (76.4% of unoccupied homes)
Jacob Boomsma // Shutterstock
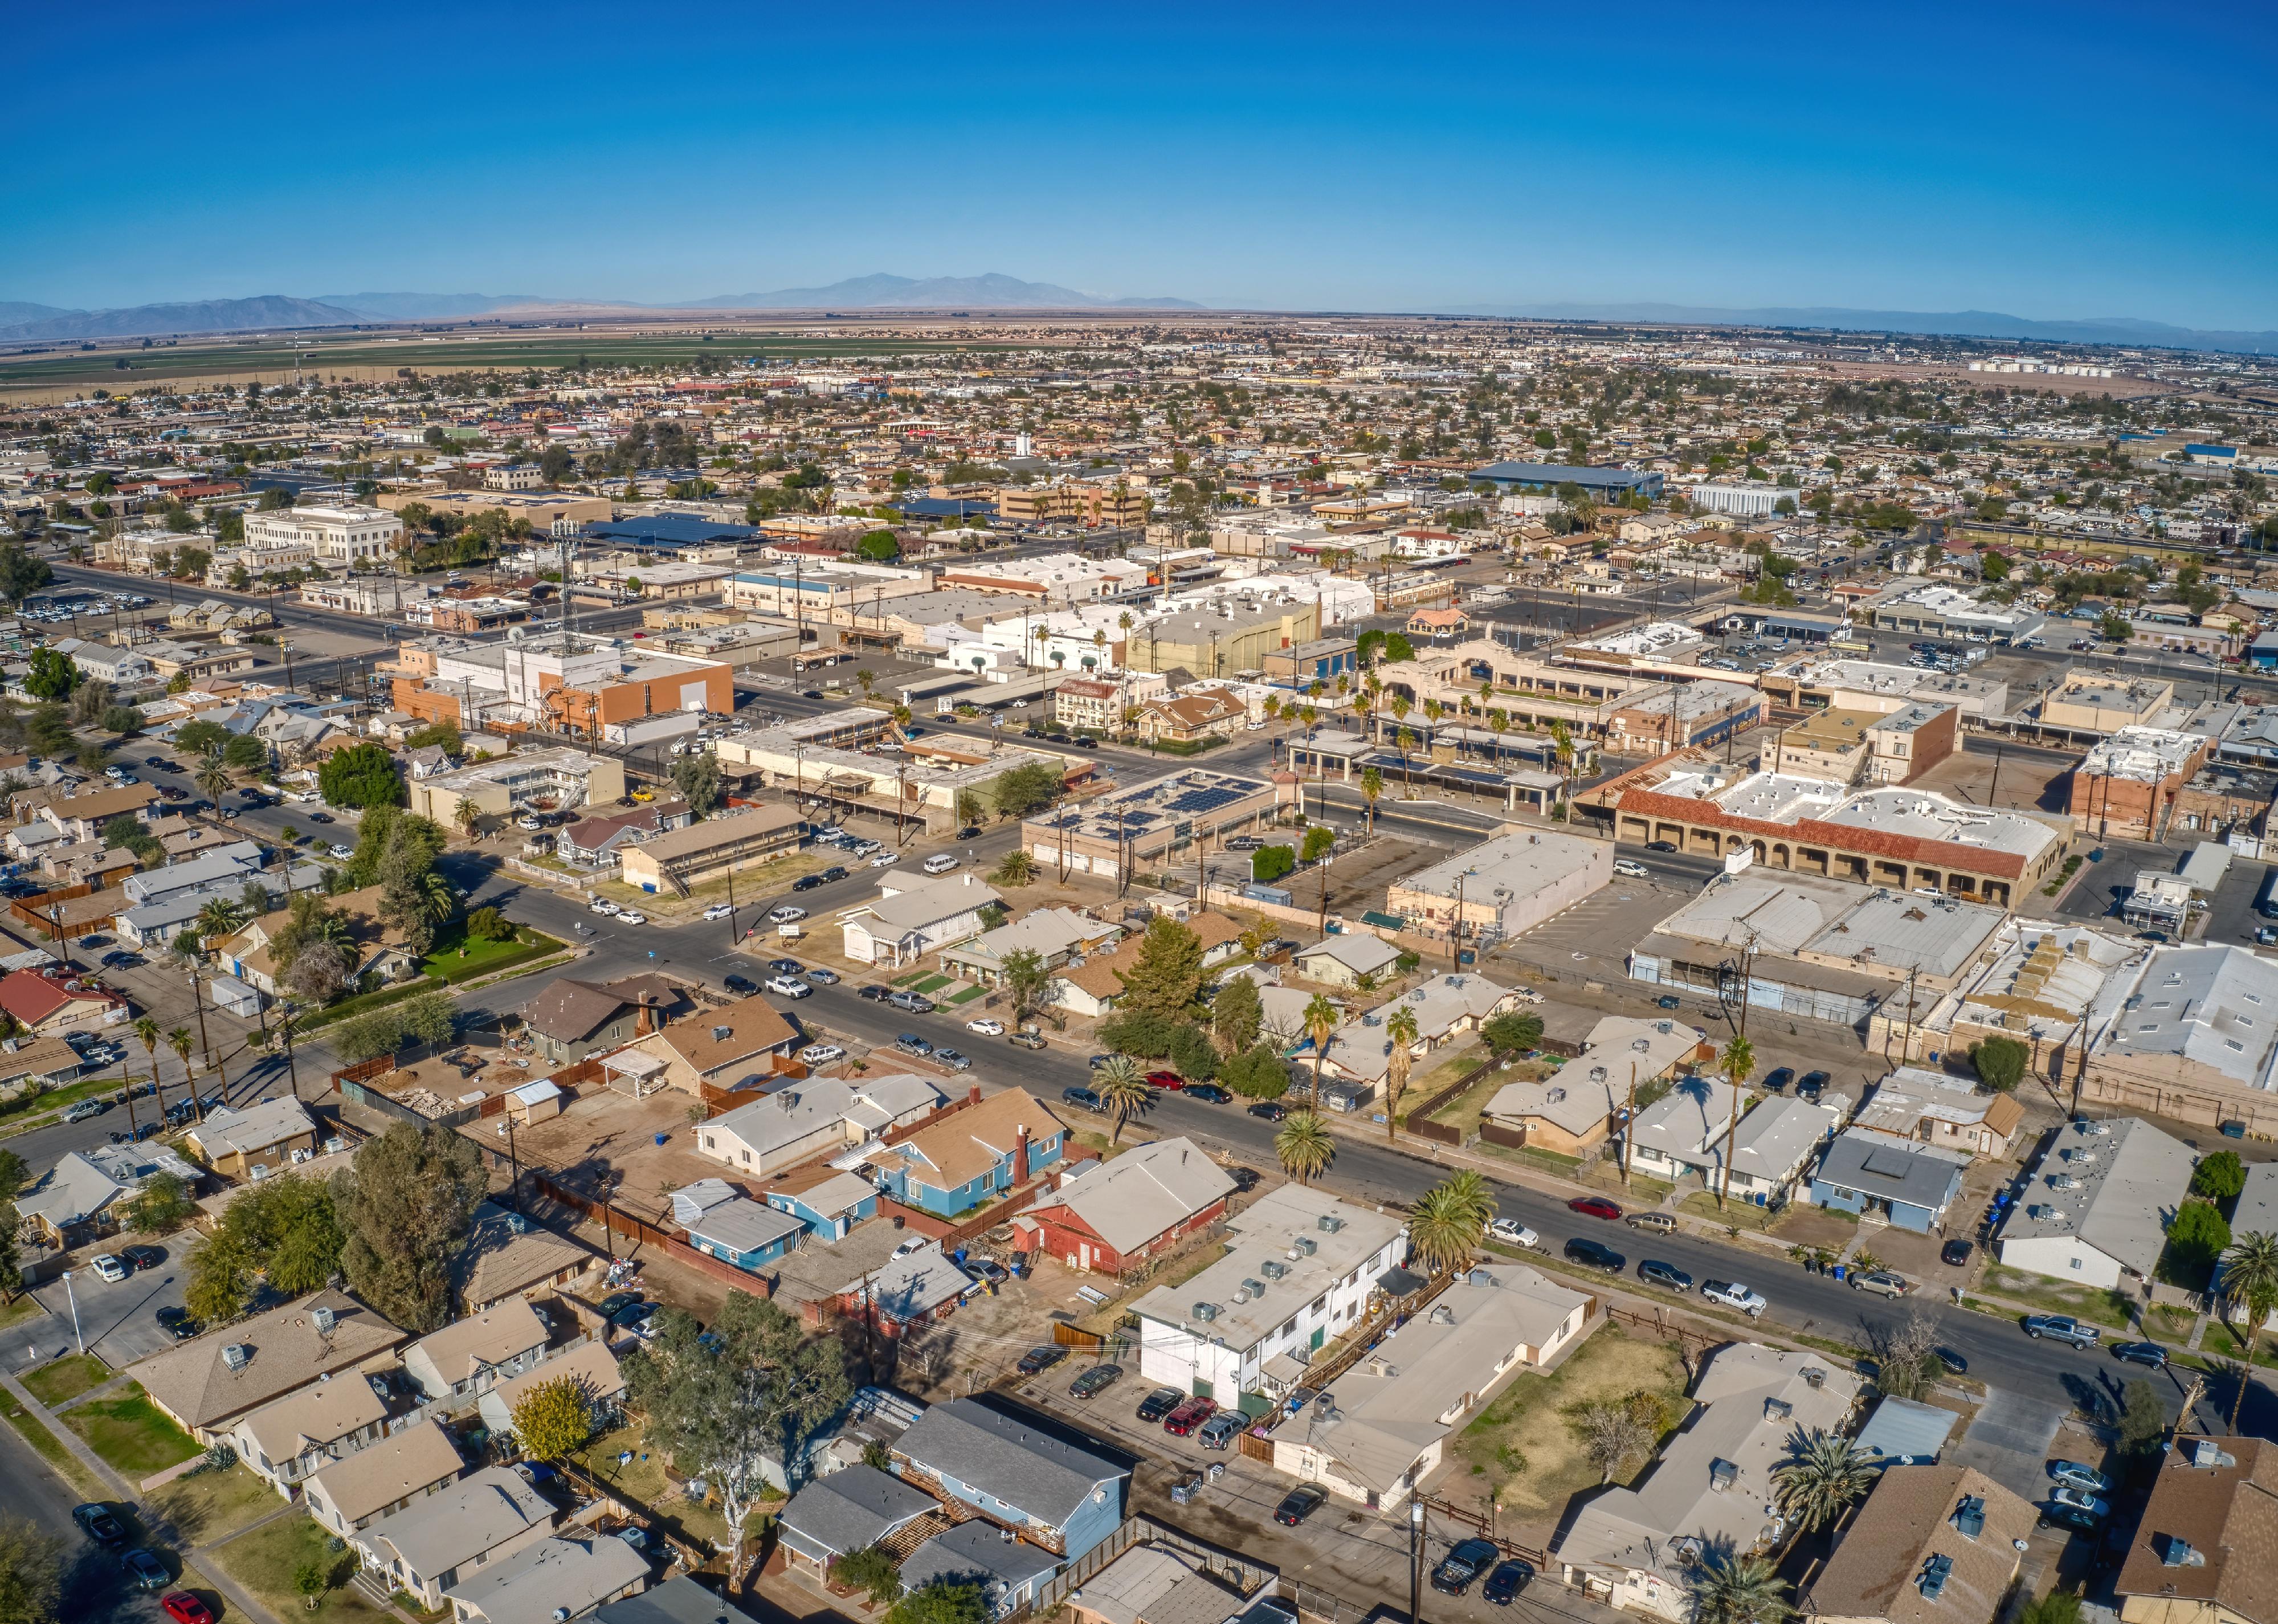
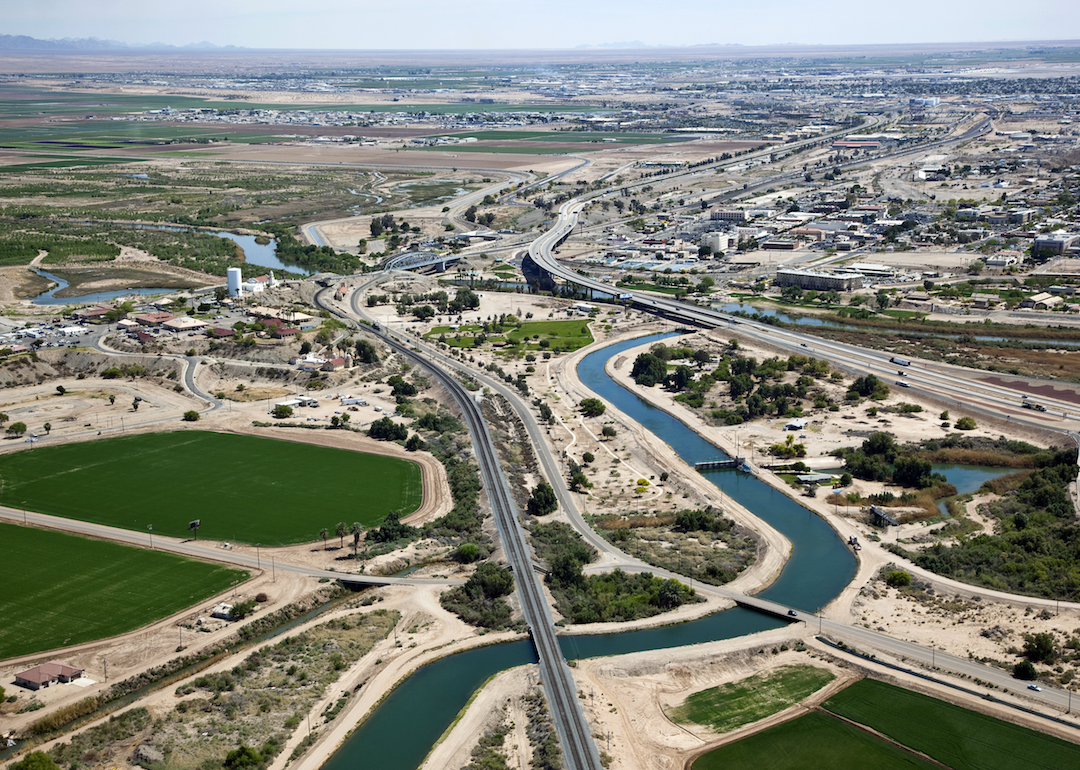
#31. El Centro, California
Aerial view of downtown El Centro in the Imperial Valley.
– Total homes in metro area: 57,101
– Total unoccupied homes: 9,252 (16.2% of total)
— Homes for rent: 445 (0.8% of total)
— Homes rented but not occupied: 326 (3.5% of unoccupied homes)
— Homes for sale: 348 (0.6% of total)
— Homes sold, but not occupied: 108 (1.2% of unoccupied homes)
— Homes for occasional, recreational, or seasonal use: 1,439 (15.6% of unoccupied homes)
— Homes for migrant workers: 125 (1.4% of unoccupied homes)
— Other vacant homes: 6,461 (69.8% of unoccupied homes)
Roschetzky Photography // Shutterstock
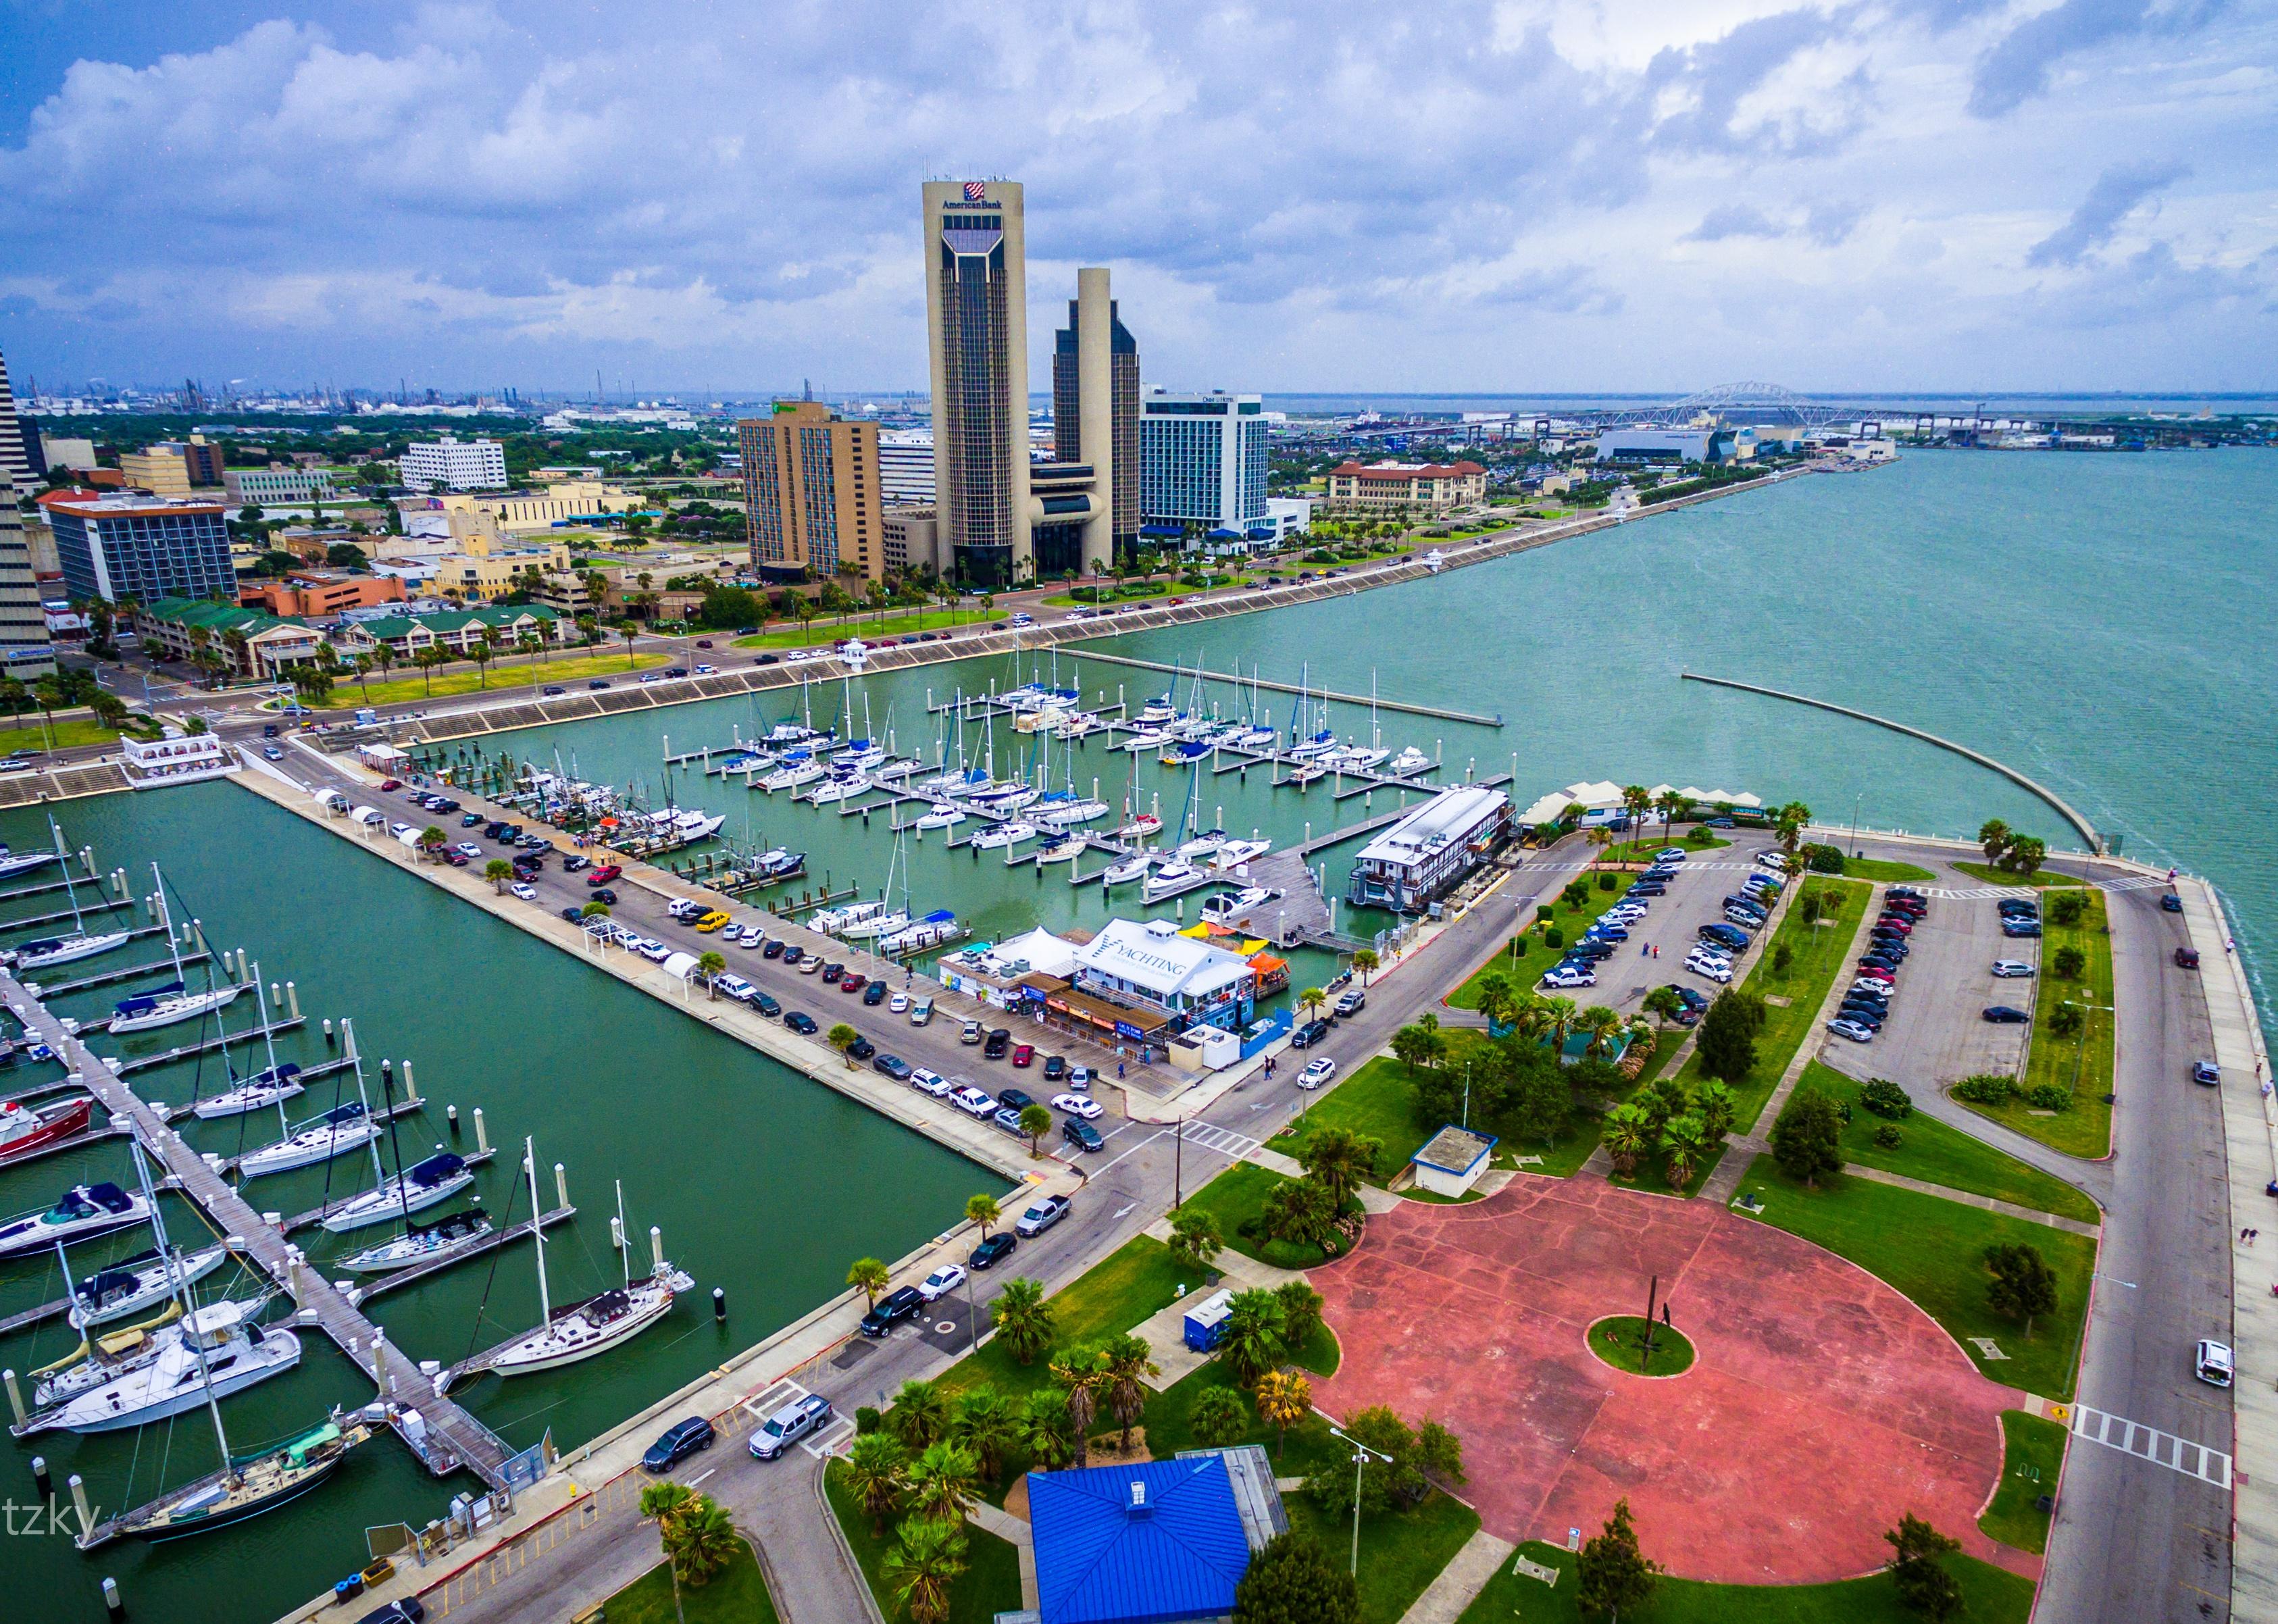
#30. Corpus Christi, Texas
Corpus Christi skyline view of city harbor bridge.
– Total homes in metro area: 182,771
– Total unoccupied homes: 29,652 (16.2% of total)
— Homes for rent: 5,583 (3.1% of total)
— Homes rented but not occupied: 1,547 (5.2% of unoccupied homes)
— Homes for sale: 996 (0.5% of total)
— Homes sold, but not occupied: 490 (1.7% of unoccupied homes)
— Homes for occasional, recreational, or seasonal use: 6,394 (21.6% of unoccupied homes)
— Homes for migrant workers: 0 (0.0% of unoccupied homes)
— Other vacant homes: 14,642 (49.4% of unoccupied homes)
Noel V. Baebler // Shutterstock
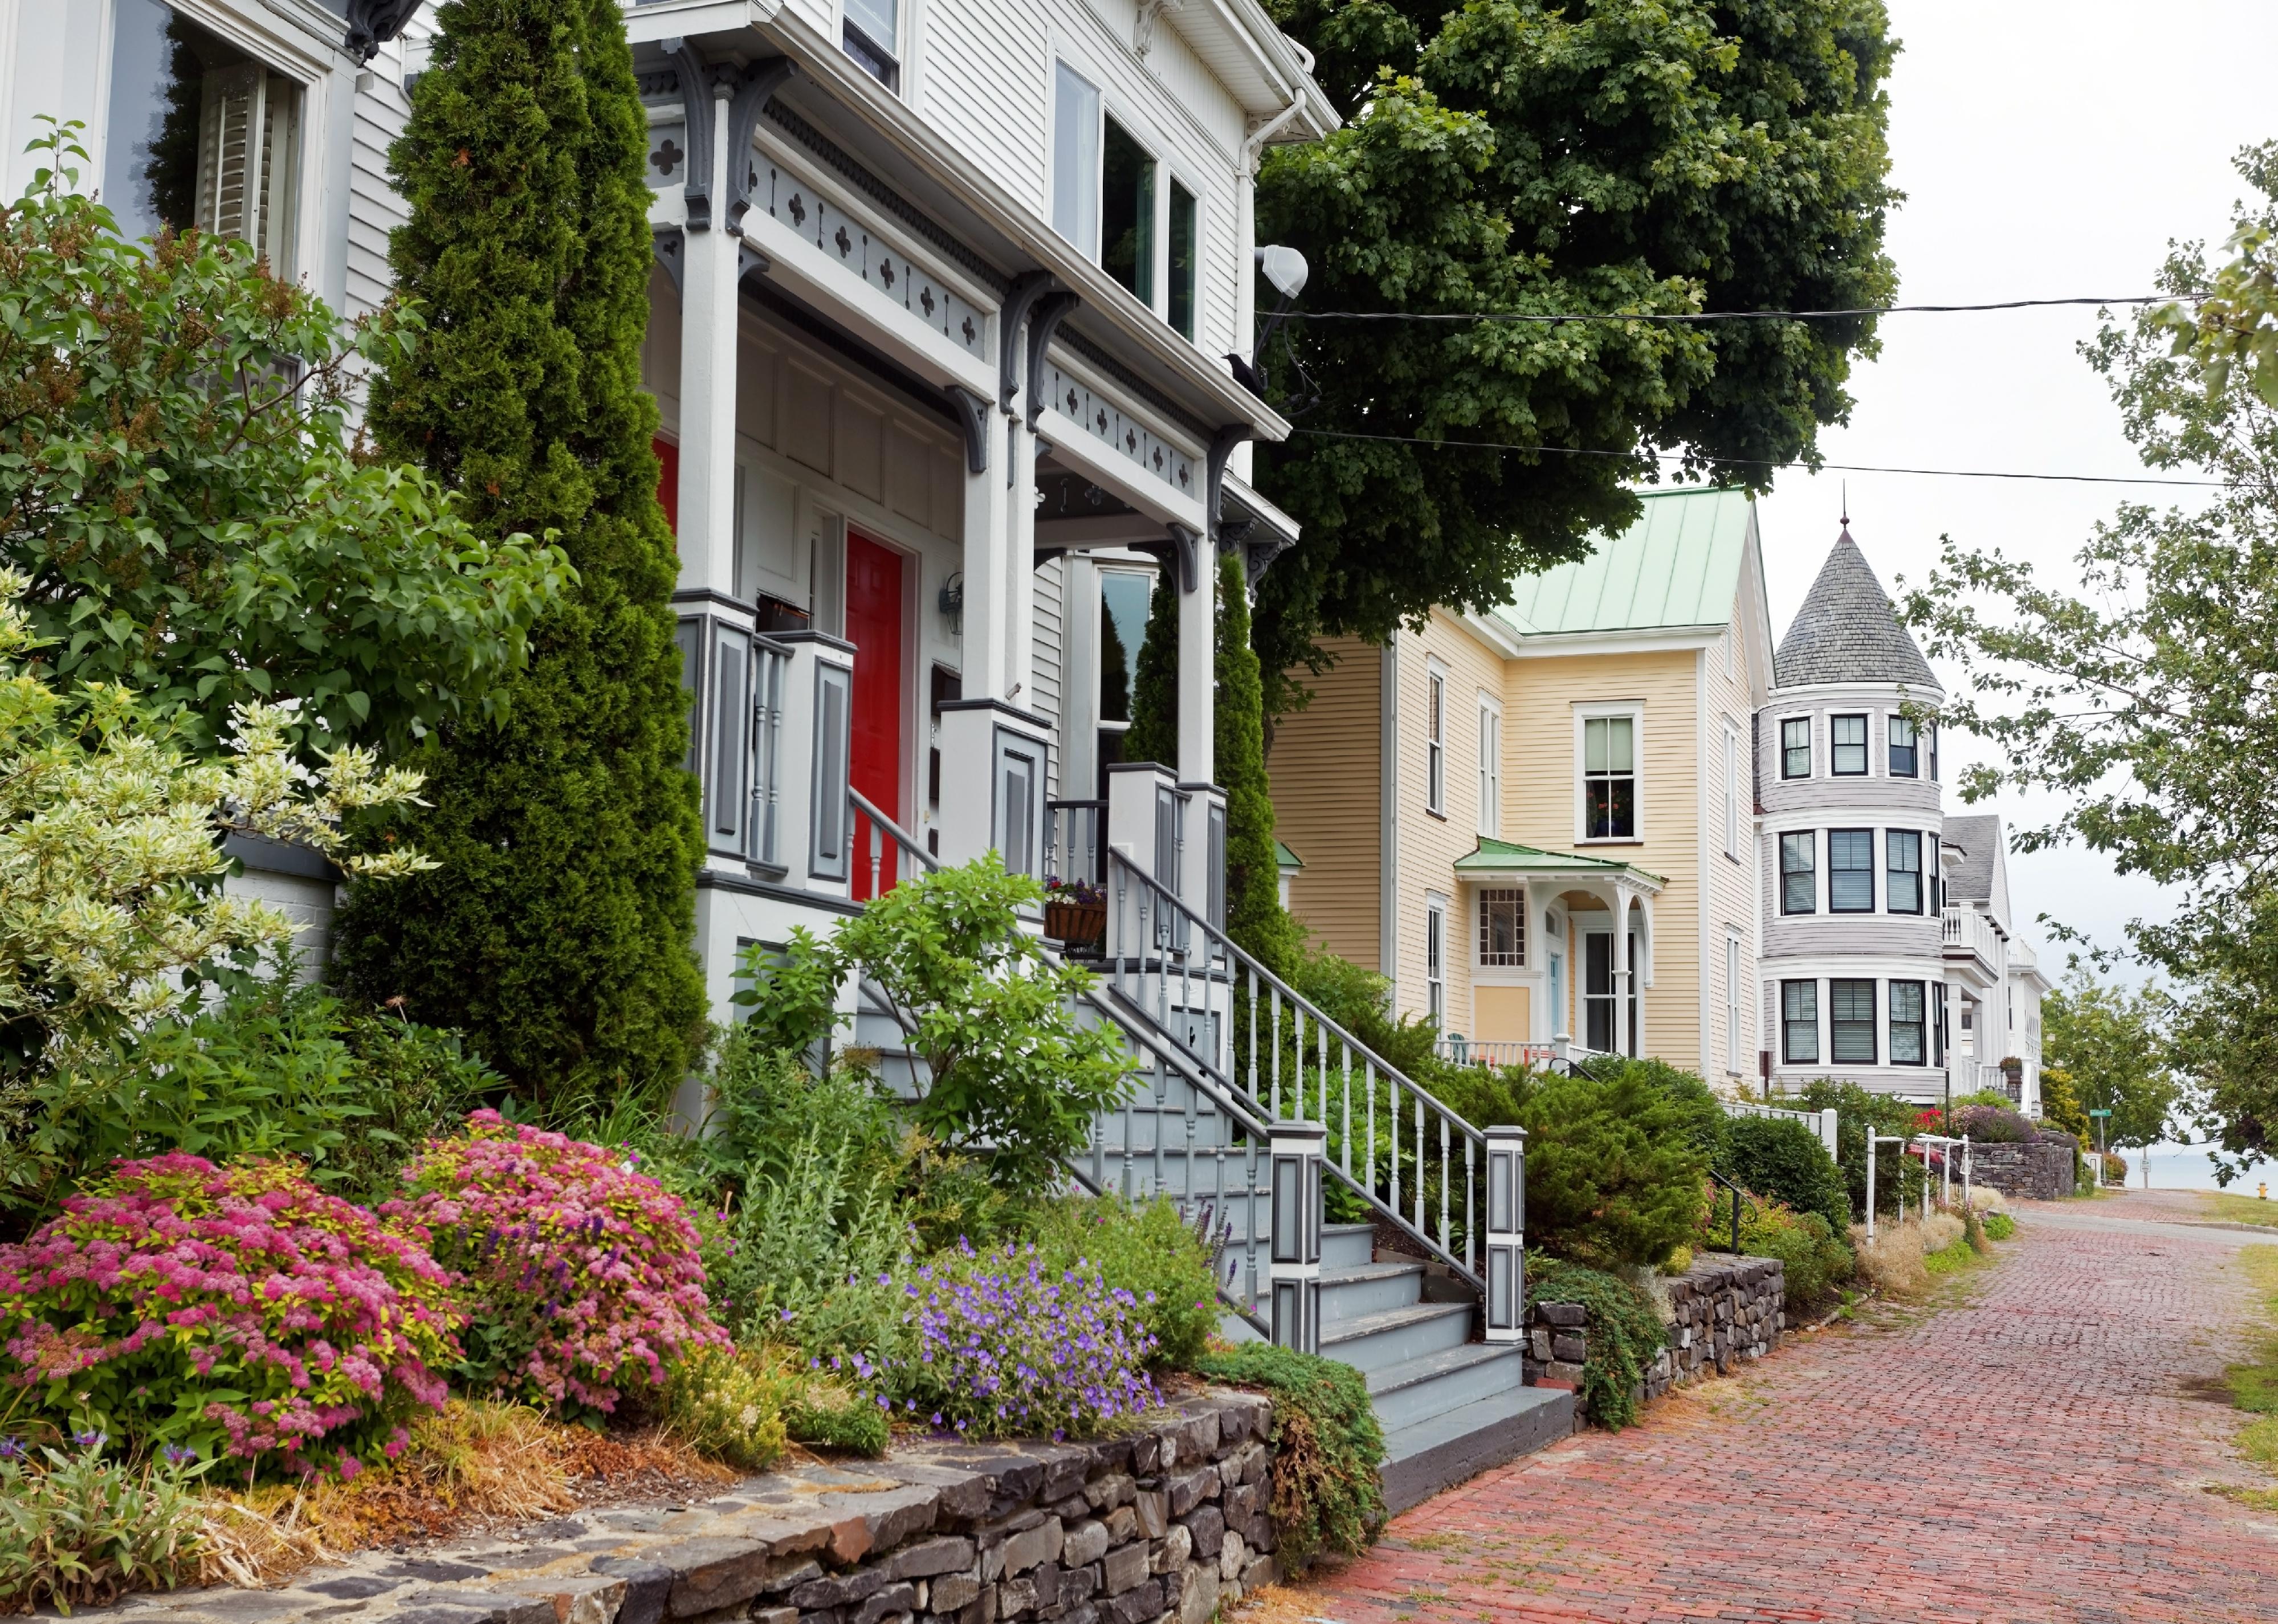
#29. Portland, Maine
Residential neighborhood block in Portland, Maine.
– Total homes in metro area: 284,005
– Total unoccupied homes: 46,819 (16.5% of total)
— Homes for rent: 2,893 (1.0% of total)
— Homes rented but not occupied: 733 (1.6% of unoccupied homes)
— Homes for sale: 562 (0.2% of total)
— Homes sold, but not occupied: 1,549 (3.3% of unoccupied homes)
— Homes for occasional, recreational, or seasonal use: 34,775 (74.3% of unoccupied homes)
— Homes for migrant workers: 0 (0.0% of unoccupied homes)
— Other vacant homes: 6,307 (13.5% of unoccupied homes)
Dee Browning // Shutterstock
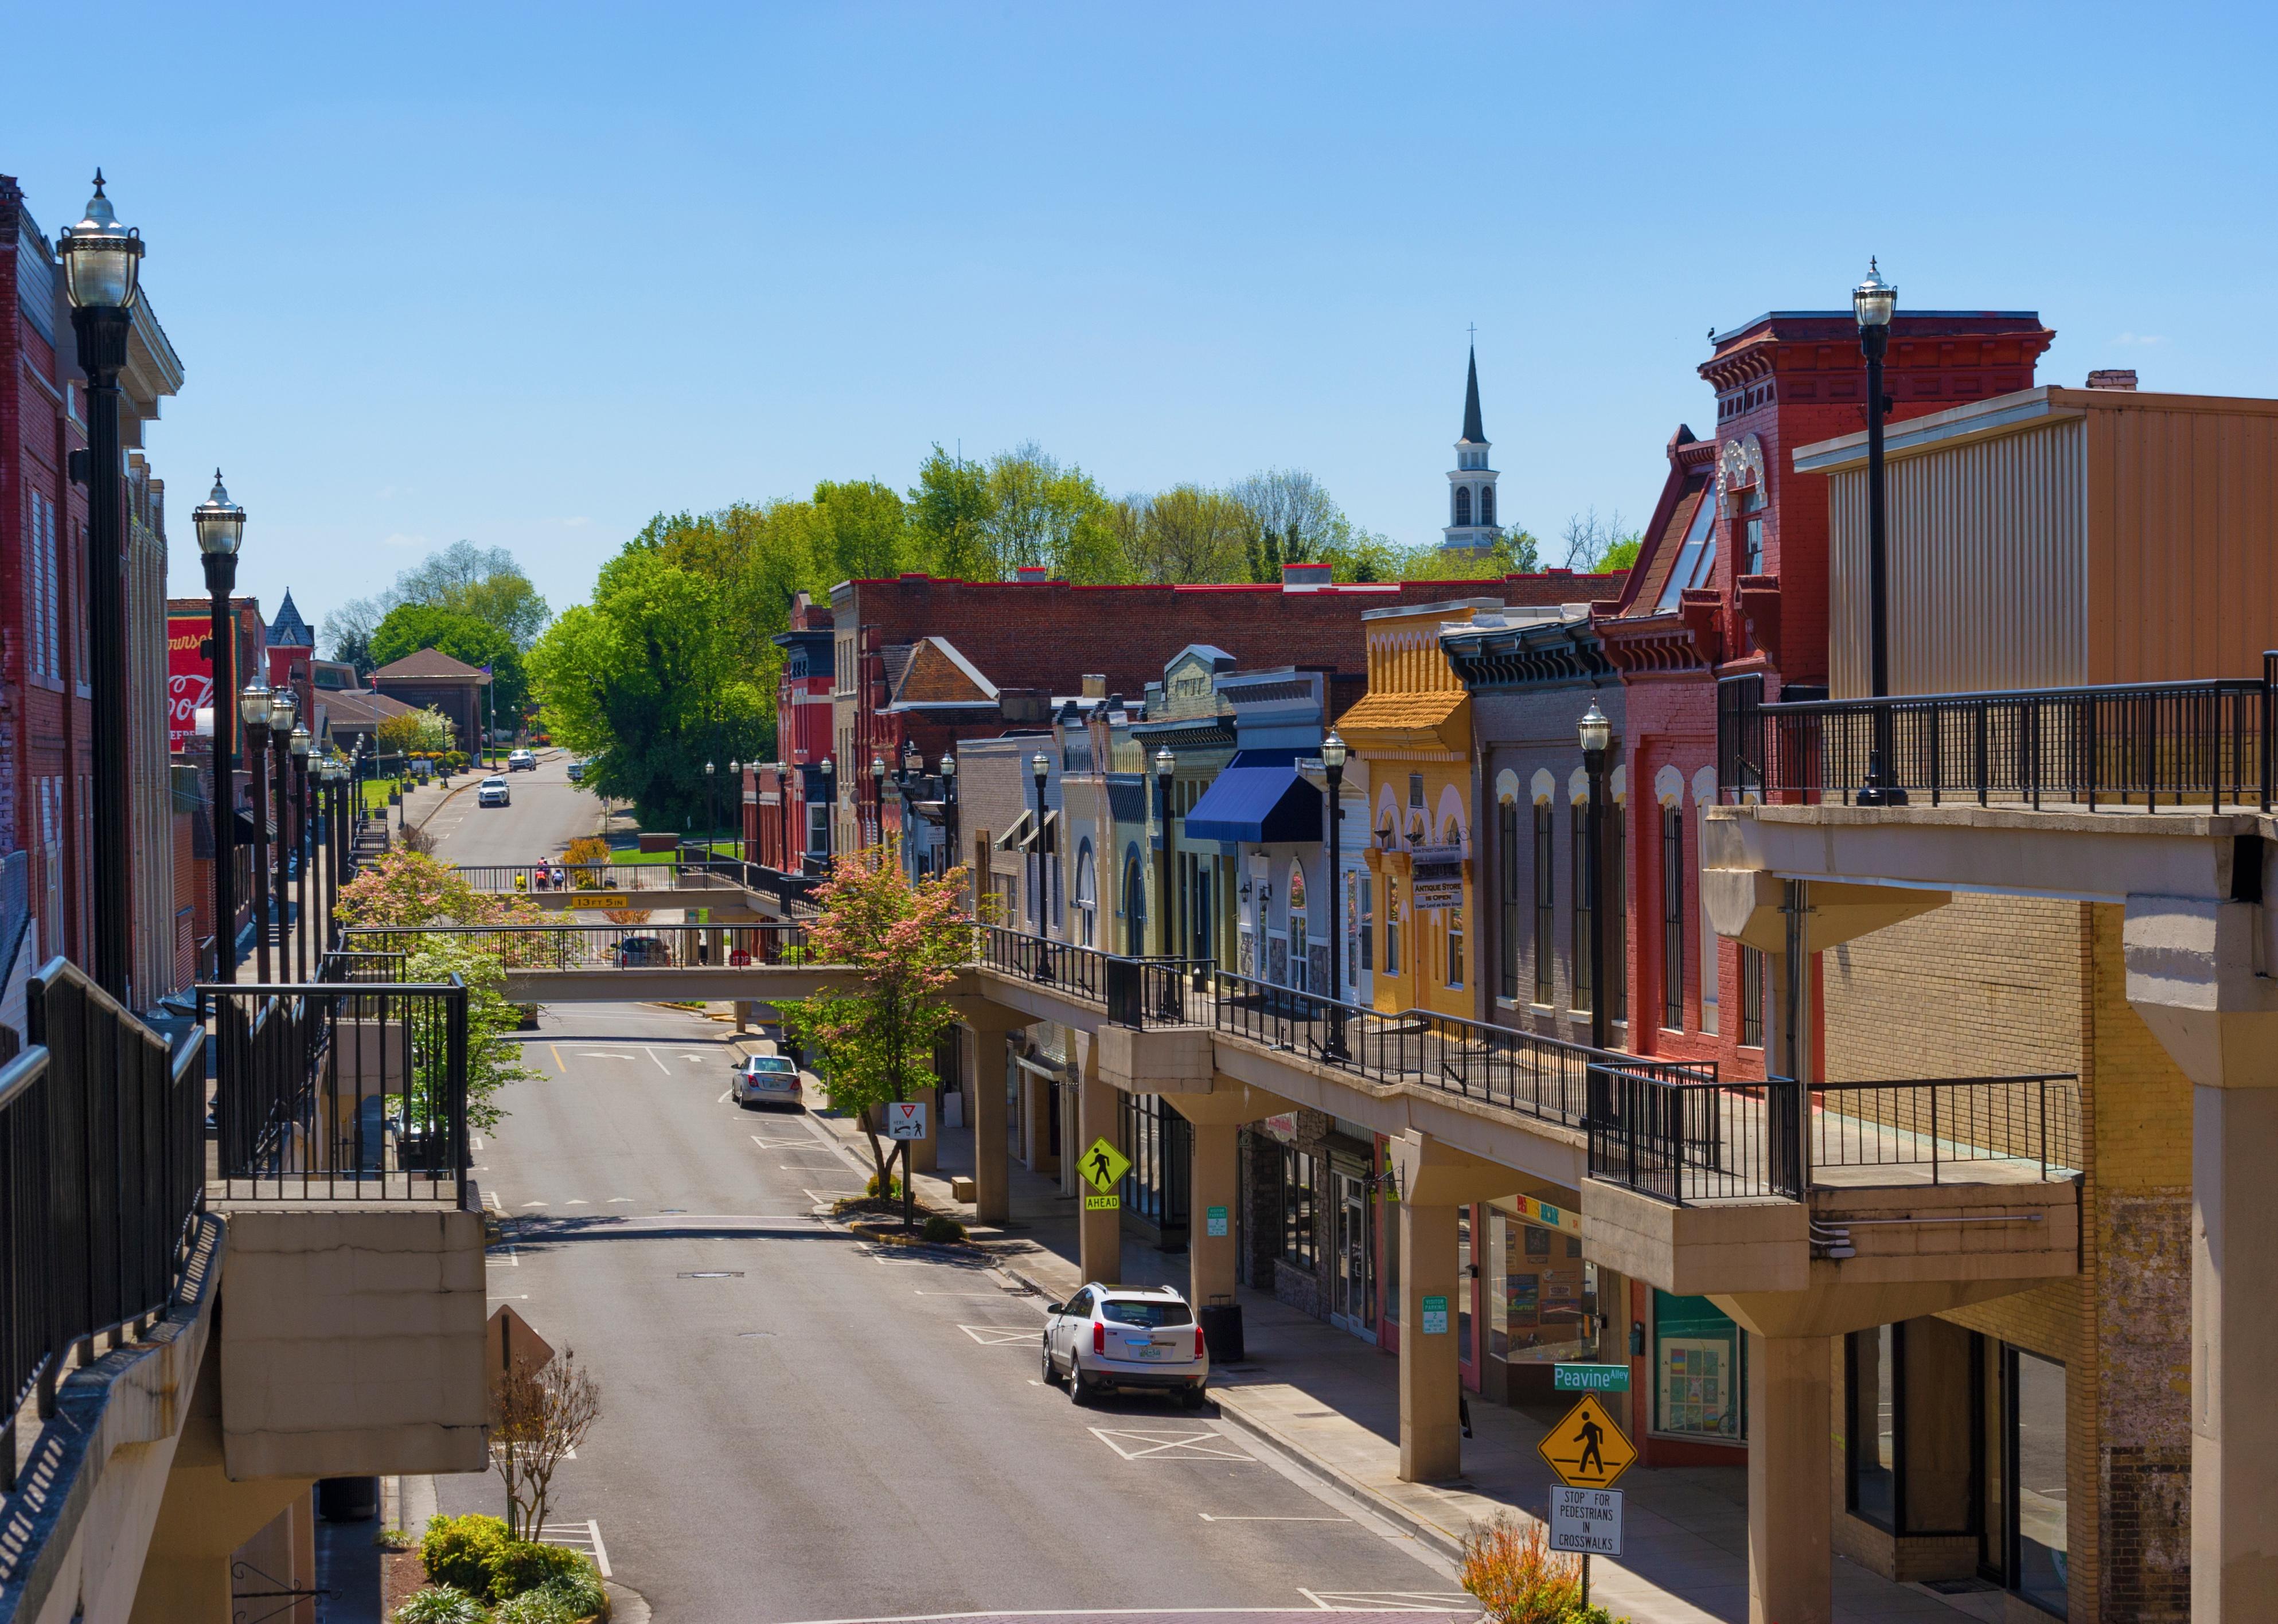
#28. Morristown, Tennessee
Morristown historic district.
– Total homes in metro area: 64,582
– Total unoccupied homes: 10,657 (16.5% of total)
— Homes for rent: 1,066 (1.7% of total)
— Homes rented but not occupied: 74 (0.7% of unoccupied homes)
— Homes for sale: 236 (0.4% of total)
— Homes sold, but not occupied: 688 (6.5% of unoccupied homes)
— Homes for occasional, recreational, or seasonal use: 3,901 (36.6% of unoccupied homes)
— Homes for migrant workers: 0 (0.0% of unoccupied homes)
— Other vacant homes: 4,692 (44.0% of unoccupied homes)

ESB Professional // Shutterstock
#27. Augusta, Georgia
Downtown Augusta skyline on the Savannah River.
– Total homes in metro area: 267,028
– Total unoccupied homes: 44,762 (16.8% of total)
— Homes for rent: 6,869 (2.6% of total)
— Homes rented but not occupied: 1,291 (2.9% of unoccupied homes)
— Homes for sale: 1,257 (0.5% of total)
— Homes sold, but not occupied: 3,224 (7.2% of unoccupied homes)
— Homes for occasional, recreational, or seasonal use: 8,129 (18.2% of unoccupied homes)
— Homes for migrant workers: 0 (0.0% of unoccupied homes)
— Other vacant homes: 23,992 (53.6% of unoccupied homes)
Jacob Boomsma // Shutterstock
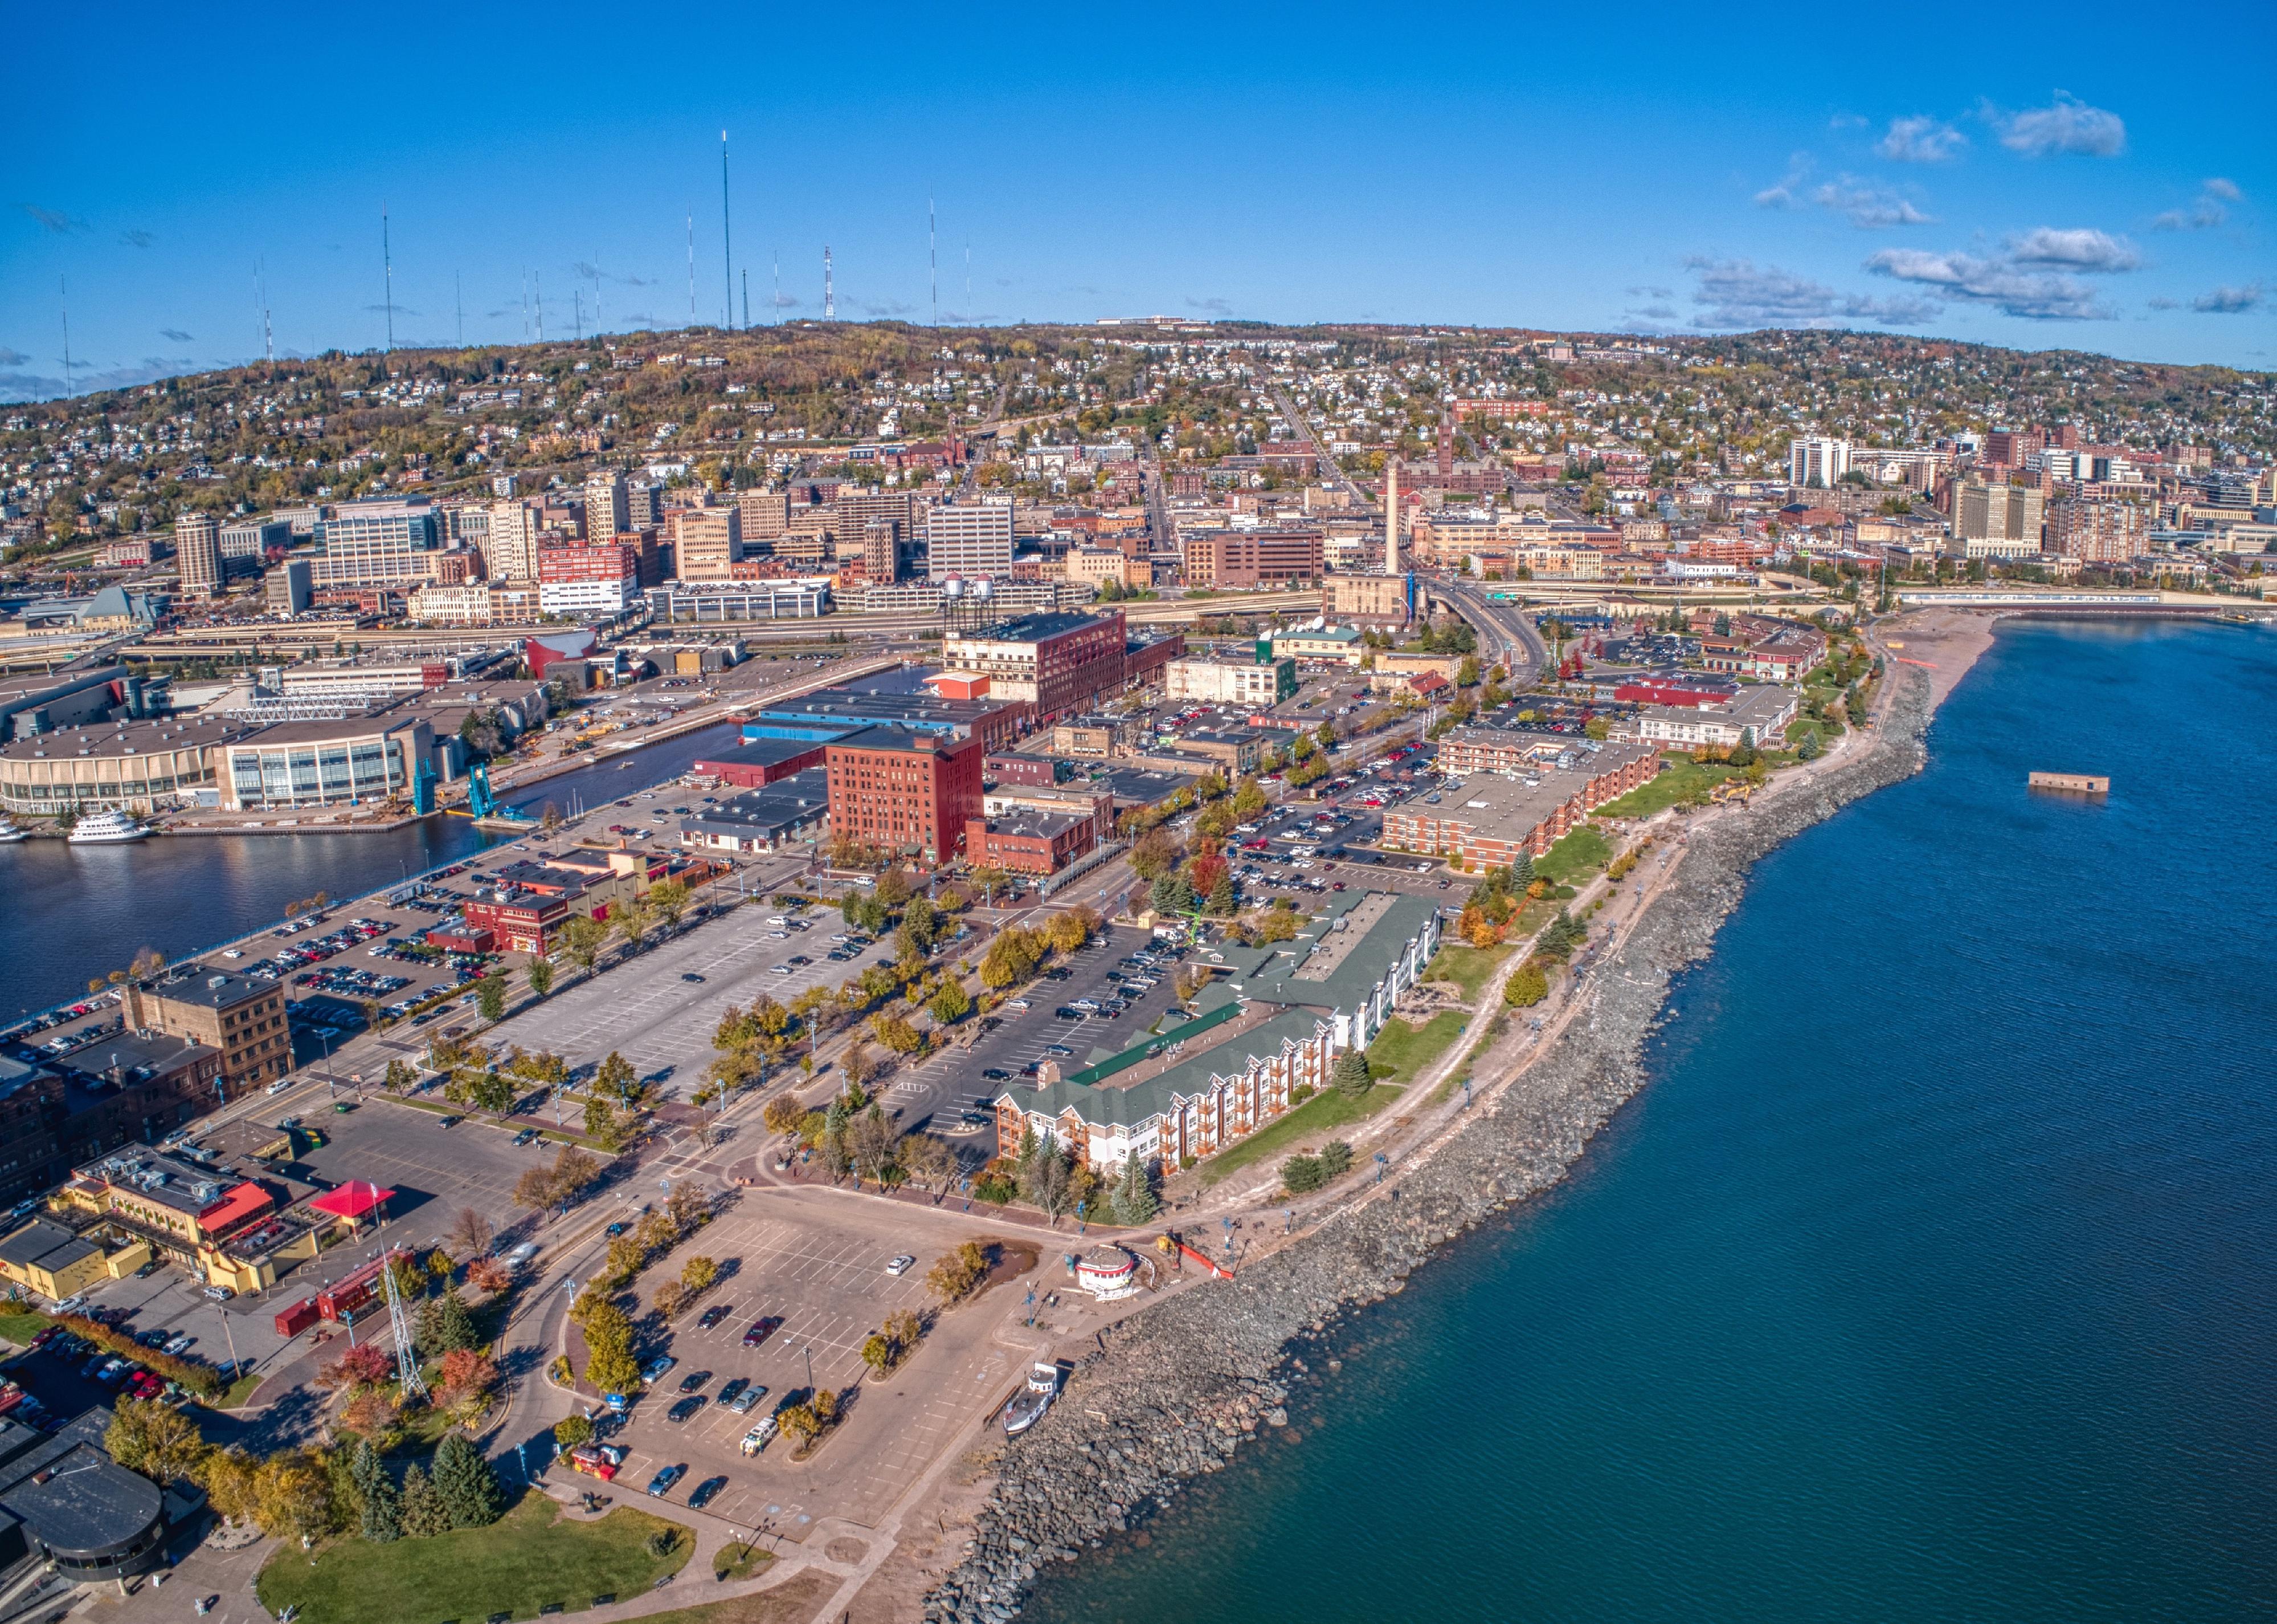
#26. Duluth, Minnesota
Aerial view of the popular Canal Park Area of Duluth.
– Total homes in metro area: 150,938
– Total unoccupied homes: 25,942 (17.2% of total)
— Homes for rent: 2,000 (1.3% of total)
— Homes rented but not occupied: 747 (2.9% of unoccupied homes)
— Homes for sale: 605 (0.4% of total)
— Homes sold, but not occupied: 543 (2.1% of unoccupied homes)
— Homes for occasional, recreational, or seasonal use: 16,122 (62.1% of unoccupied homes)
— Homes for migrant workers: 0 (0.0% of unoccupied homes)
— Other vacant homes: 5,925 (22.8% of unoccupied homes)
Canva
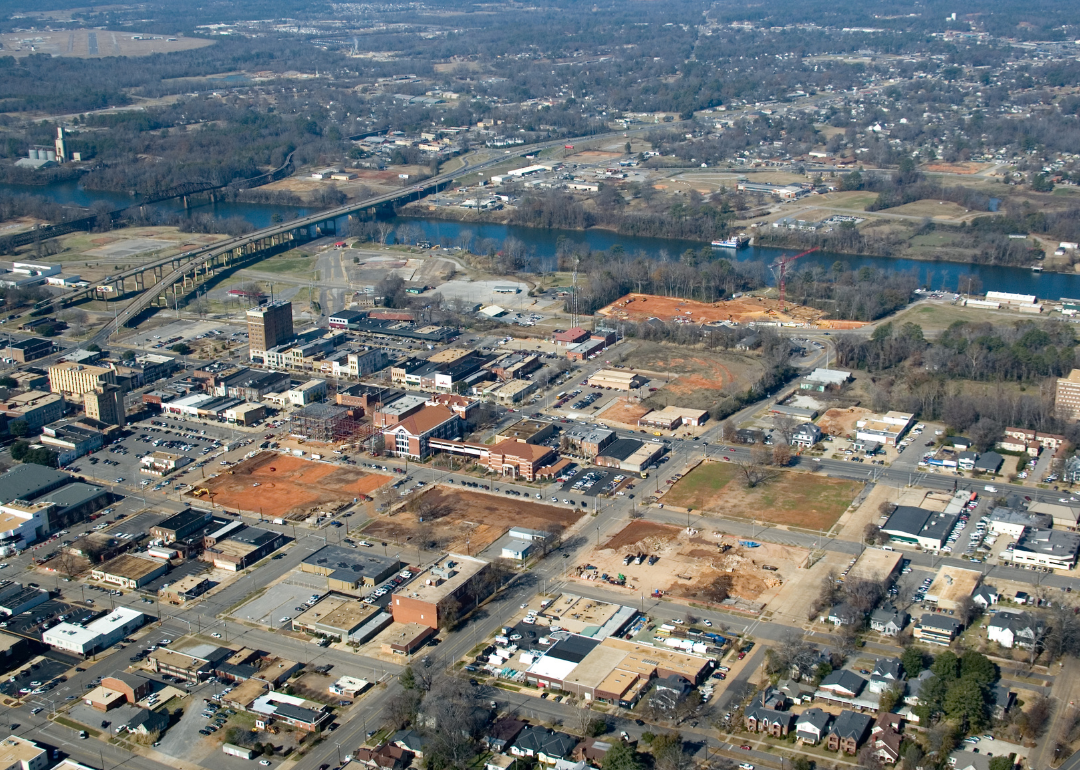
#25. Tuscaloosa, Alabama
An aerial view of Tuscaloosa.
– Total homes in metro area: 123,273
– Total unoccupied homes: 21,448 (17.4% of total)
— Homes for rent: 2,417 (2.0% of total)
— Homes rented but not occupied: 749 (3.5% of unoccupied homes)
— Homes for sale: 216 (0.2% of total)
— Homes sold, but not occupied: 537 (2.5% of unoccupied homes)
— Homes for occasional, recreational, or seasonal use: 10,157 (47.4% of unoccupied homes)
— Homes for migrant workers: 0 (0.0% of unoccupied homes)
— Other vacant homes: 7,372 (34.4% of unoccupied homes)
Noah Densmore // Shutterstock
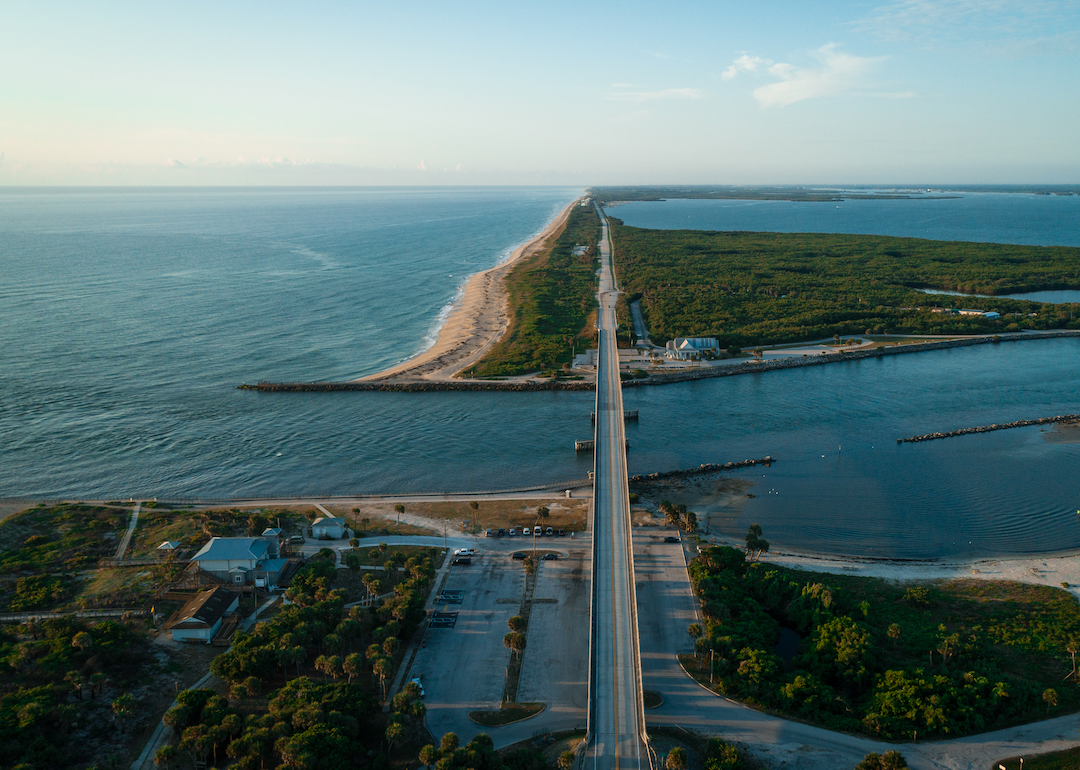
#24. Sebastian, Florida
A road stretches a cross a causeway in Florida.
– Total homes in metro area: 84,979
– Total unoccupied homes: 15,005 (17.7% of total)
— Homes for rent: 1,526 (1.8% of total)
— Homes rented but not occupied: 136 (0.9% of unoccupied homes)
— Homes for sale: 1,714 (2.0% of total)
— Homes sold, but not occupied: 526 (3.5% of unoccupied homes)
— Homes for occasional, recreational, or seasonal use: 8,516 (56.8% of unoccupied homes)
— Homes for migrant workers: 0 (0.0% of unoccupied homes)
— Other vacant homes: 2,587 (17.2% of unoccupied homes)
LMPark Photos // Shutterstock
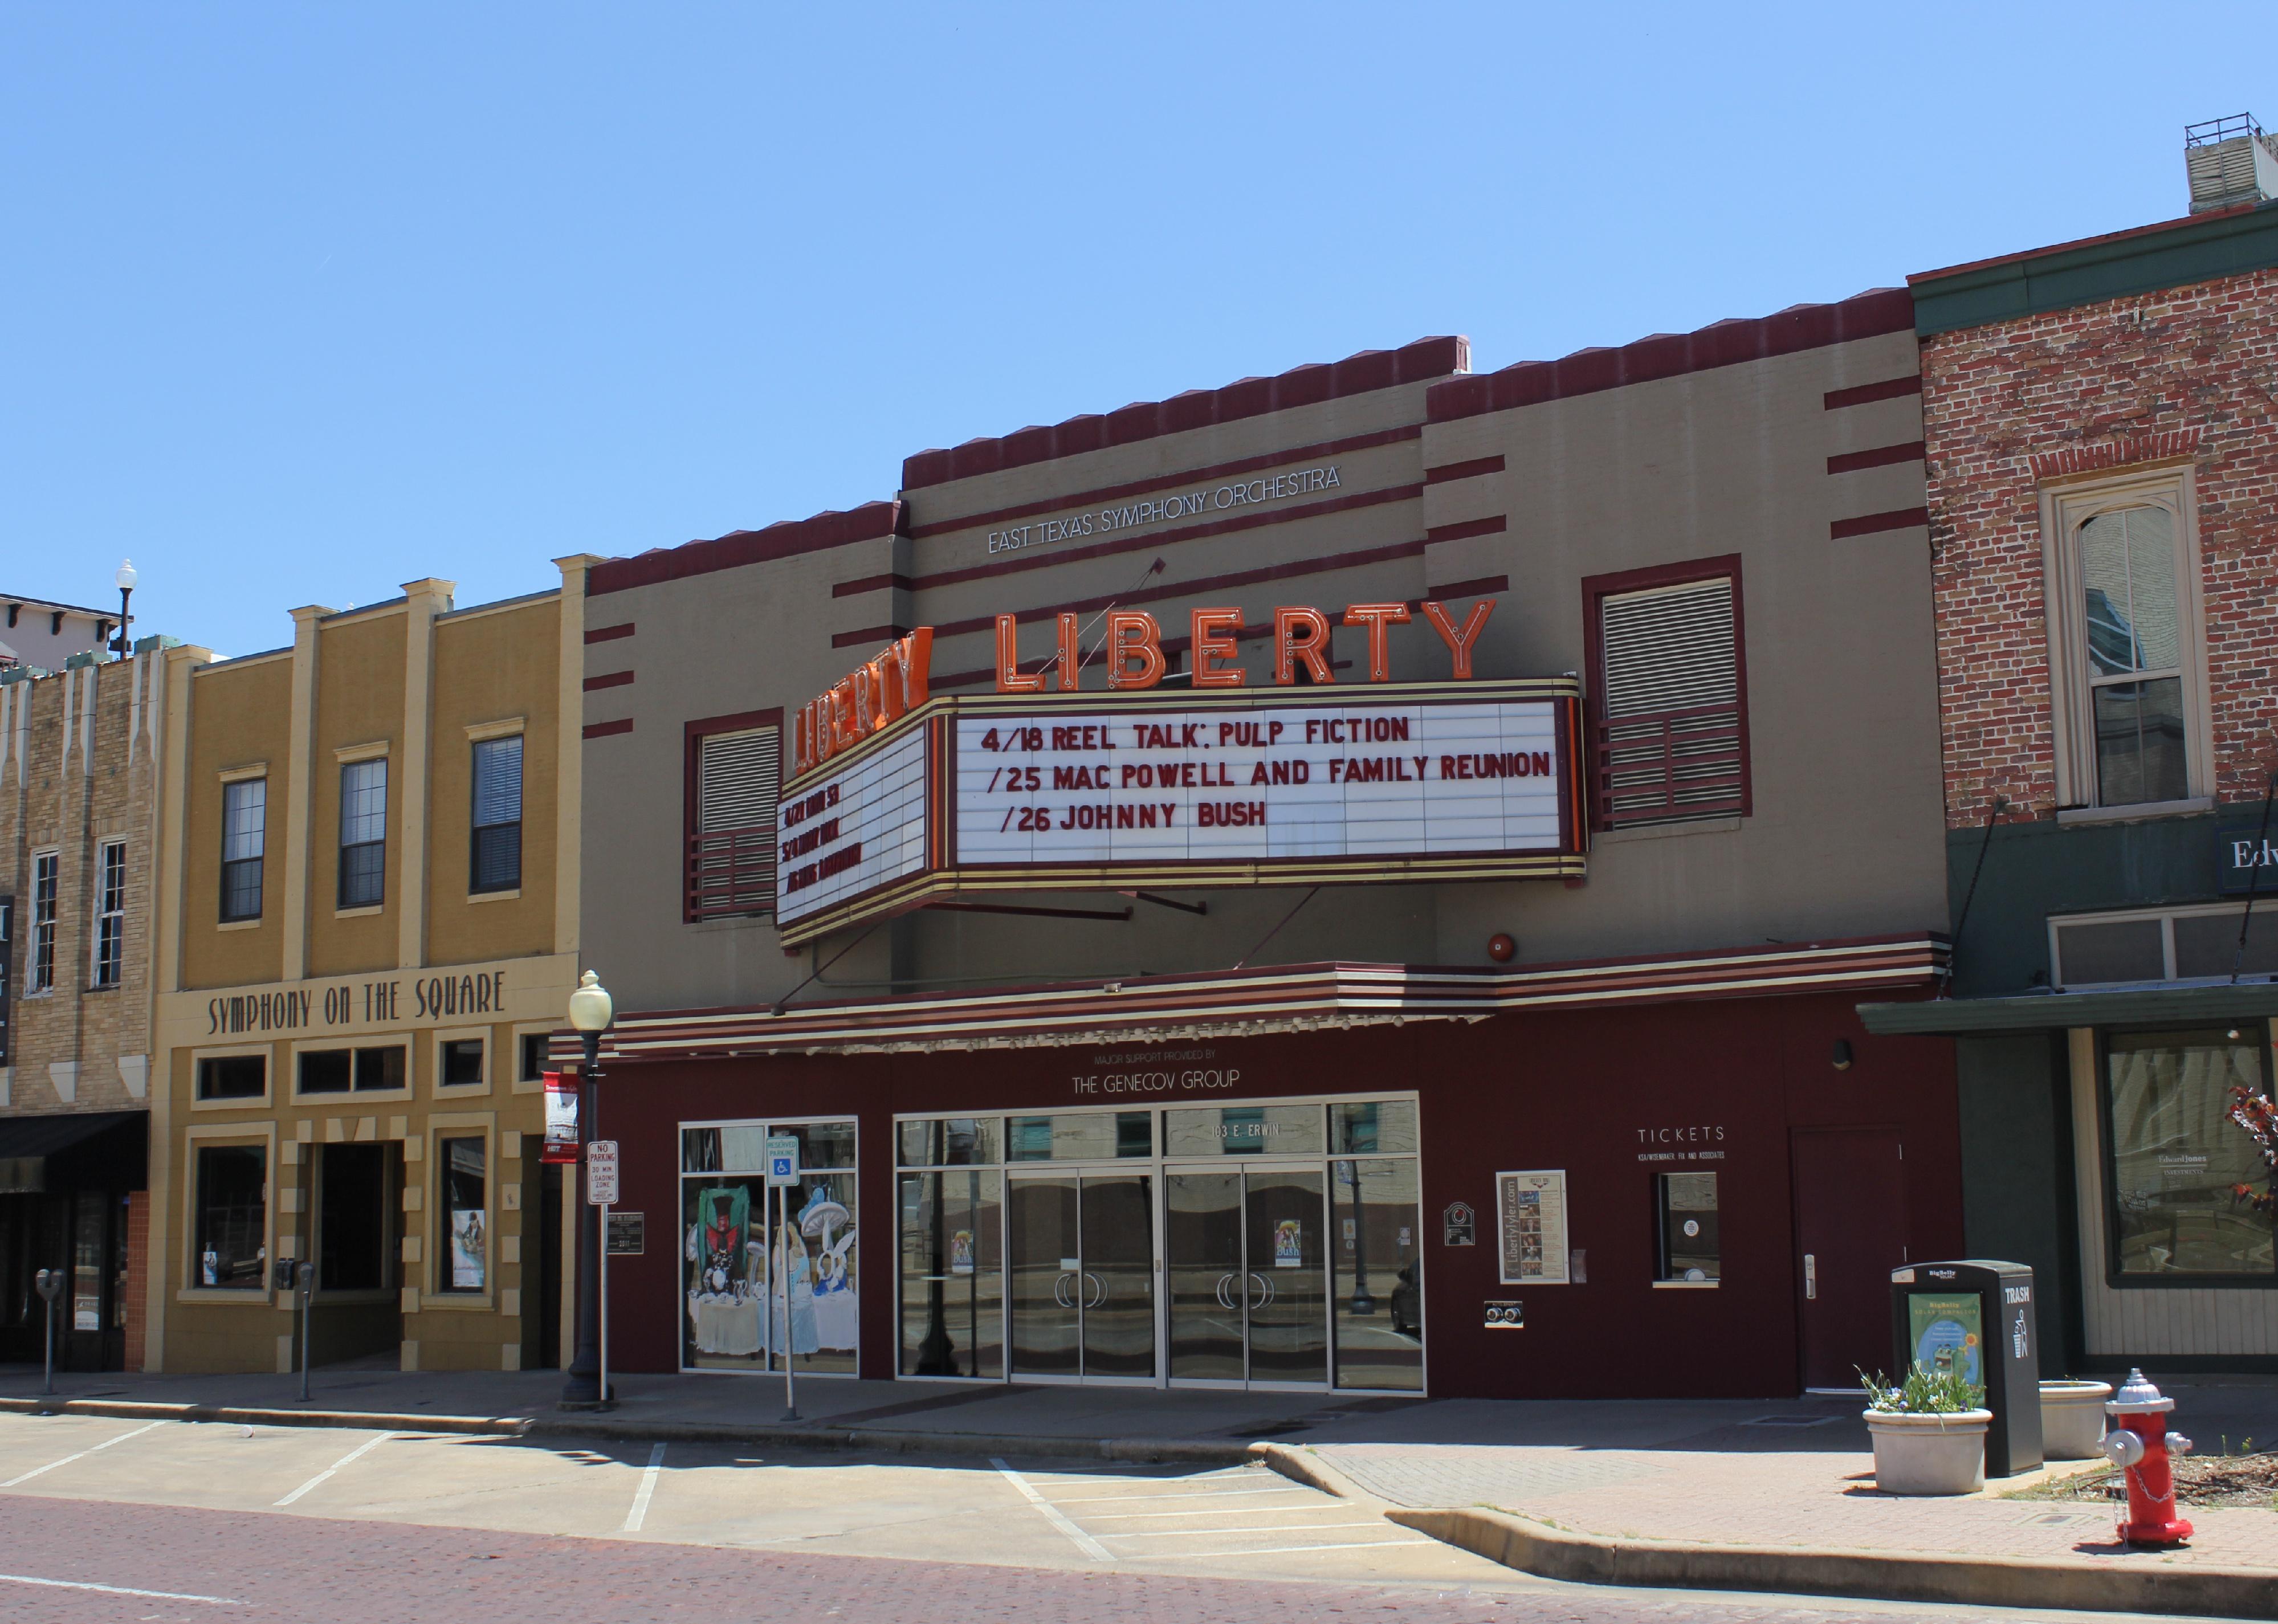
#23. Tyler, Texas
Liberty Theater and East Texas Symphony located in downtown Tyler.
– Total homes in metro area: 98,656
– Total unoccupied homes: 17,481 (17.7% of total)
— Homes for rent: 5,827 (5.9% of total)
— Homes rented but not occupied: 196 (1.1% of unoccupied homes)
— Homes for sale: 270 (0.3% of total)
— Homes sold, but not occupied: 404 (2.3% of unoccupied homes)
— Homes for occasional, recreational, or seasonal use: 620 (3.5% of unoccupied homes)
— Homes for migrant workers: 0 (0.0% of unoccupied homes)
— Other vacant homes: 10,164 (58.1% of unoccupied homes)
Sabrina Janelle Gordon // Shutterstock
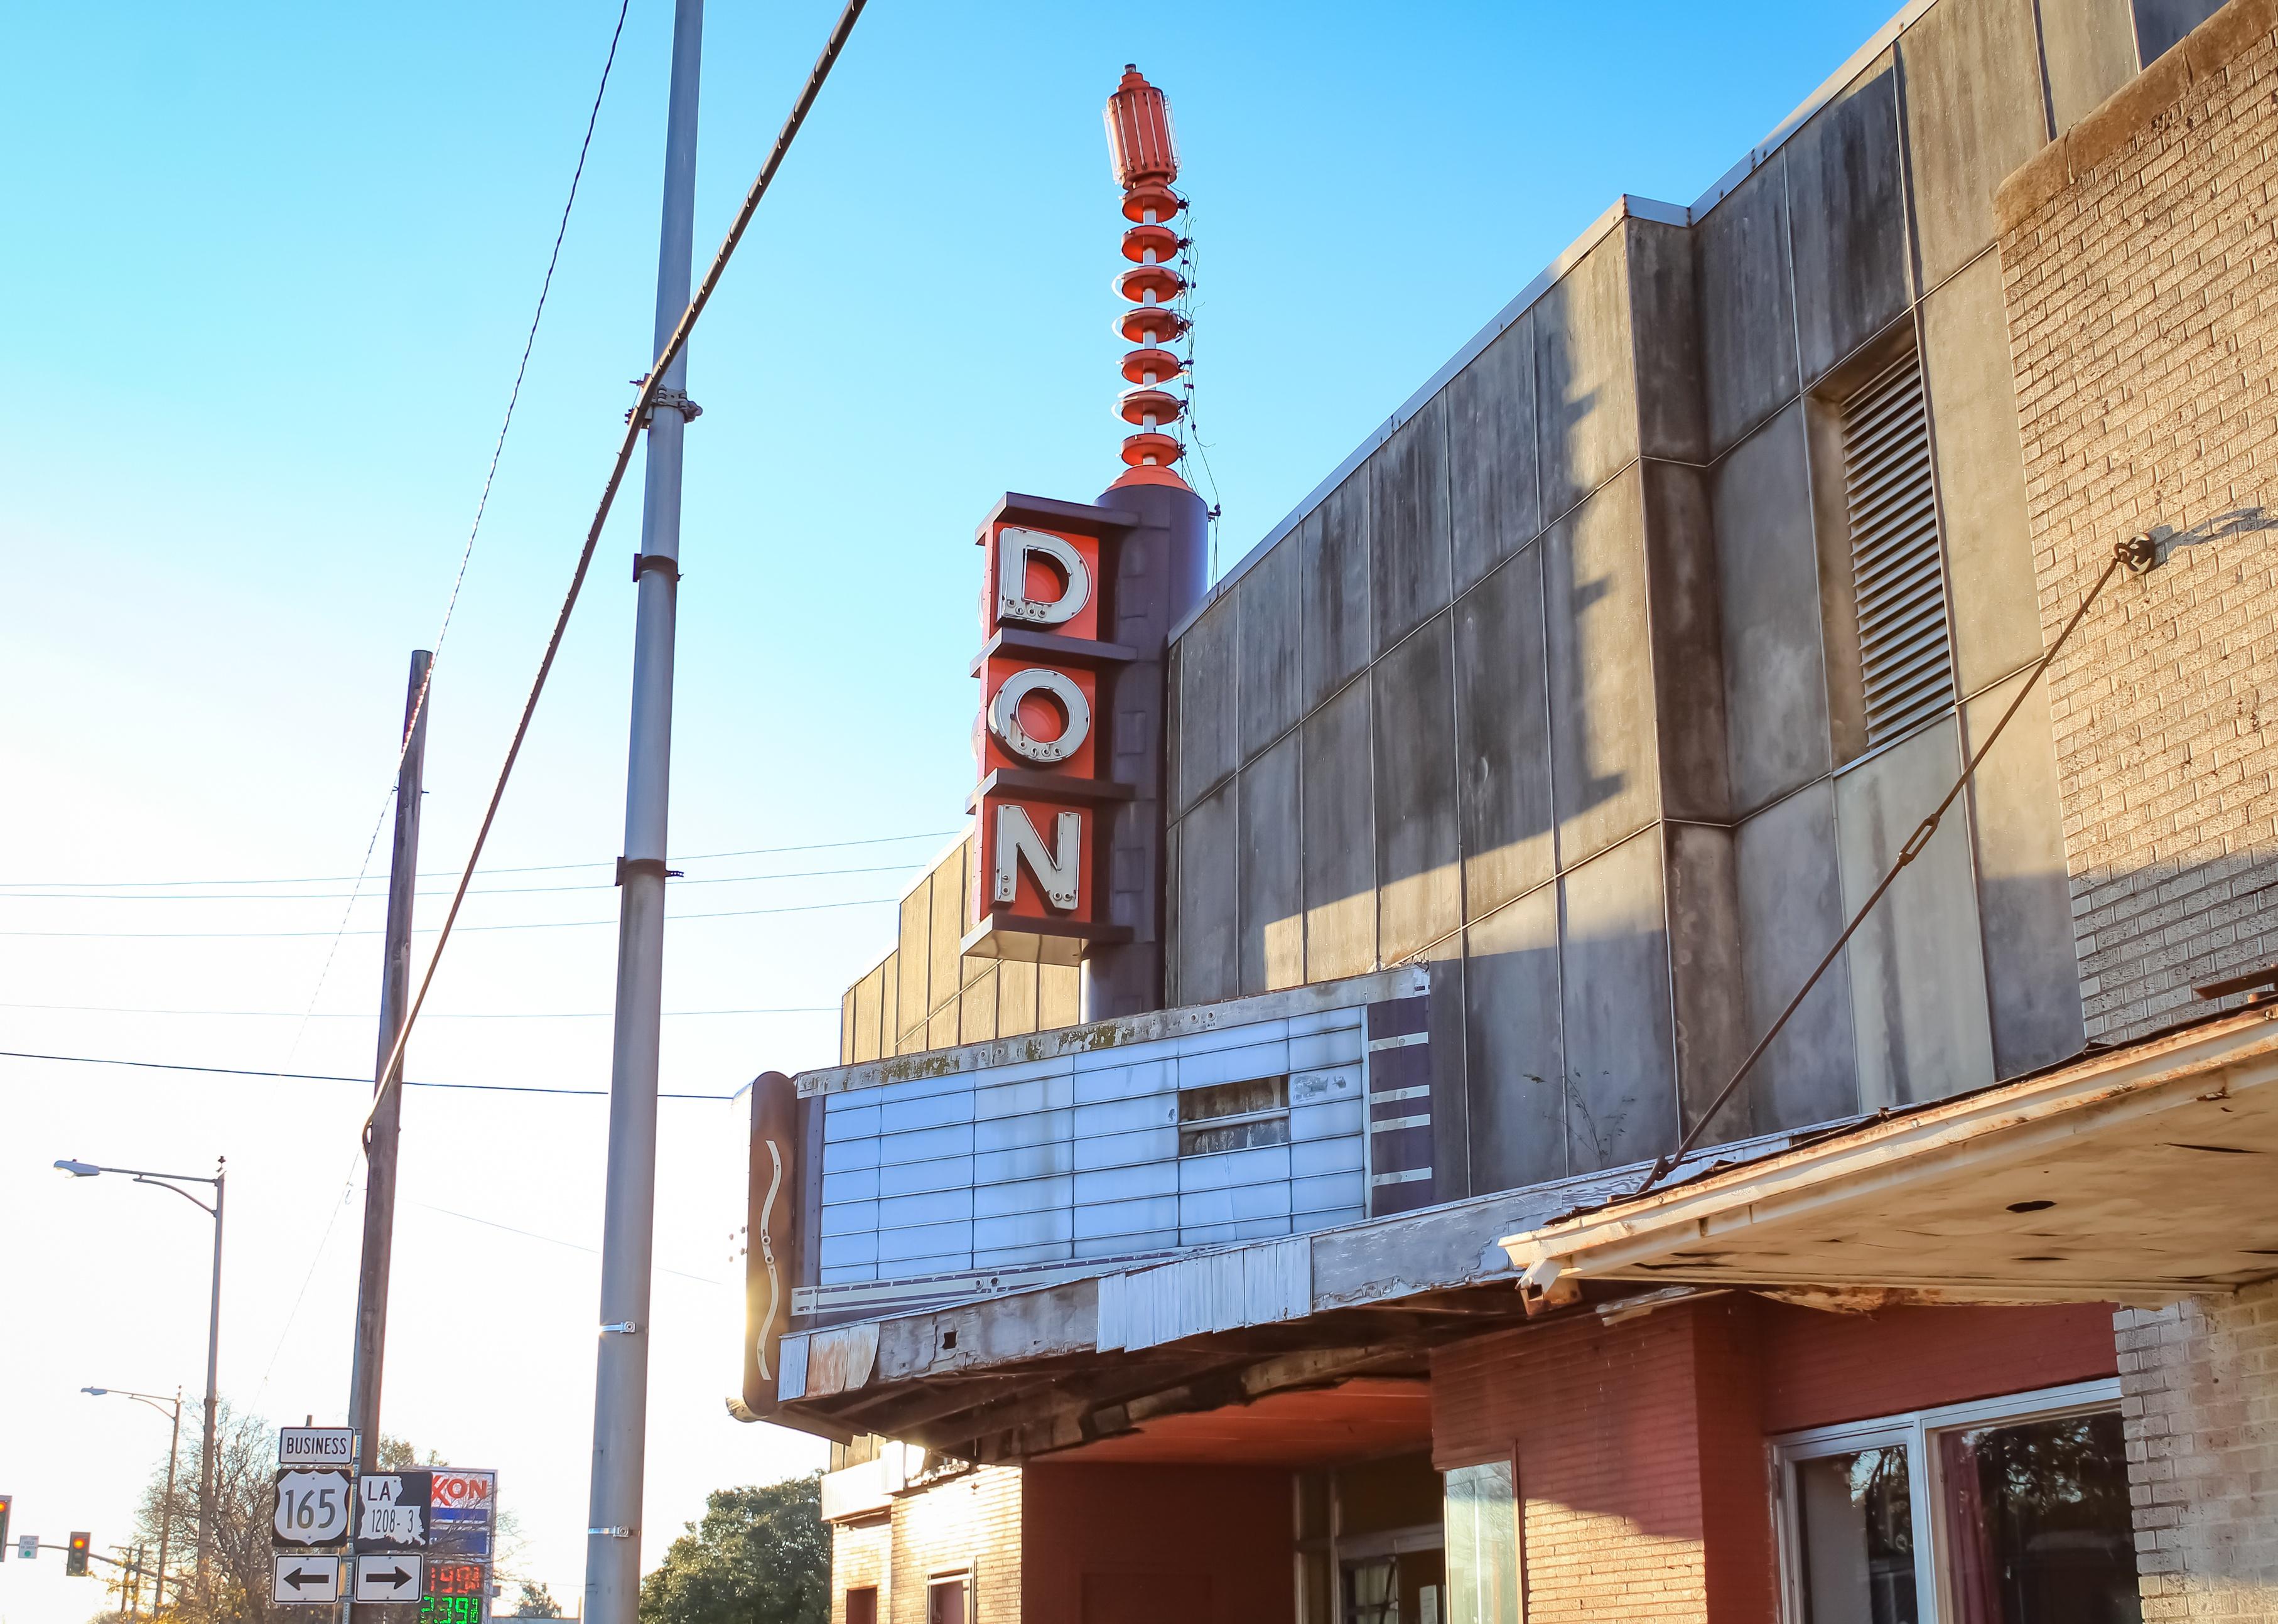
#22. Alexandria, Louisiana
Alexandria abandoned building.
– Total homes in metro area: 67,329
– Total unoccupied homes: 12,080 (17.9% of total)
— Homes for rent: 1,801 (2.7% of total)
— Homes rented but not occupied: 0 (0.0% of unoccupied homes)
— Homes for sale: 323 (0.5% of total)
— Homes sold, but not occupied: 1,203 (10.0% of unoccupied homes)
— Homes for occasional, recreational, or seasonal use: 691 (5.7% of unoccupied homes)
— Homes for migrant workers: 0 (0.0% of unoccupied homes)
— Other vacant homes: 8,062 (66.7% of unoccupied homes)

Sean Pavone // Shutterstock
#21. Macon, Georgia
Downtown Macon cityscape.
– Total homes in metro area: 105,240
– Total unoccupied homes: 19,480 (18.5% of total)
— Homes for rent: 5,654 (5.4% of total)
— Homes rented but not occupied: 992 (5.1% of unoccupied homes)
— Homes for sale: 705 (0.7% of total)
— Homes sold, but not occupied: 3,422 (17.6% of unoccupied homes)
— Homes for occasional, recreational, or seasonal use: 656 (3.4% of unoccupied homes)
— Homes for migrant workers: 0 (0.0% of unoccupied homes)
— Other vacant homes: 8,051 (41.3% of unoccupied homes)

Talmon Murphy Jr // Shutterstock
#20. Gadsden, Alabama
Gadsden Alabama bridge over Coosa River.
– Total homes in metro area: 47,420
– Total unoccupied homes: 9,414 (19.9% of total)
— Homes for rent: 409 (0.9% of total)
— Homes rented but not occupied: 139 (1.5% of unoccupied homes)
— Homes for sale: 680 (1.4% of total)
— Homes sold, but not occupied: 544 (5.8% of unoccupied homes)
— Homes for occasional, recreational, or seasonal use: 621 (6.6% of unoccupied homes)
— Homes for migrant workers: 0 (0.0% of unoccupied homes)
— Other vacant homes: 7,021 (74.6% of unoccupied homes)
Tim Roberts Photography // Shutterstock
#19. Yuma, Arizona
An aerial view of Yuma.
– Total homes in metro area: 93,797
– Total unoccupied homes: 18,816 (20.1% of total)
— Homes for rent: 688 (0.7% of total)
— Homes rented but not occupied: 556 (3.0% of unoccupied homes)
— Homes for sale: 455 (0.5% of total)
— Homes sold, but not occupied: 541 (2.9% of unoccupied homes)
— Homes for occasional, recreational, or seasonal use: 13,575 (72.1% of unoccupied homes)
— Homes for migrant workers: 568 (3.0% of unoccupied homes)
— Other vacant homes: 2,433 (12.9% of unoccupied homes)
Canva
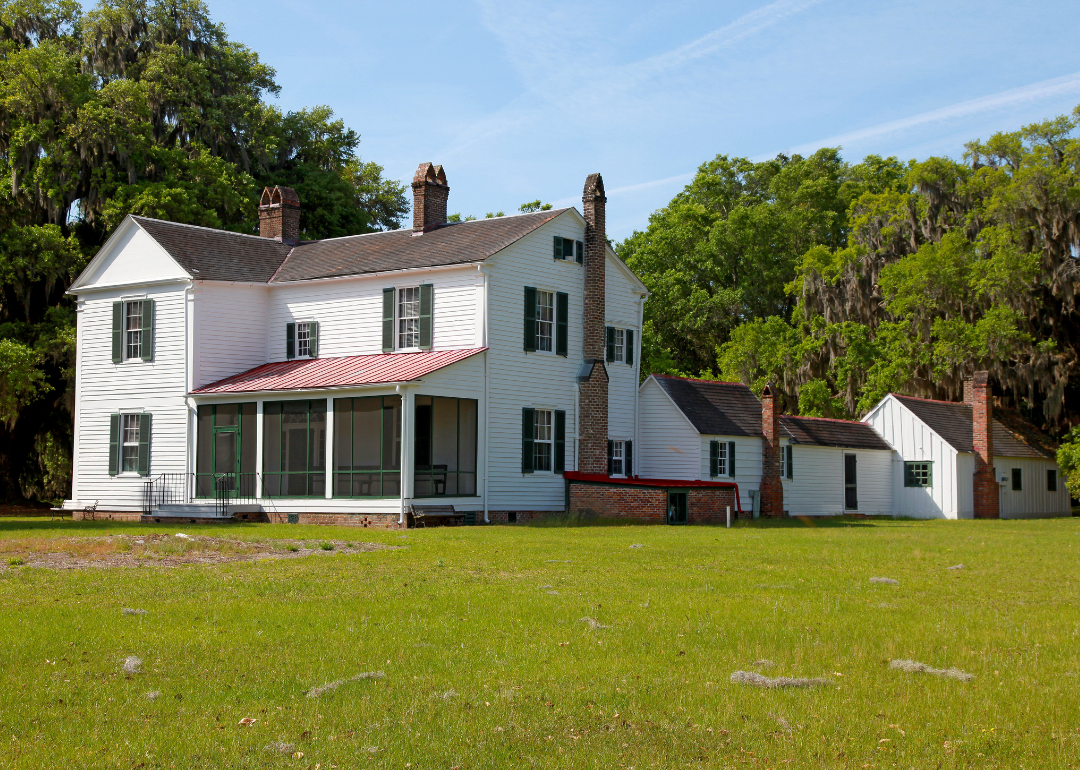
#18. Brunswick, Georgia
A white farm house in a rural setting.
– Total homes in metro area: 59,063
– Total unoccupied homes: 12,300 (20.8% of total)
— Homes for rent: 1,258 (2.1% of total)
— Homes rented but not occupied: 0 (0.0% of unoccupied homes)
— Homes for sale: 504 (0.9% of total)
— Homes sold, but not occupied: 538 (4.4% of unoccupied homes)
— Homes for occasional, recreational, or seasonal use: 5,116 (41.6% of unoccupied homes)
— Homes for migrant workers: 0 (0.0% of unoccupied homes)
— Other vacant homes: 4,884 (39.7% of unoccupied homes)
James Casil // Shutterstock
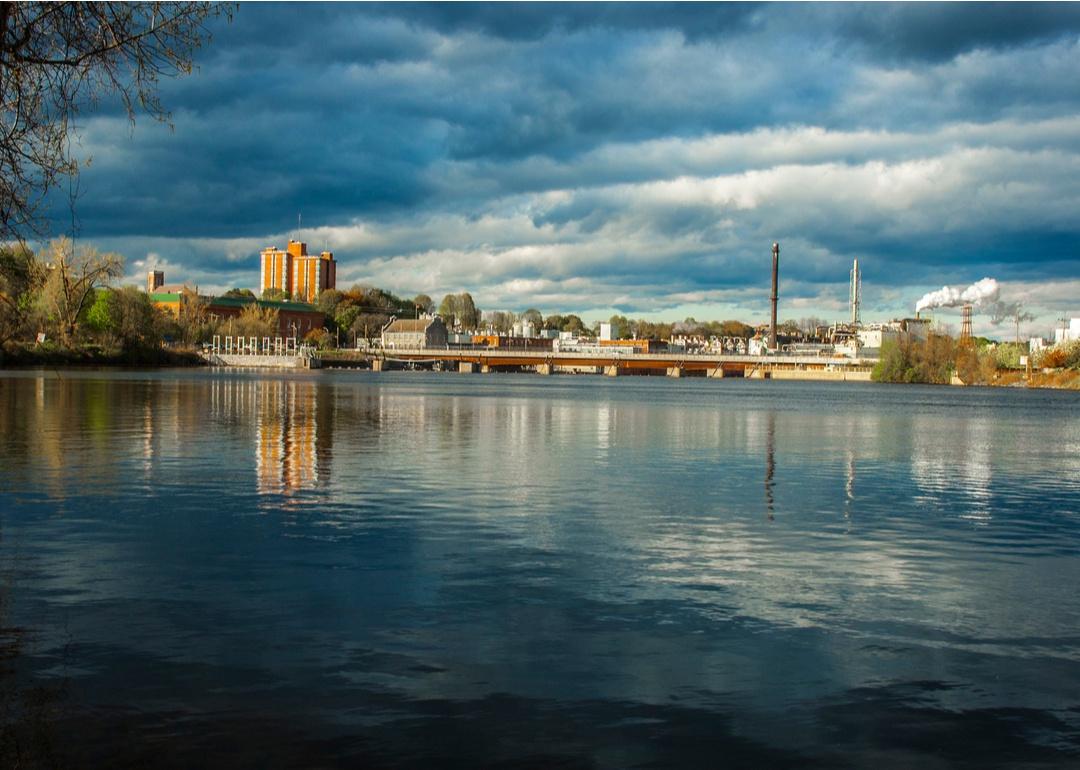
#17. Glens Falls, New York
A view across the water of Glens Falls.
– Total homes in metro area: 69,245
– Total unoccupied homes: 14,663 (21.2% of total)
— Homes for rent: 668 (1.0% of total)
— Homes rented but not occupied: 0 (0.0% of unoccupied homes)
— Homes for sale: 513 (0.7% of total)
— Homes sold, but not occupied: 208 (1.4% of unoccupied homes)
— Homes for occasional, recreational, or seasonal use: 10,933 (74.6% of unoccupied homes)
— Homes for migrant workers: 0 (0.0% of unoccupied homes)
— Other vacant homes: 2,341 (16.0% of unoccupied homes)
Wangkun Jia // Shutterstock
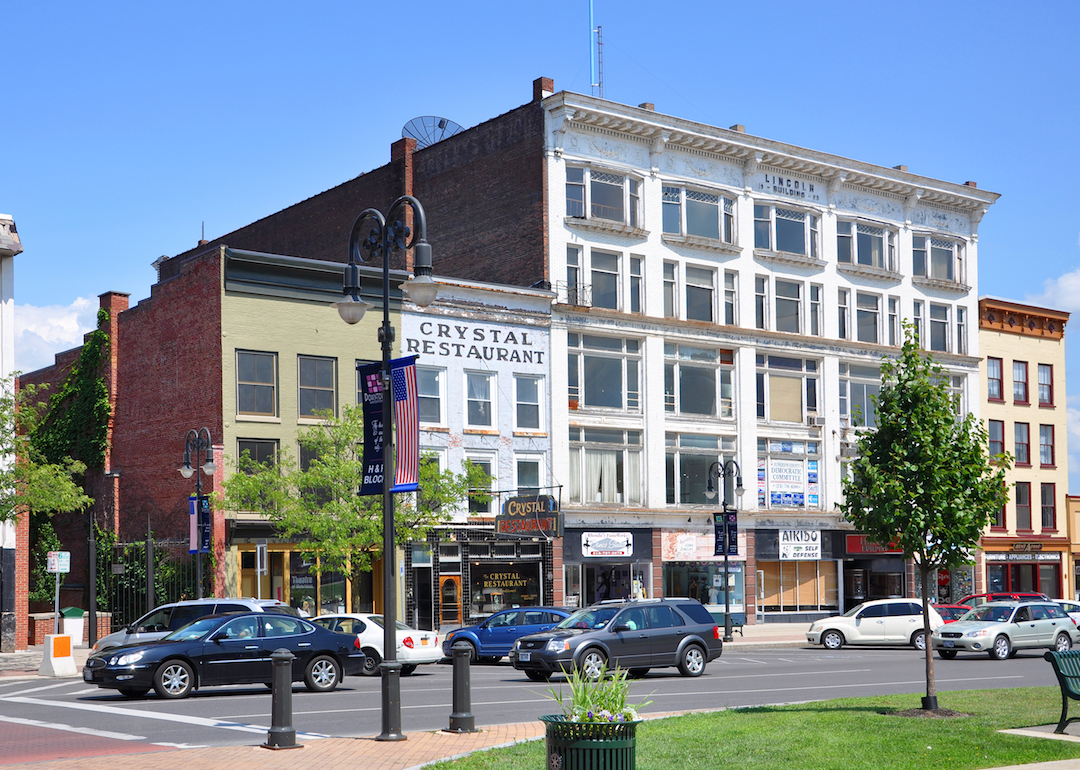
#16. Watertown, New York
Commercial buildings in Watertown.
– Total homes in metro area: 61,714
– Total unoccupied homes: 13,086 (21.2% of total)
— Homes for rent: 489 (0.8% of total)
— Homes rented but not occupied: 0 (0.0% of unoccupied homes)
— Homes for sale: 1,039 (1.7% of total)
— Homes sold, but not occupied: 82 (0.6% of unoccupied homes)
— Homes for occasional, recreational, or seasonal use: 8,747 (66.8% of unoccupied homes)
— Homes for migrant workers: 0 (0.0% of unoccupied homes)
— Other vacant homes: 2,729 (20.9% of unoccupied homes)
Kevin Ruck // Shutterstock
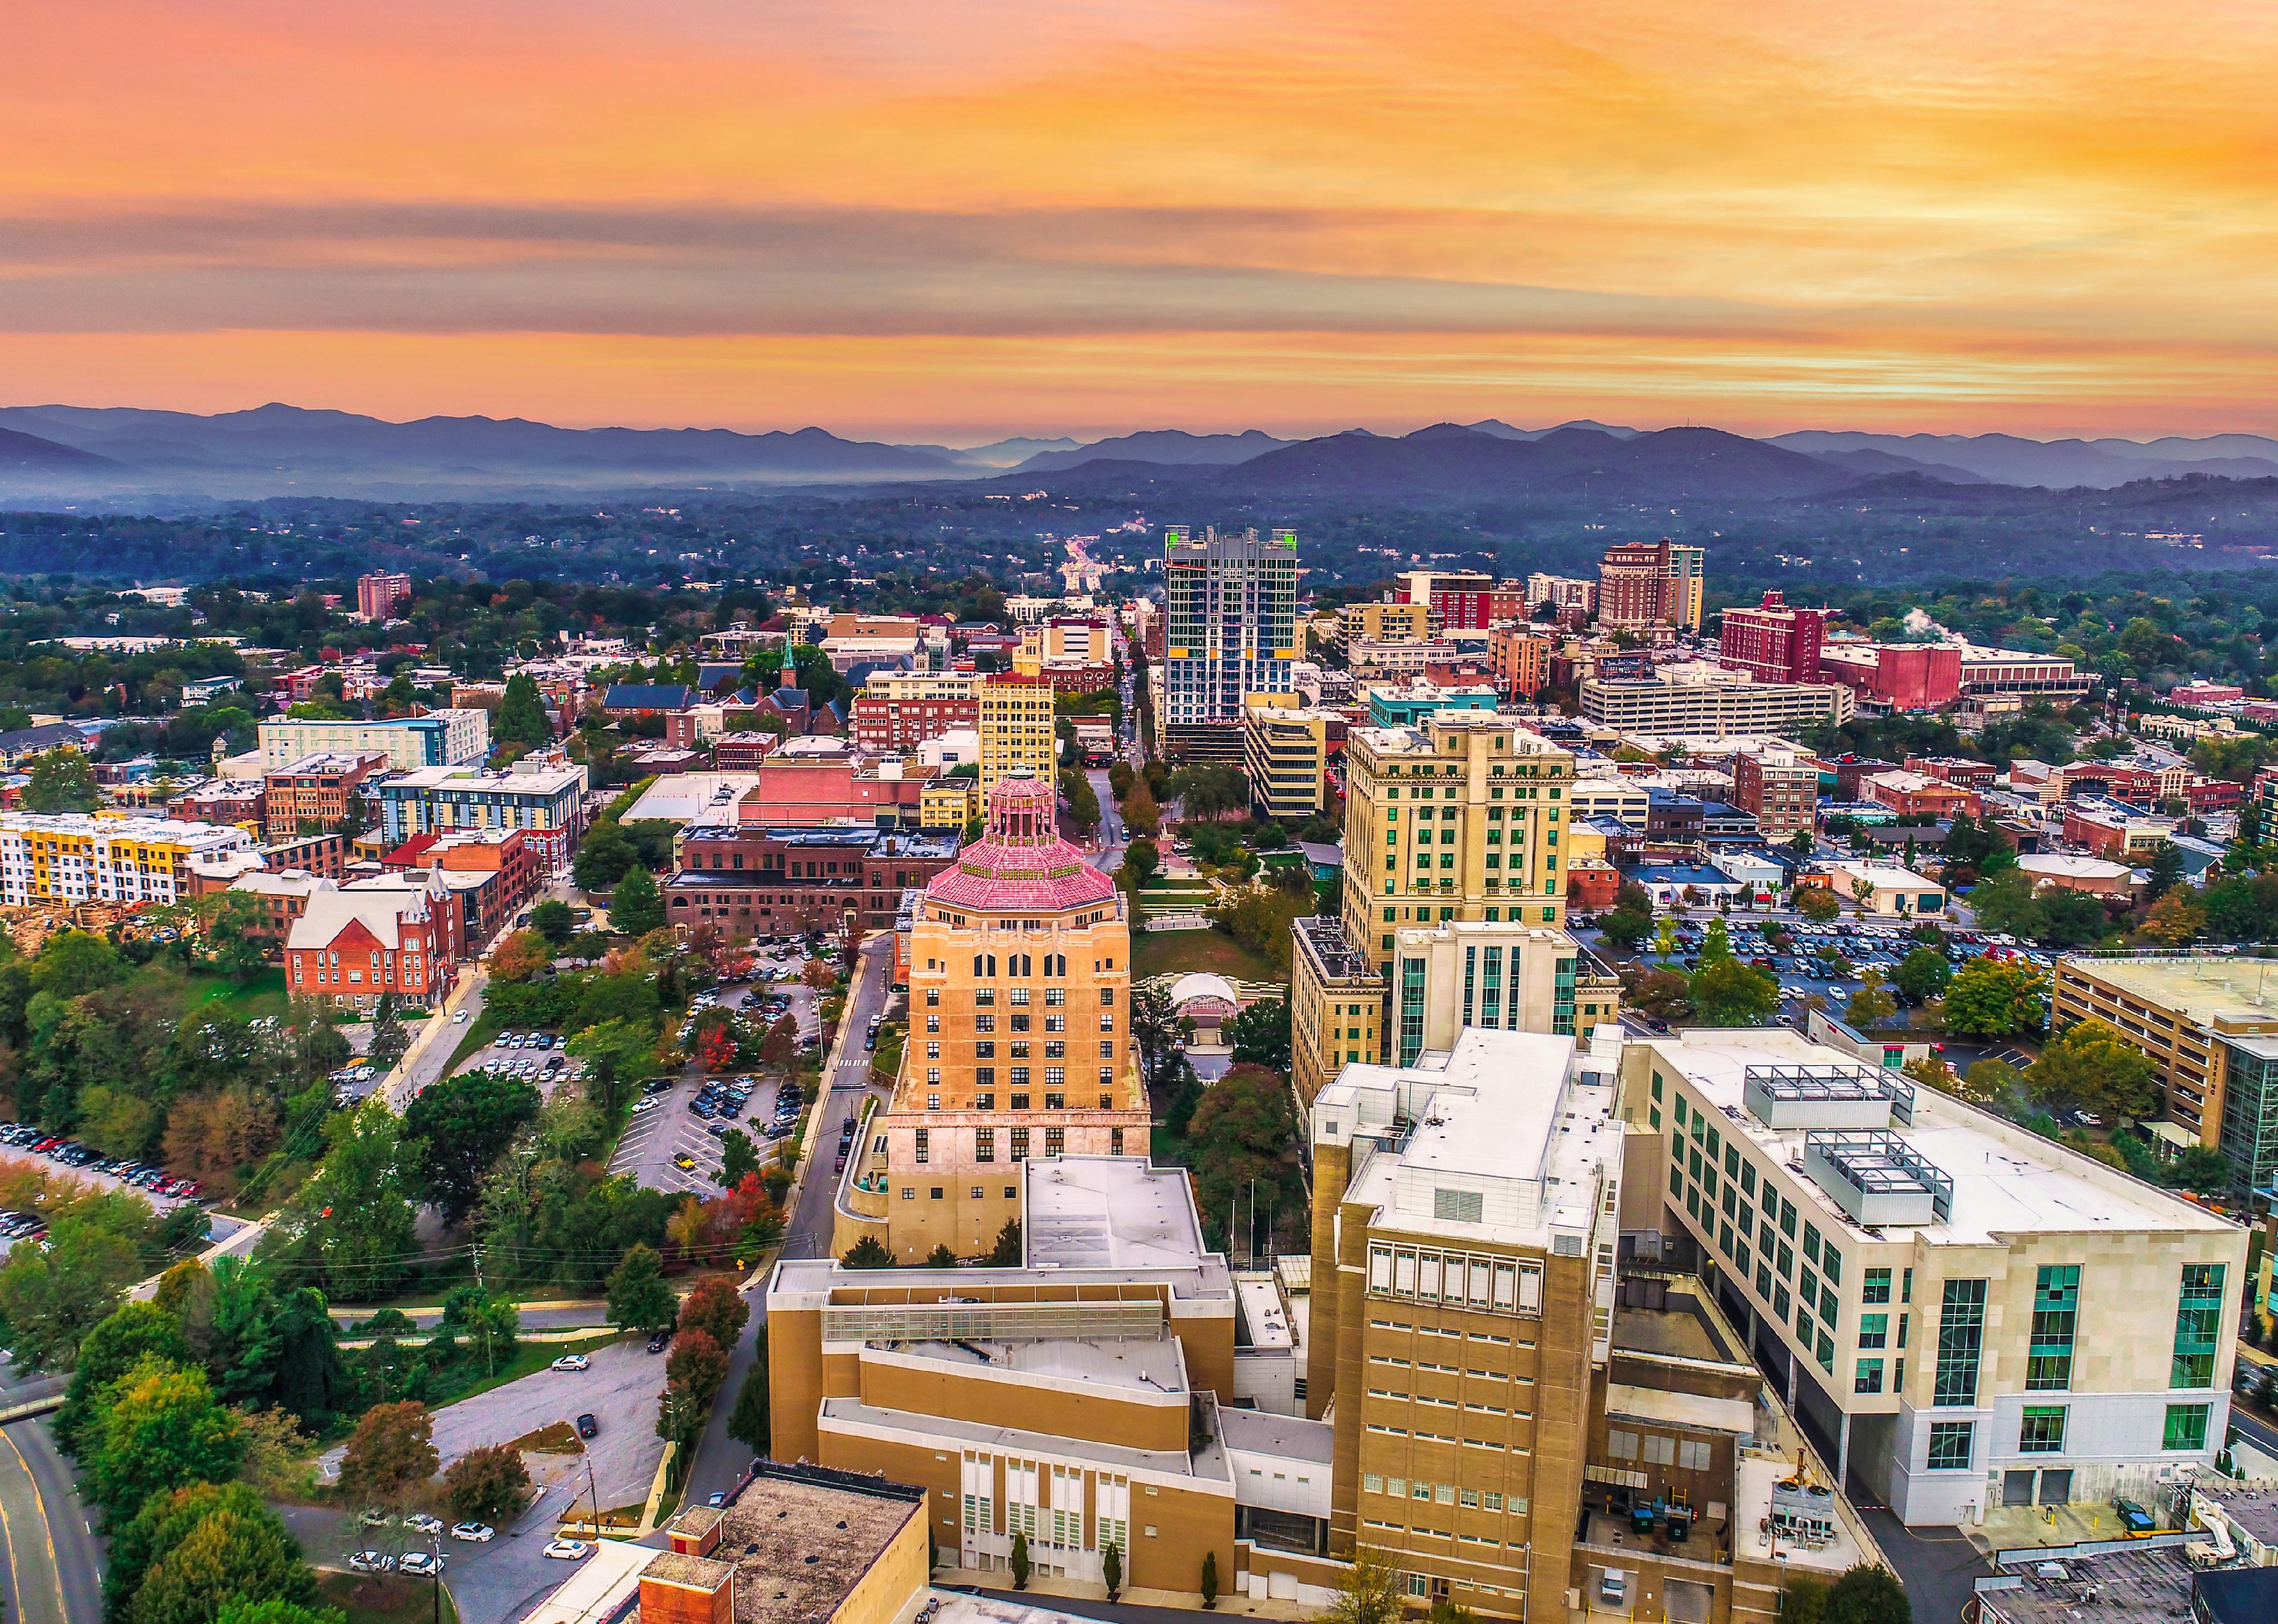
#15. Asheville, North Carolina
Downtown Asheville skyline.
– Total homes in metro area: 236,015
– Total unoccupied homes: 50,592 (21.4% of total)
— Homes for rent: 6,934 (2.9% of total)
— Homes rented but not occupied: 397 (0.8% of unoccupied homes)
— Homes for sale: 16,063 (6.8% of total)
— Homes sold, but not occupied: 1,885 (3.7% of unoccupied homes)
— Homes for occasional, recreational, or seasonal use: 11,820 (23.4% of unoccupied homes)
— Homes for migrant workers: 0 (0.0% of unoccupied homes)
— Other vacant homes: 13,493 (26.7% of unoccupied homes)
Roland Klose // Wikimedia Commons
#14. Pine Bluff, Arkansas
Pine Bluff Commercial Historic District.
– Total homes in metro area: 38,316
– Total unoccupied homes: 8,224 (21.5% of total)
— Homes for rent: 316 (0.8% of total)
— Homes rented but not occupied: 0 (0.0% of unoccupied homes)
— Homes for sale: 206 (0.5% of total)
— Homes sold, but not occupied: 326 (4.0% of unoccupied homes)
— Homes for occasional, recreational, or seasonal use: 1,413 (17.2% of unoccupied homes)
— Homes for migrant workers: 0 (0.0% of unoccupied homes)
— Other vacant homes: 5,963 (72.5% of unoccupied homes)
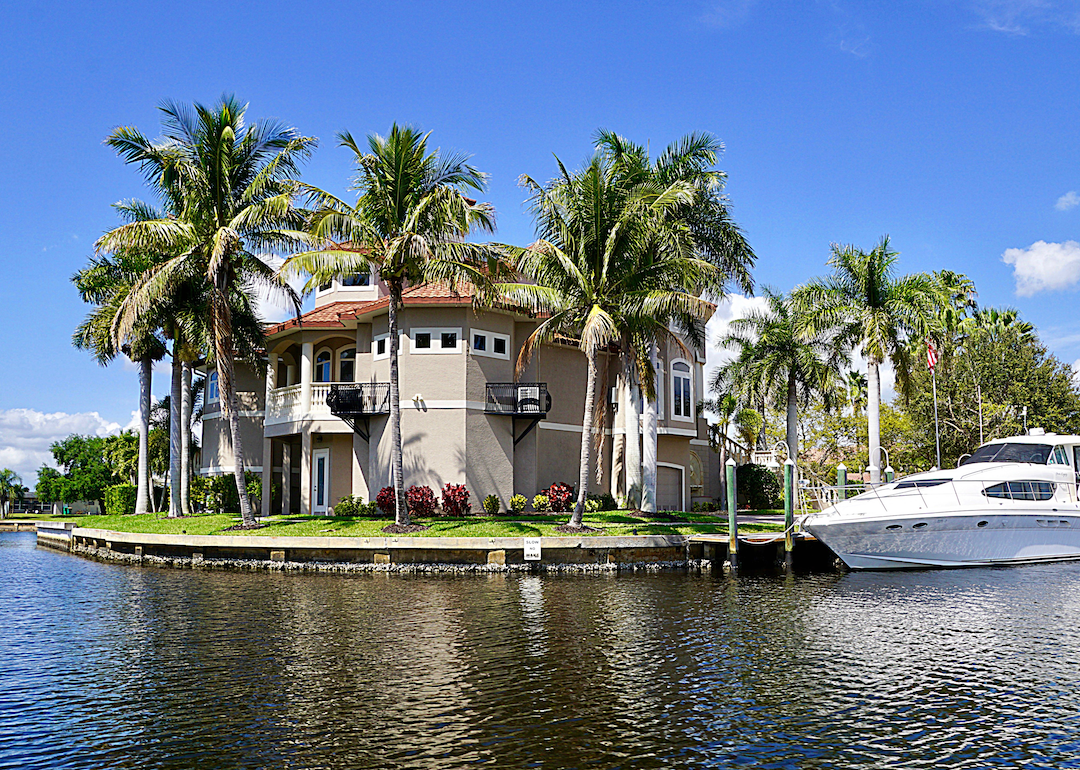
Carol Ann Mossa // Shutterstock
#13. Punta Gorda, Florida
A large home with palm trees and a yacht on a waterway.
– Total homes in metro area: 113,469
– Total unoccupied homes: 24,481 (21.6% of total)
— Homes for rent: 2,049 (1.8% of total)
— Homes rented but not occupied: 526 (2.1% of unoccupied homes)
— Homes for sale: 1,251 (1.1% of total)
— Homes sold, but not occupied: 1,169 (4.8% of unoccupied homes)
— Homes for occasional, recreational, or seasonal use: 16,976 (69.3% of unoccupied homes)
— Homes for migrant workers: 129 (0.5% of unoccupied homes)
— Other vacant homes: 2,381 (9.7% of unoccupied homes)
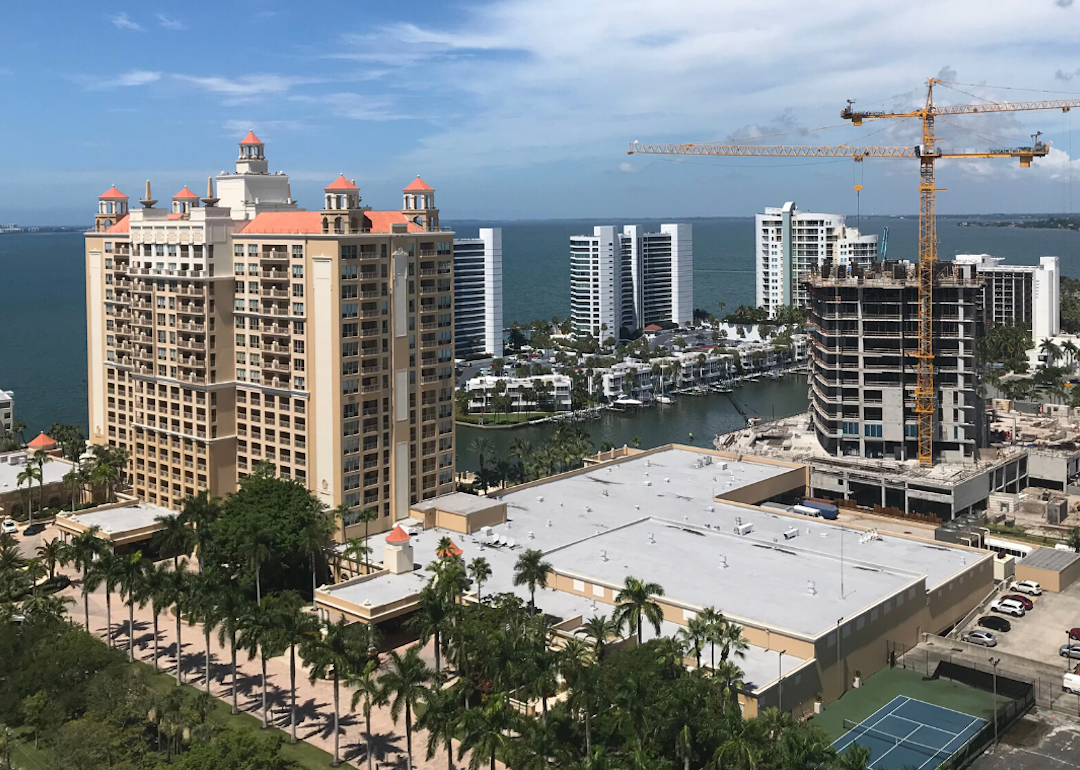
Pat McGinley // Shutterstock
#12. North Port, Florida
Apartment buildings under construction in North Port.
– Total homes in metro area: 471,288
– Total unoccupied homes: 103,750 (22.0% of total)
— Homes for rent: 11,962 (2.5% of total)
— Homes rented but not occupied: 2,430 (2.3% of unoccupied homes)
— Homes for sale: 3,462 (0.7% of total)
— Homes sold, but not occupied: 4,022 (3.9% of unoccupied homes)
— Homes for occasional, recreational, or seasonal use: 67,955 (65.5% of unoccupied homes)
— Homes for migrant workers: 283 (0.3% of unoccupied homes)
— Other vacant homes: 13,636 (13.1% of unoccupied homes)
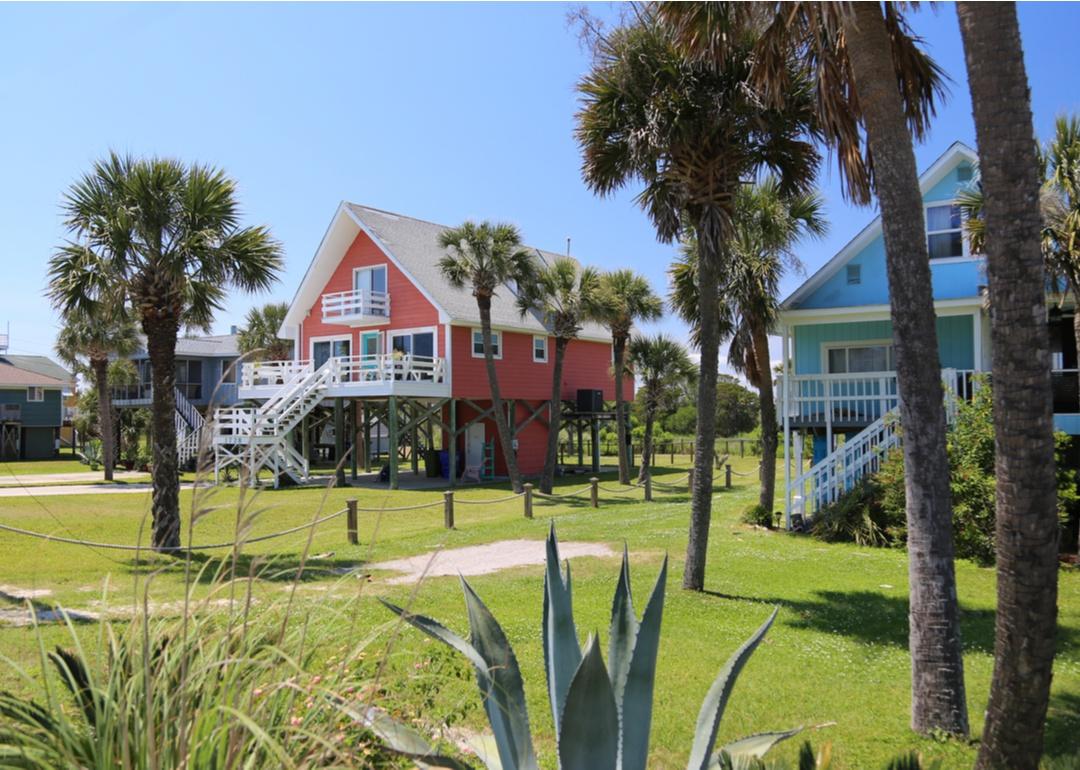
RudenkoStudio // Shutterstock
#11. Hilton Head Island, South Carolina
Pastel-colored, raised homes with palm trees.
– Total homes in metro area: 116,119
– Total unoccupied homes: 26,418 (22.8% of total)
— Homes for rent: 6,345 (5.5% of total)
— Homes rented but not occupied: 0 (0.0% of unoccupied homes)
— Homes for sale: 420 (0.4% of total)
— Homes sold, but not occupied: 332 (1.3% of unoccupied homes)
— Homes for occasional, recreational, or seasonal use: 16,399 (62.1% of unoccupied homes)
— Homes for migrant workers: 0 (0.0% of unoccupied homes)
— Other vacant homes: 2,922 (11.1% of unoccupied homes)
Canva
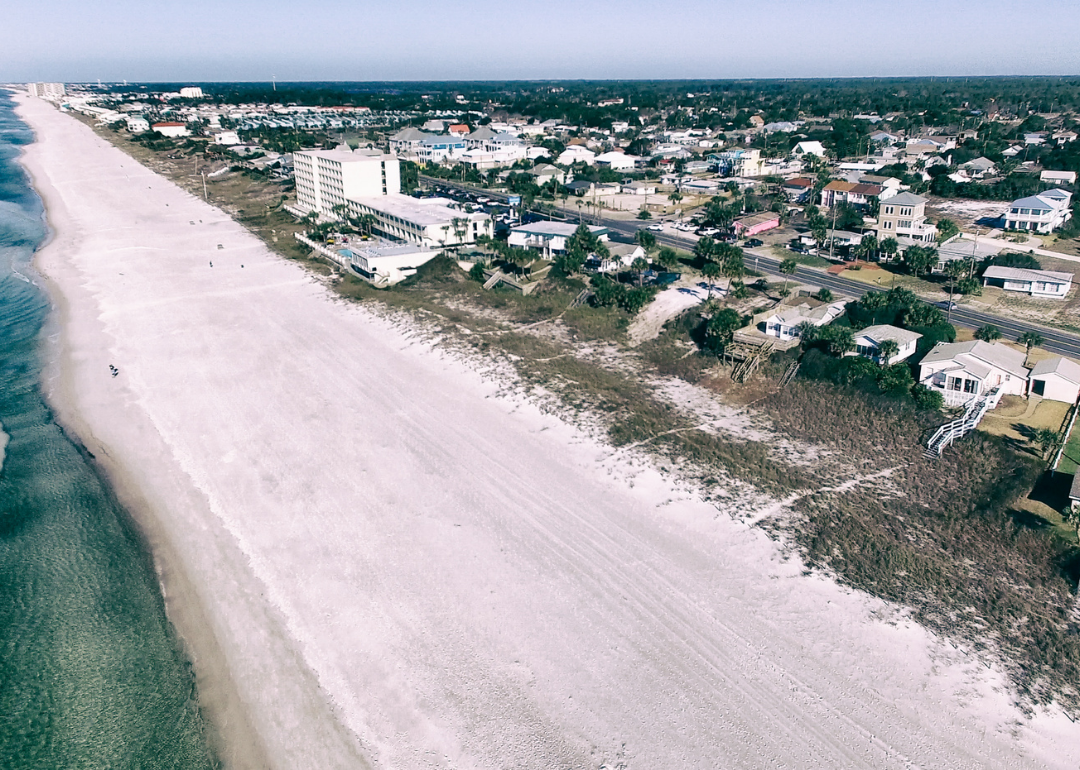
#10. Panama City, Florida
An aerial view on the beach in Panama City.
– Total homes in metro area: 106,144
– Total unoccupied homes: 26,612 (25.1% of total)
— Homes for rent: 737 (0.7% of total)
— Homes rented but not occupied: 196 (0.7% of unoccupied homes)
— Homes for sale: 948 (0.9% of total)
— Homes sold, but not occupied: 564 (2.1% of unoccupied homes)
— Homes for occasional, recreational, or seasonal use: 20,505 (77.1% of unoccupied homes)
— Homes for migrant workers: 0 (0.0% of unoccupied homes)
— Other vacant homes: 3,662 (13.8% of unoccupied homes)
Jacob Boomsma // Shutterstock
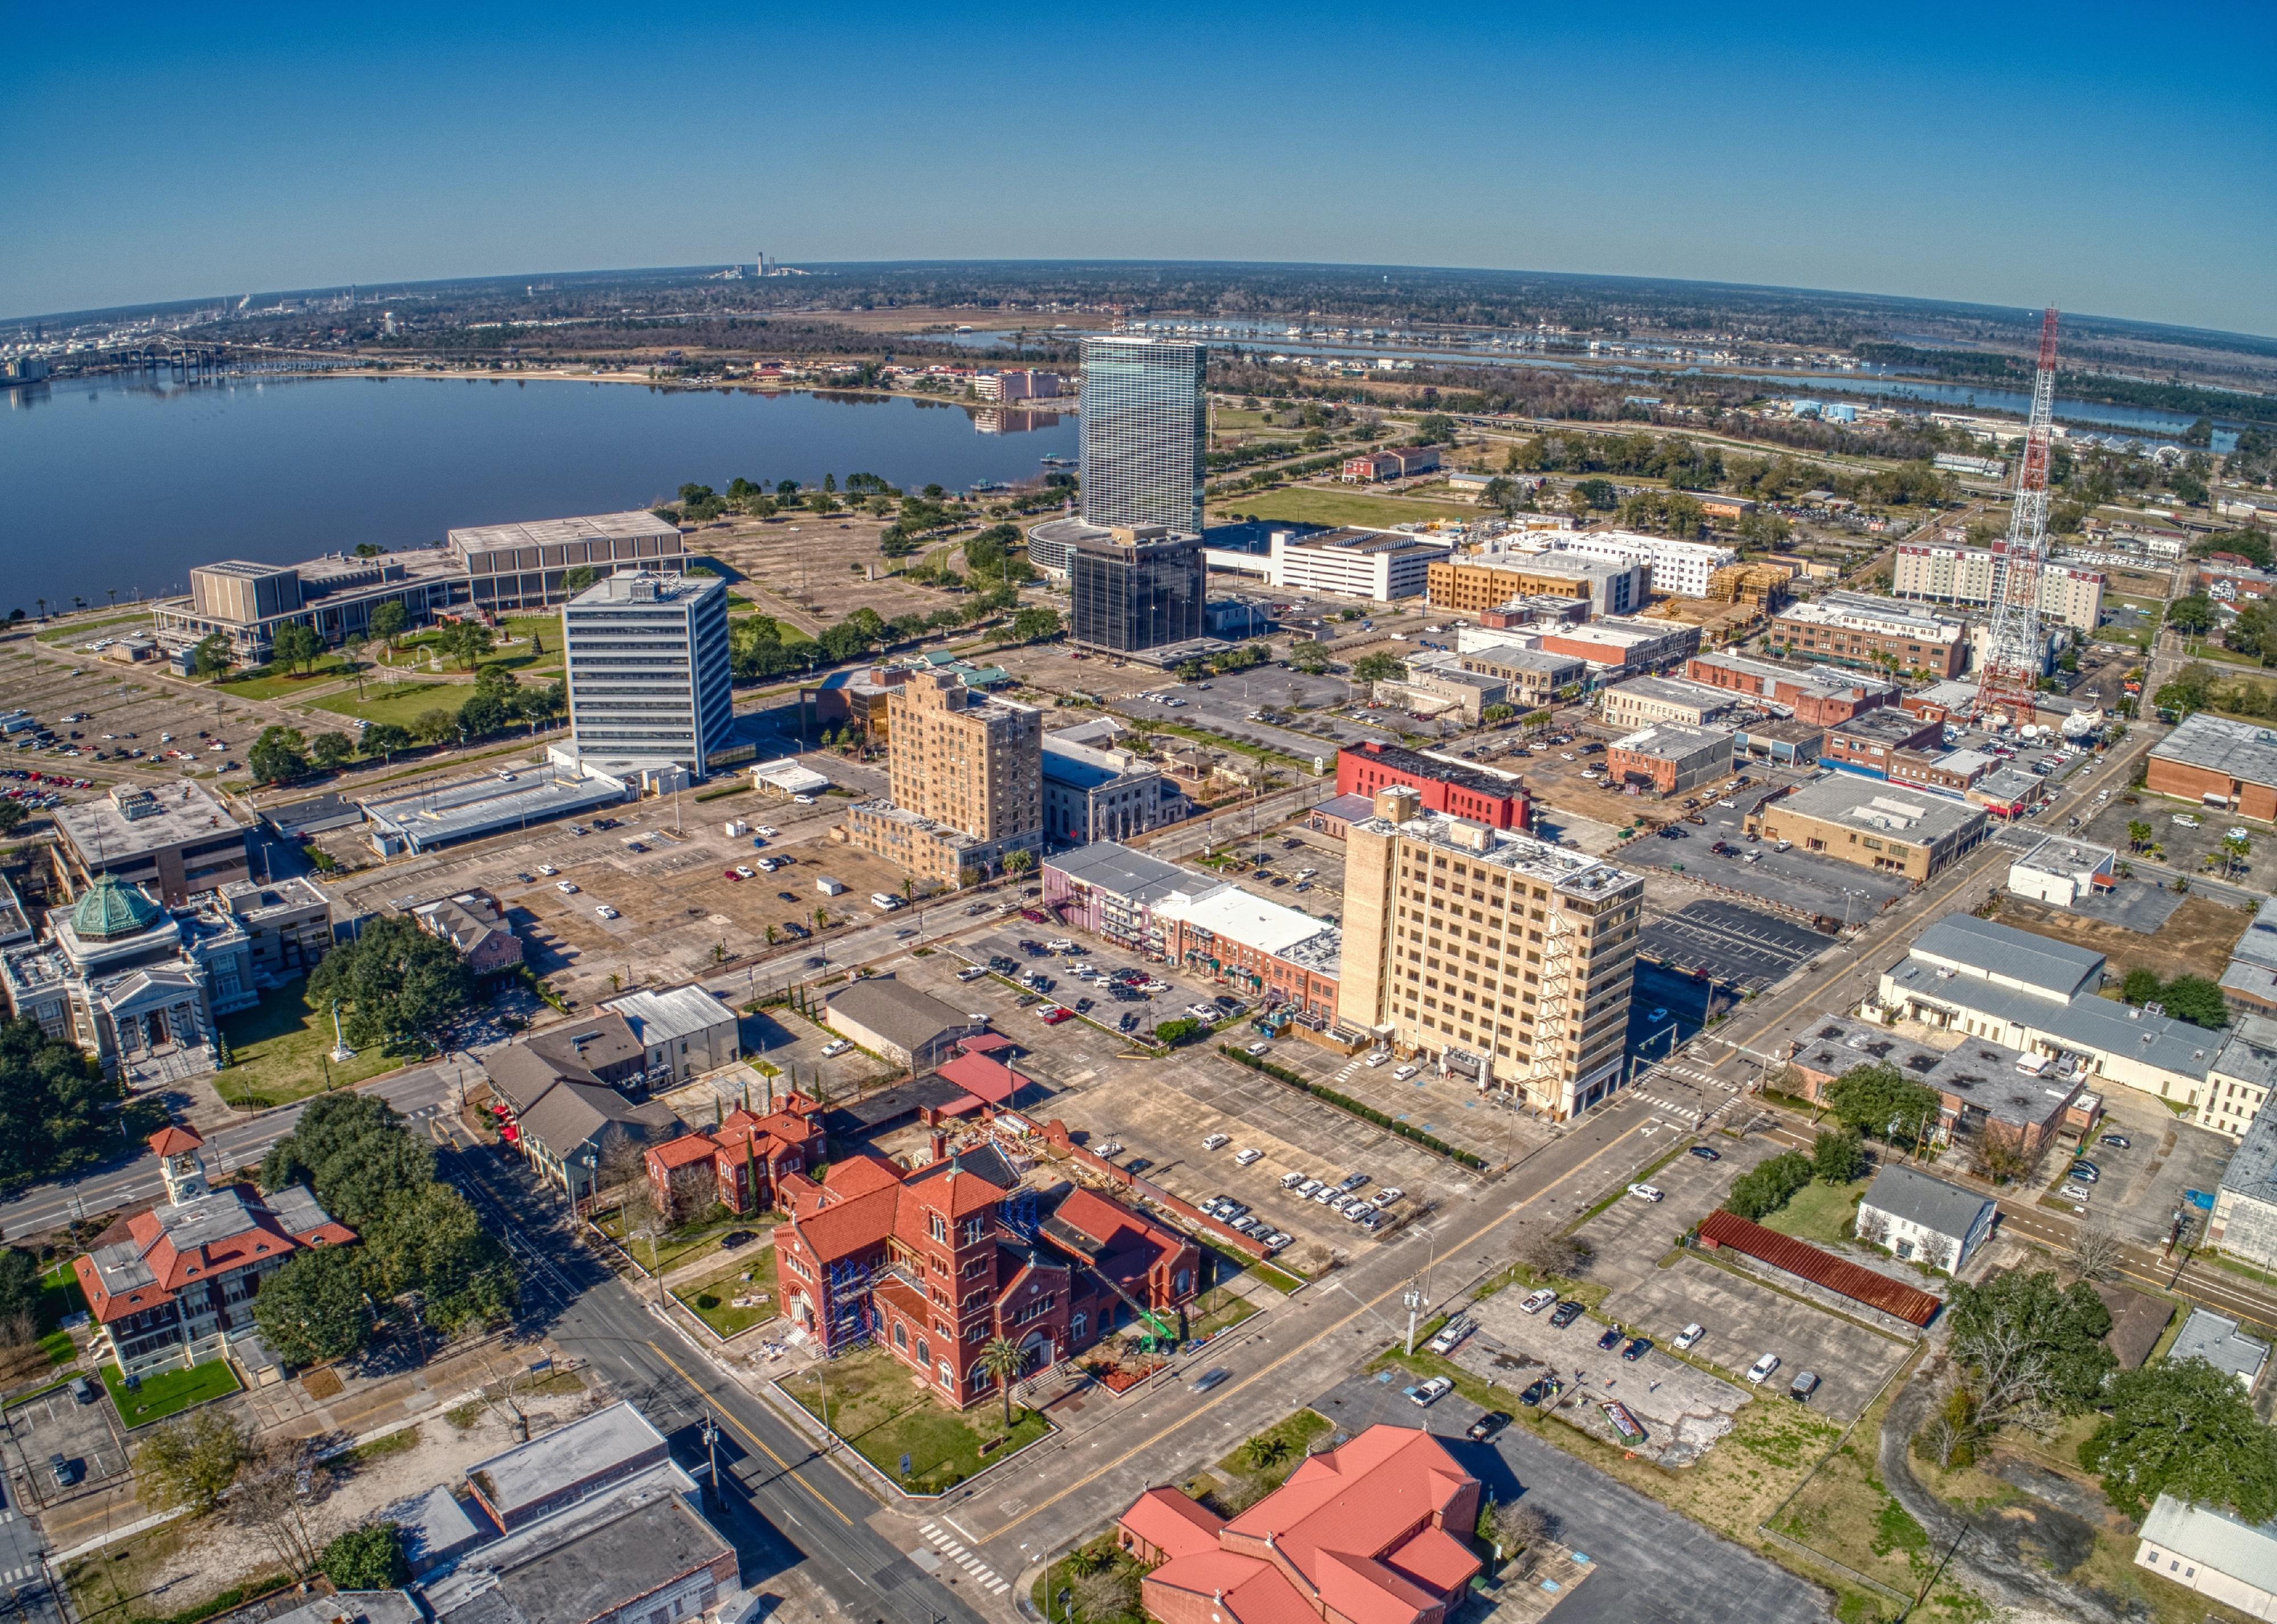
#9. Lake Charles, Louisiana
Lake Charles in Eastern Louisiana.
– Total homes in metro area: 97,193
– Total unoccupied homes: 24,447 (25.2% of total)
— Homes for rent: 1,148 (1.2% of total)
— Homes rented but not occupied: 381 (1.6% of unoccupied homes)
— Homes for sale: 862 (0.9% of total)
— Homes sold, but not occupied: 522 (2.1% of unoccupied homes)
— Homes for occasional, recreational, or seasonal use: 1,238 (5.1% of unoccupied homes)
— Homes for migrant workers: 124 (0.5% of unoccupied homes)
— Other vacant homes: 20,172 (82.5% of unoccupied homes)
Jillian Cain Photography // Shutterstock
#8. Cape Coral, Florida
Oceanside scene from Cape Coral.
– Total homes in metro area: 428,910
– Total unoccupied homes: 108,444 (25.3% of total)
— Homes for rent: 8,102 (1.9% of total)
— Homes rented but not occupied: 1,919 (1.8% of unoccupied homes)
— Homes for sale: 1,714 (0.4% of total)
— Homes sold, but not occupied: 2,788 (2.6% of unoccupied homes)
— Homes for occasional, recreational, or seasonal use: 85,543 (78.9% of unoccupied homes)
— Homes for migrant workers: 691 (0.6% of unoccupied homes)
— Other vacant homes: 7,687 (7.1% of unoccupied homes)
Canva
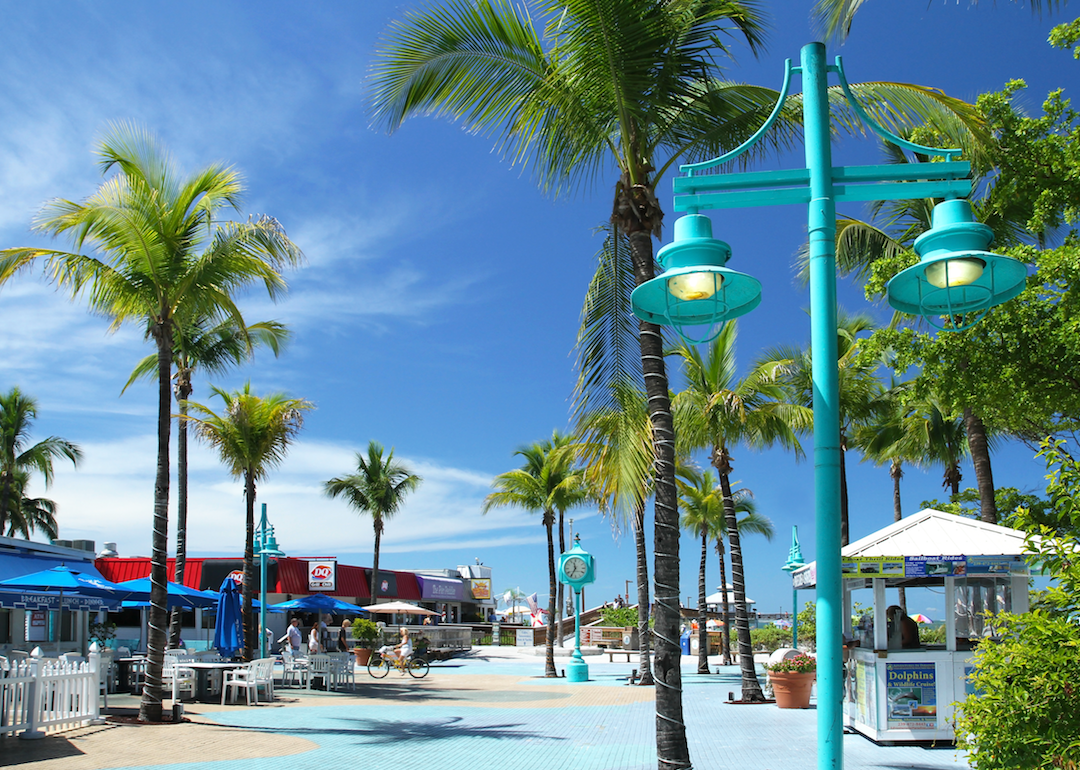
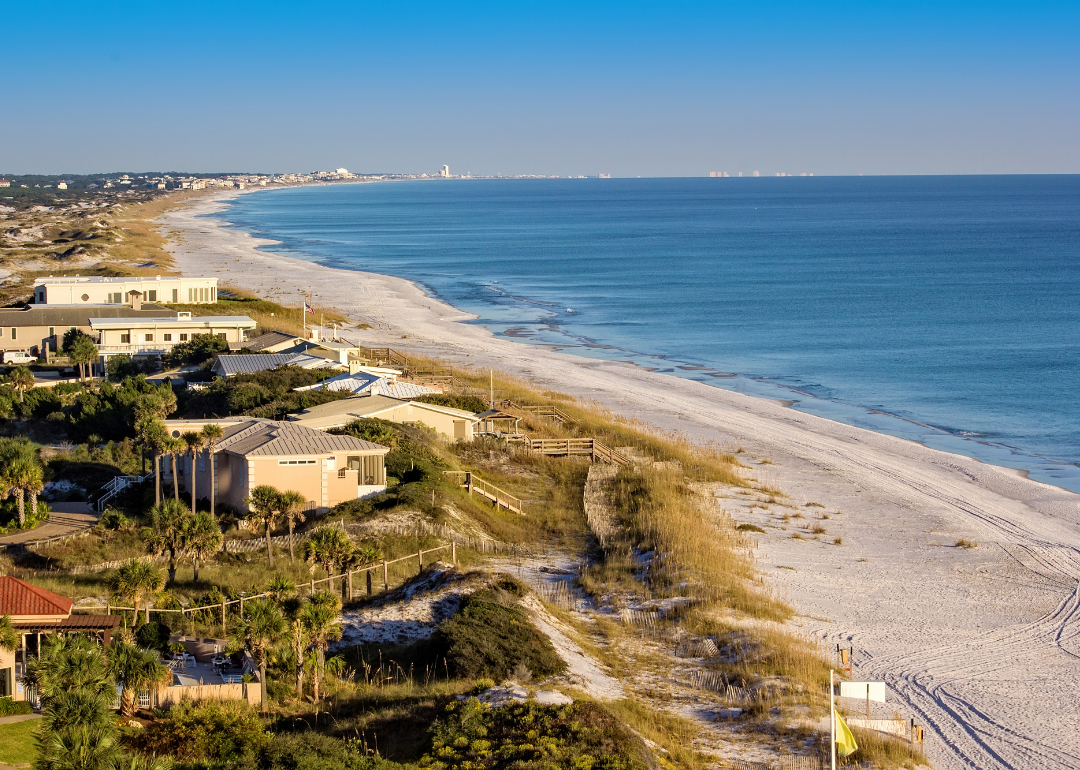
#7. Crestview, Florida
An aerial view of homes along a beach.
– Total homes in metro area: 160,839
– Total unoccupied homes: 42,401 (26.4% of total)
— Homes for rent: 10,913 (6.8% of total)
— Homes rented but not occupied: 639 (1.5% of unoccupied homes)
— Homes for sale: 941 (0.6% of total)
— Homes sold, but not occupied: 491 (1.2% of unoccupied homes)
— Homes for occasional, recreational, or seasonal use: 23,957 (56.5% of unoccupied homes)
— Homes for migrant workers: 440 (1.0% of unoccupied homes)
— Other vacant homes: 5,020 (11.8% of unoccupied homes)
N.A. Qurashi // Shutterstock
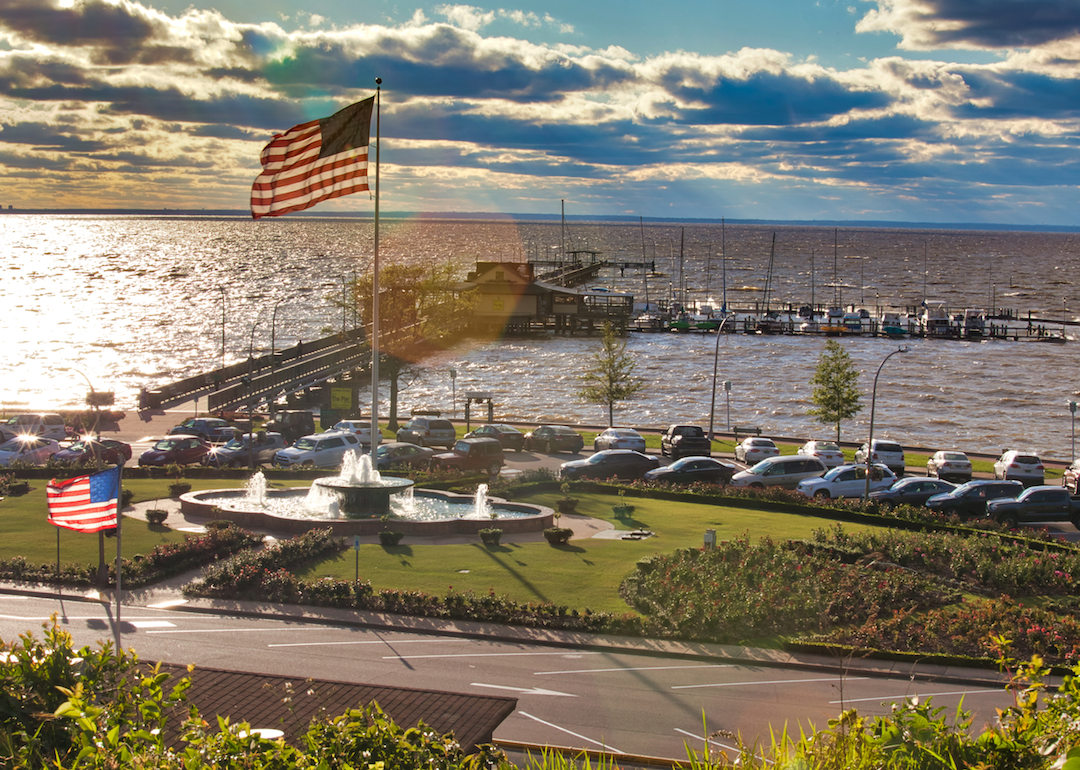
#6. Daphne, Alabama
An American flag stands above a fountain on the edge of the ocean.
– Total homes in metro area: 128,533
– Total unoccupied homes: 34,428 (26.8% of total)
— Homes for rent: 11,563 (9.0% of total)
— Homes rented but not occupied: 612 (1.8% of unoccupied homes)
— Homes for sale: 1,003 (0.8% of total)
— Homes sold, but not occupied: 609 (1.8% of unoccupied homes)
— Homes for occasional, recreational, or seasonal use: 15,249 (44.3% of unoccupied homes)
— Homes for migrant workers: 0 (0.0% of unoccupied homes)
— Other vacant homes: 5,392 (15.7% of unoccupied homes)
Canva
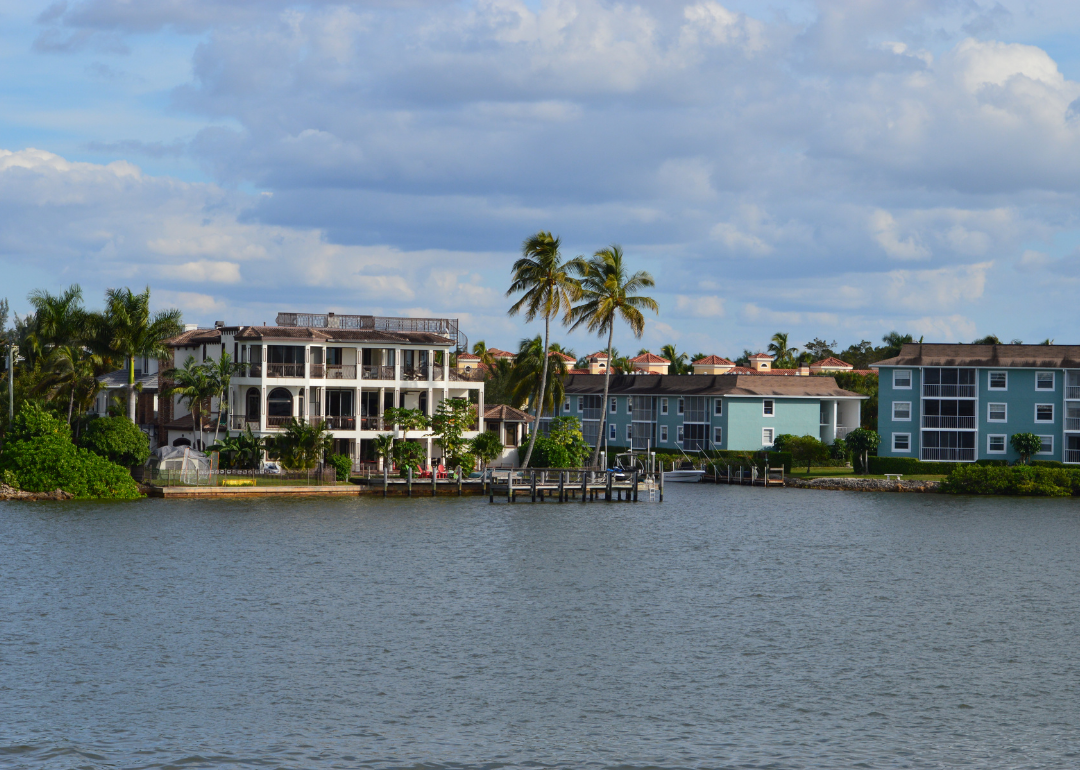
#5. Naples, Florida
Condominiums on the water in Naples.
– Total homes in metro area: 233,635
– Total unoccupied homes: 69,692 (29.8% of total)
— Homes for rent: 4,937 (2.1% of total)
— Homes rented but not occupied: 845 (1.2% of unoccupied homes)
— Homes for sale: 1,567 (0.7% of total)
— Homes sold, but not occupied: 435 (0.6% of unoccupied homes)
— Homes for occasional, recreational, or seasonal use: 56,116 (80.5% of unoccupied homes)
— Homes for migrant workers: 300 (0.4% of unoccupied homes)
— Other vacant homes: 5,492 (7.9% of unoccupied homes)
DANIEL SLIM/AFP // Getty Images
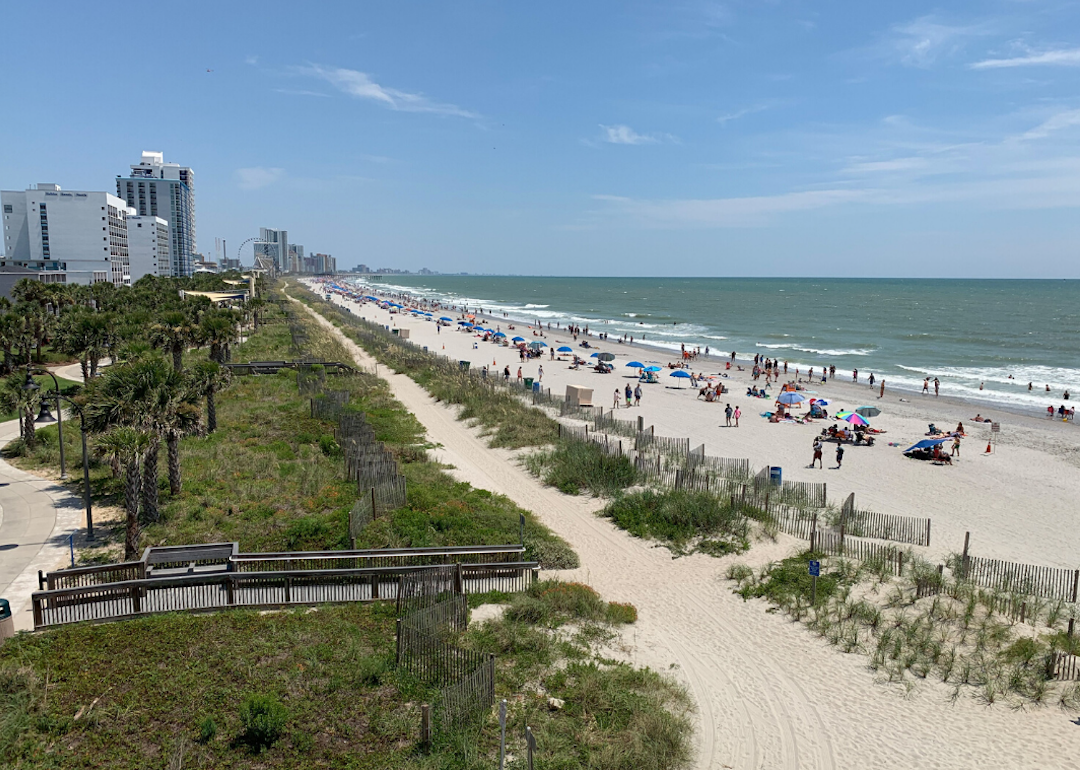
#4. Myrtle Beach, South Carolina
A wide view along the sands of Myrtle Beach.
– Total homes in metro area: 303,194
– Total unoccupied homes: 92,522 (30.5% of total)
— Homes for rent: 13,544 (4.5% of total)
— Homes rented but not occupied: 1,830 (2.0% of unoccupied homes)
— Homes for sale: 1,853 (0.6% of total)
— Homes sold, but not occupied: 1,066 (1.2% of unoccupied homes)
— Homes for occasional, recreational, or seasonal use: 65,678 (71.0% of unoccupied homes)
— Homes for migrant workers: 30 (0.0% of unoccupied homes)
— Other vacant homes: 8,521 (9.2% of unoccupied homes)
Eliyahu Yosef Parypa // Shutterstock
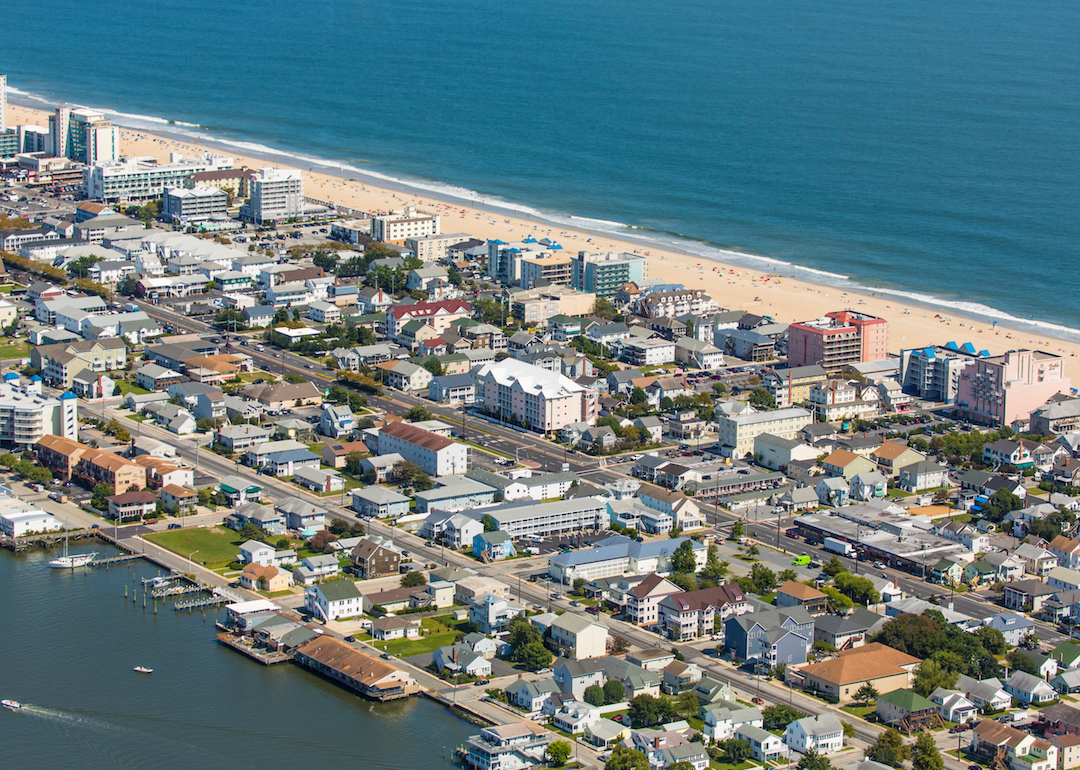
#3. Salisbury, Maryland
An aerial view of homes and the beach in Salisbury.
– Total homes in metro area: 259,303
– Total unoccupied homes: 82,301 (31.7% of total)
— Homes for rent: 2,720 (1.0% of total)
— Homes rented but not occupied: 539 (0.7% of unoccupied homes)
— Homes for sale: 3,016 (1.2% of total)
— Homes sold, but not occupied: 269 (0.3% of unoccupied homes)
— Homes for occasional, recreational, or seasonal use: 67,444 (81.9% of unoccupied homes)
— Homes for migrant workers: 96 (0.1% of unoccupied homes)
— Other vacant homes: 8,217 (10.0% of unoccupied homes)
JLV Photo // Shutterstock
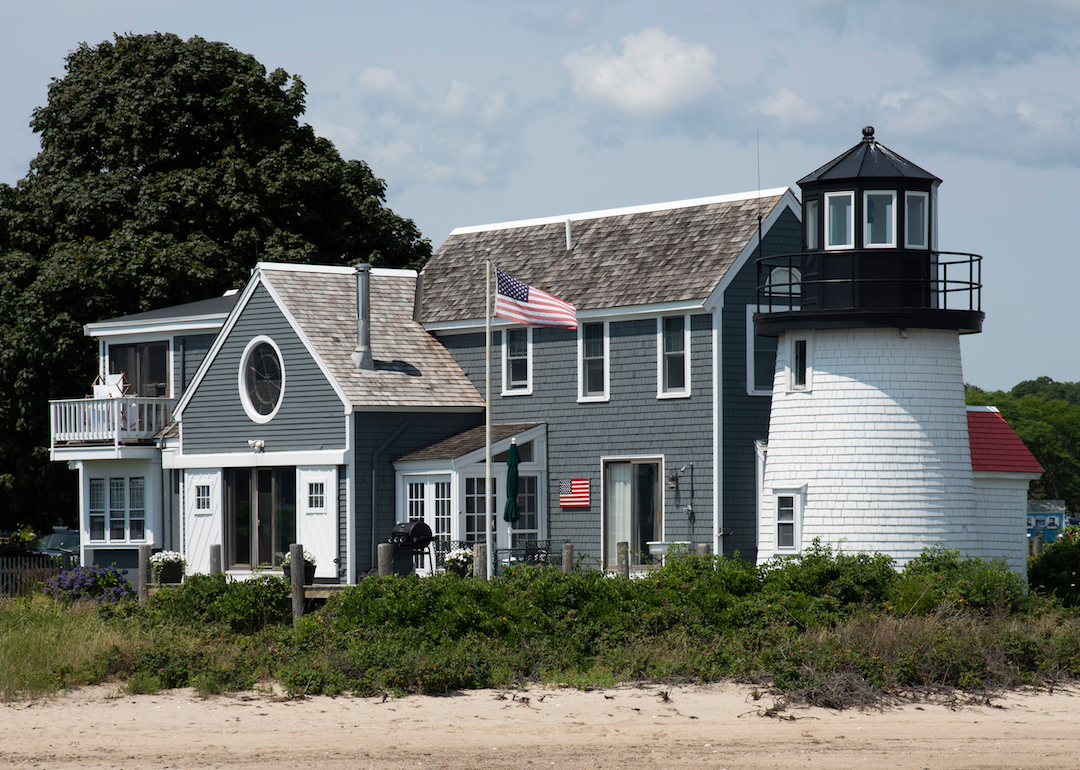
#2. Barnstable Town, Massachusetts
A traditional New England home with a small lighthouse attached.
– Total homes in metro area: 165,542
– Total unoccupied homes: 60,809 (36.7% of total)
— Homes for rent: 1,397 (0.8% of total)
— Homes rented but not occupied: 0 (0.0% of unoccupied homes)
— Homes for sale: 453 (0.3% of total)
— Homes sold, but not occupied: 495 (0.8% of unoccupied homes)
— Homes for occasional, recreational, or seasonal use: 55,926 (92.0% of unoccupied homes)
— Homes for migrant workers: 0 (0.0% of unoccupied homes)
— Other vacant homes: 2,538 (4.2% of unoccupied homes)
Vlad G // Shutterstock
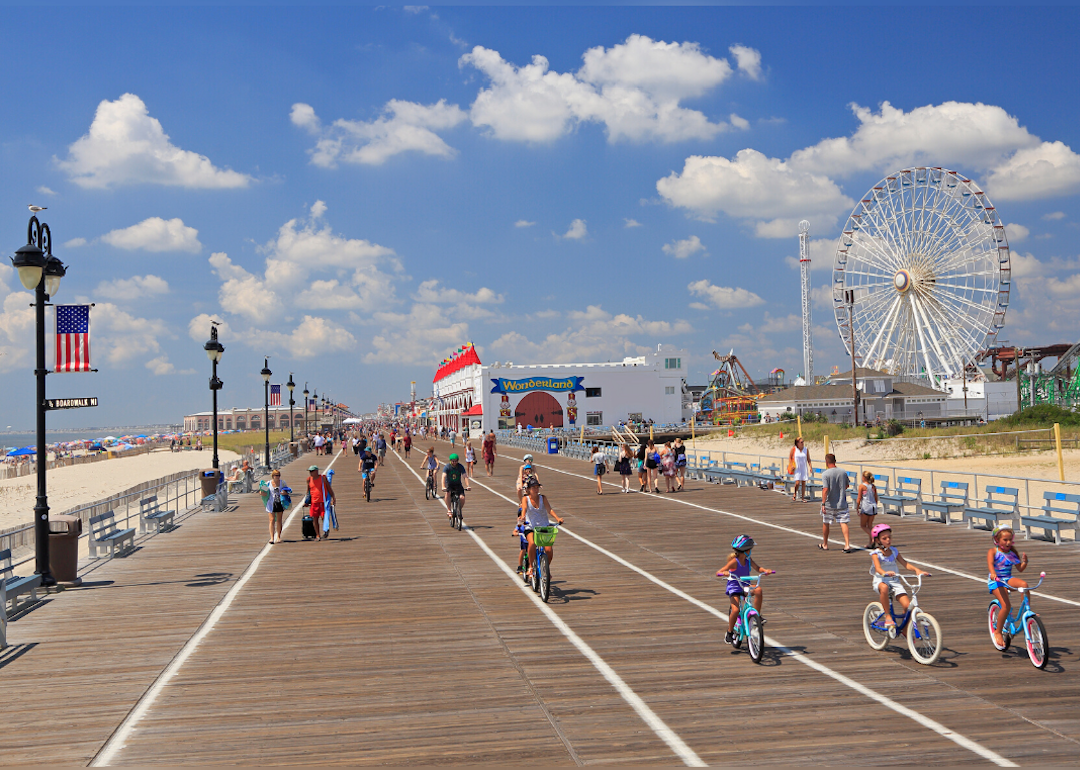
#1. Ocean City, New Jersey
A ferris wheel and boardwalk with bikers in Ocean City.
– Total homes in metro area: 99,233
– Total unoccupied homes: 50,373 (50.8% of total)
— Homes for rent: 2,400 (2.4% of total)
— Homes rented but not occupied: 42 (0.1% of unoccupied homes)
— Homes for sale: 423 (0.4% of total)
— Homes sold, but not occupied: 375 (0.7% of unoccupied homes)
— Homes for occasional, recreational, or seasonal use: 46,251 (91.8% of unoccupied homes)
— Homes for migrant workers: 0 (0.0% of unoccupied homes)
— Other vacant homes: 882 (1.8% of unoccupied homes)
You may also like: Interior design trends from the 1920s to today