The best liberal places to live in America
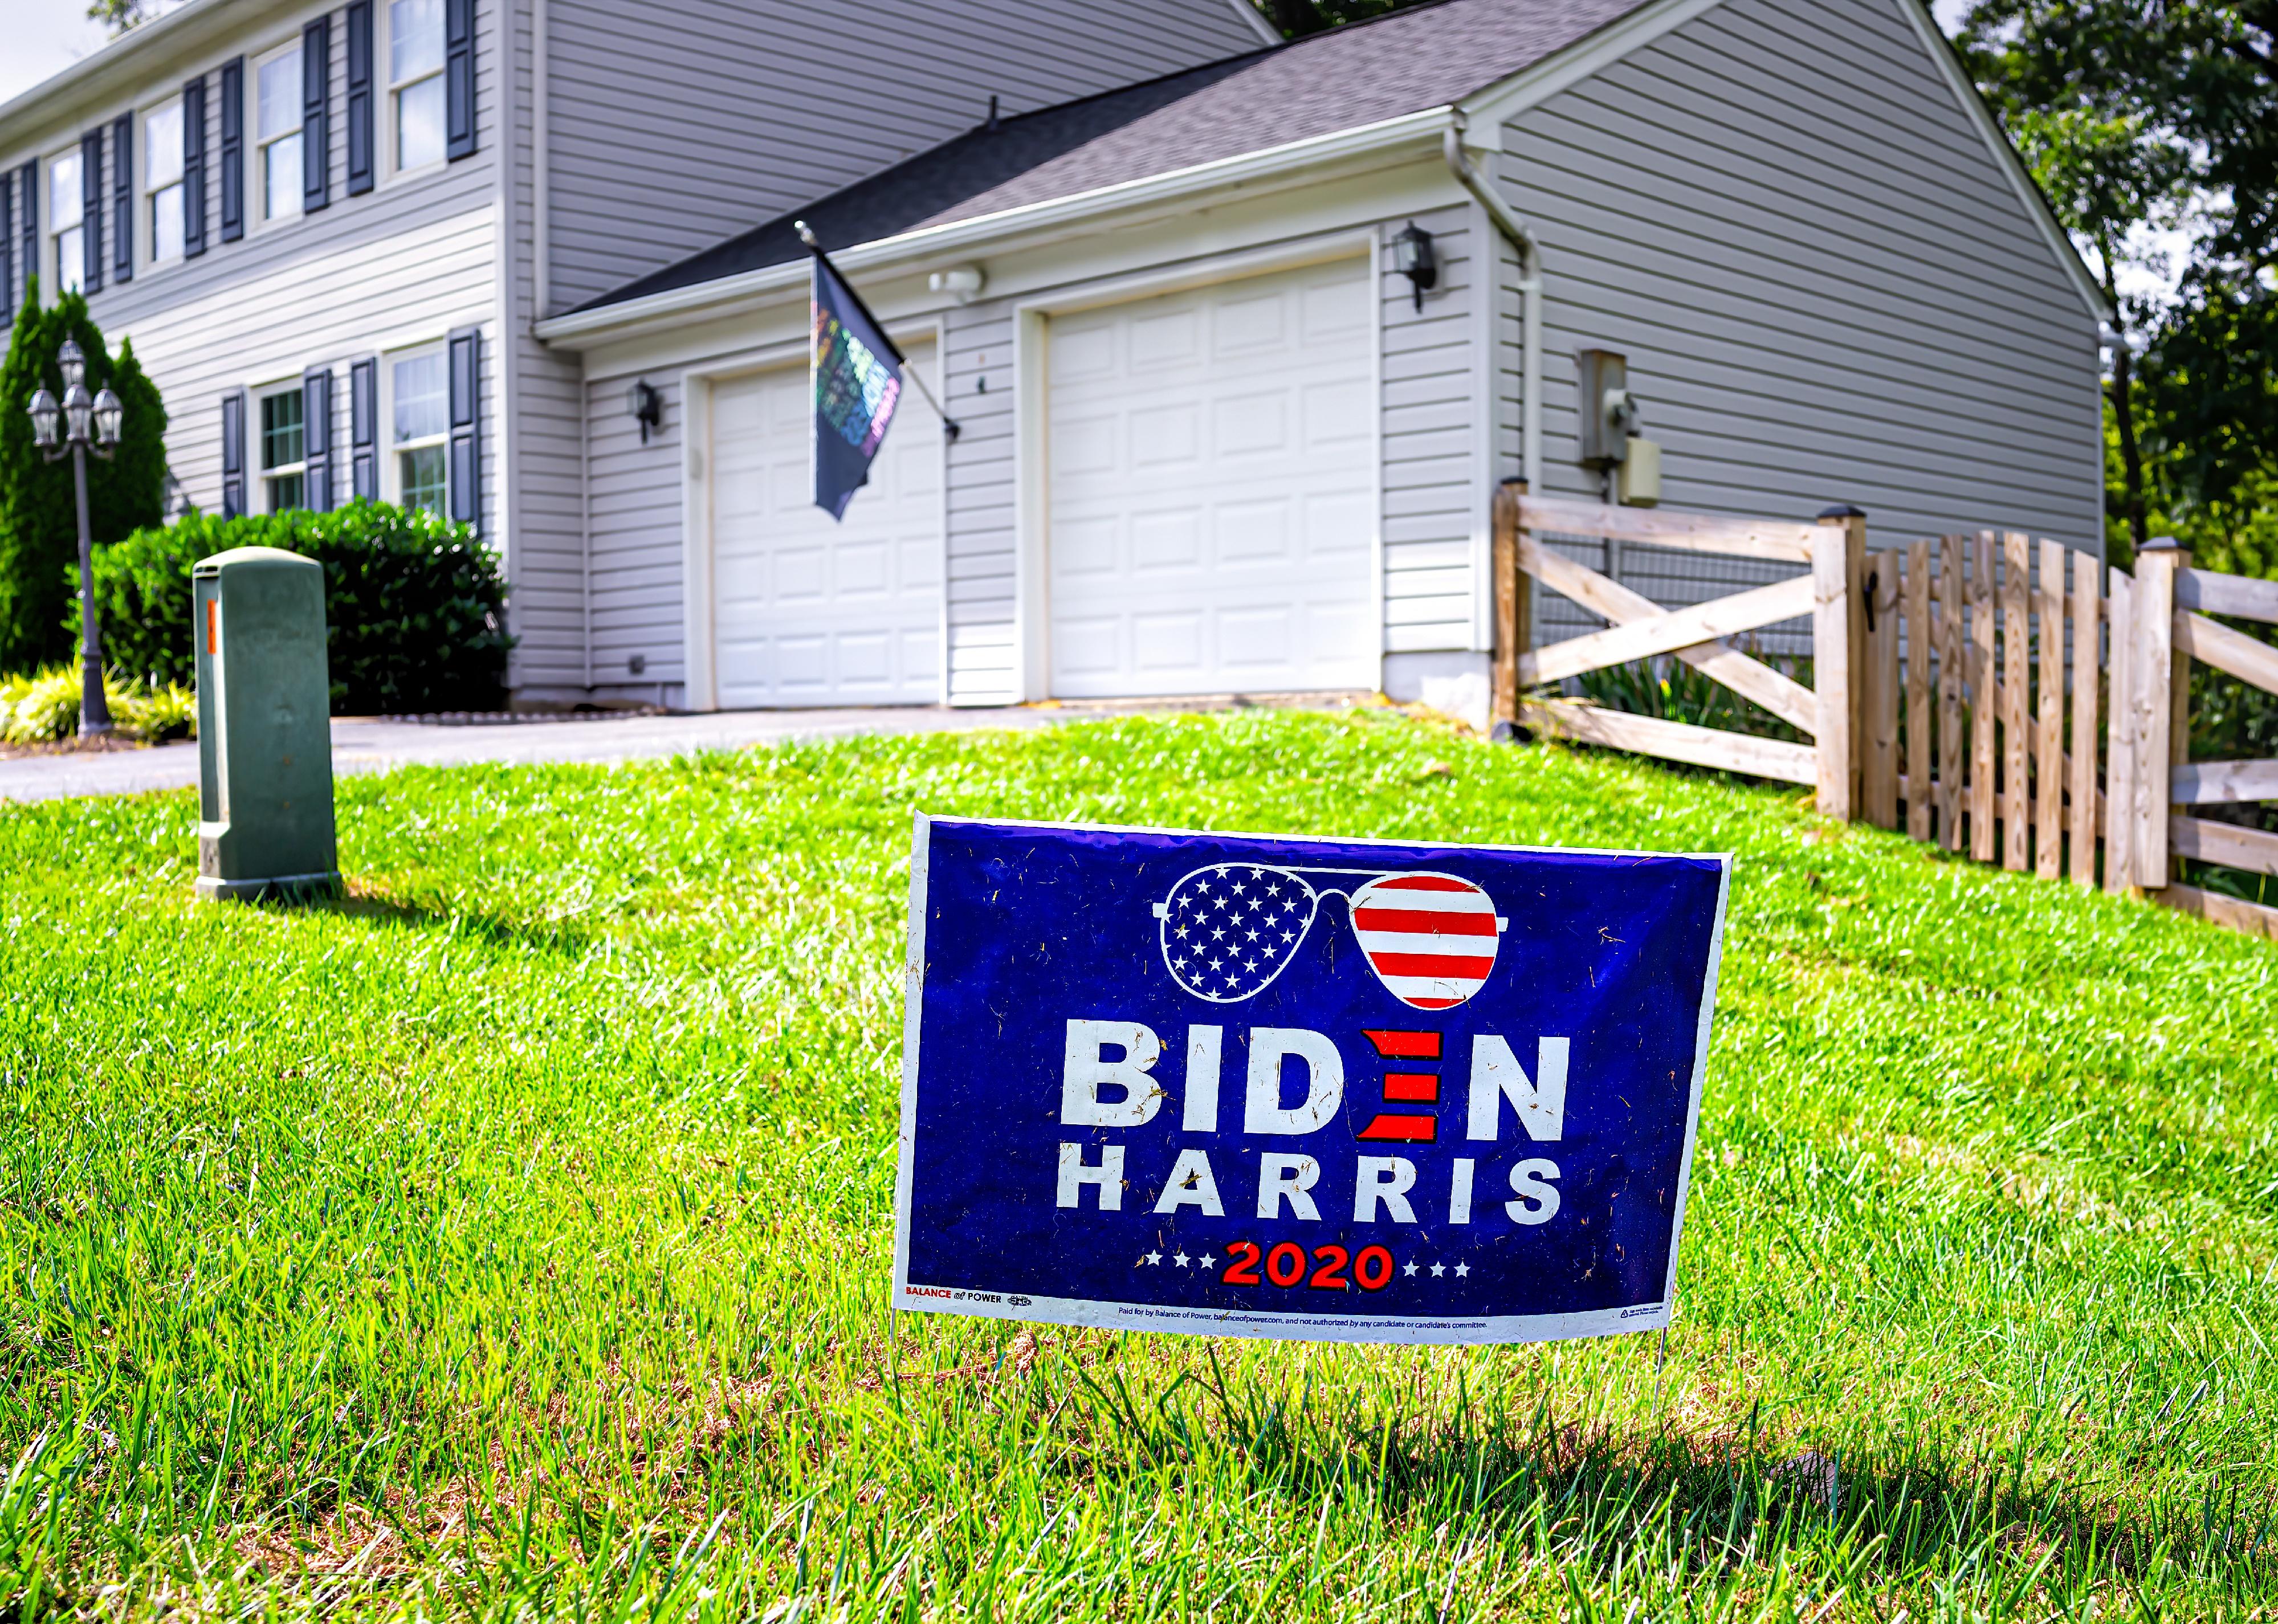
Michael Julian Photograph // Shutterstock
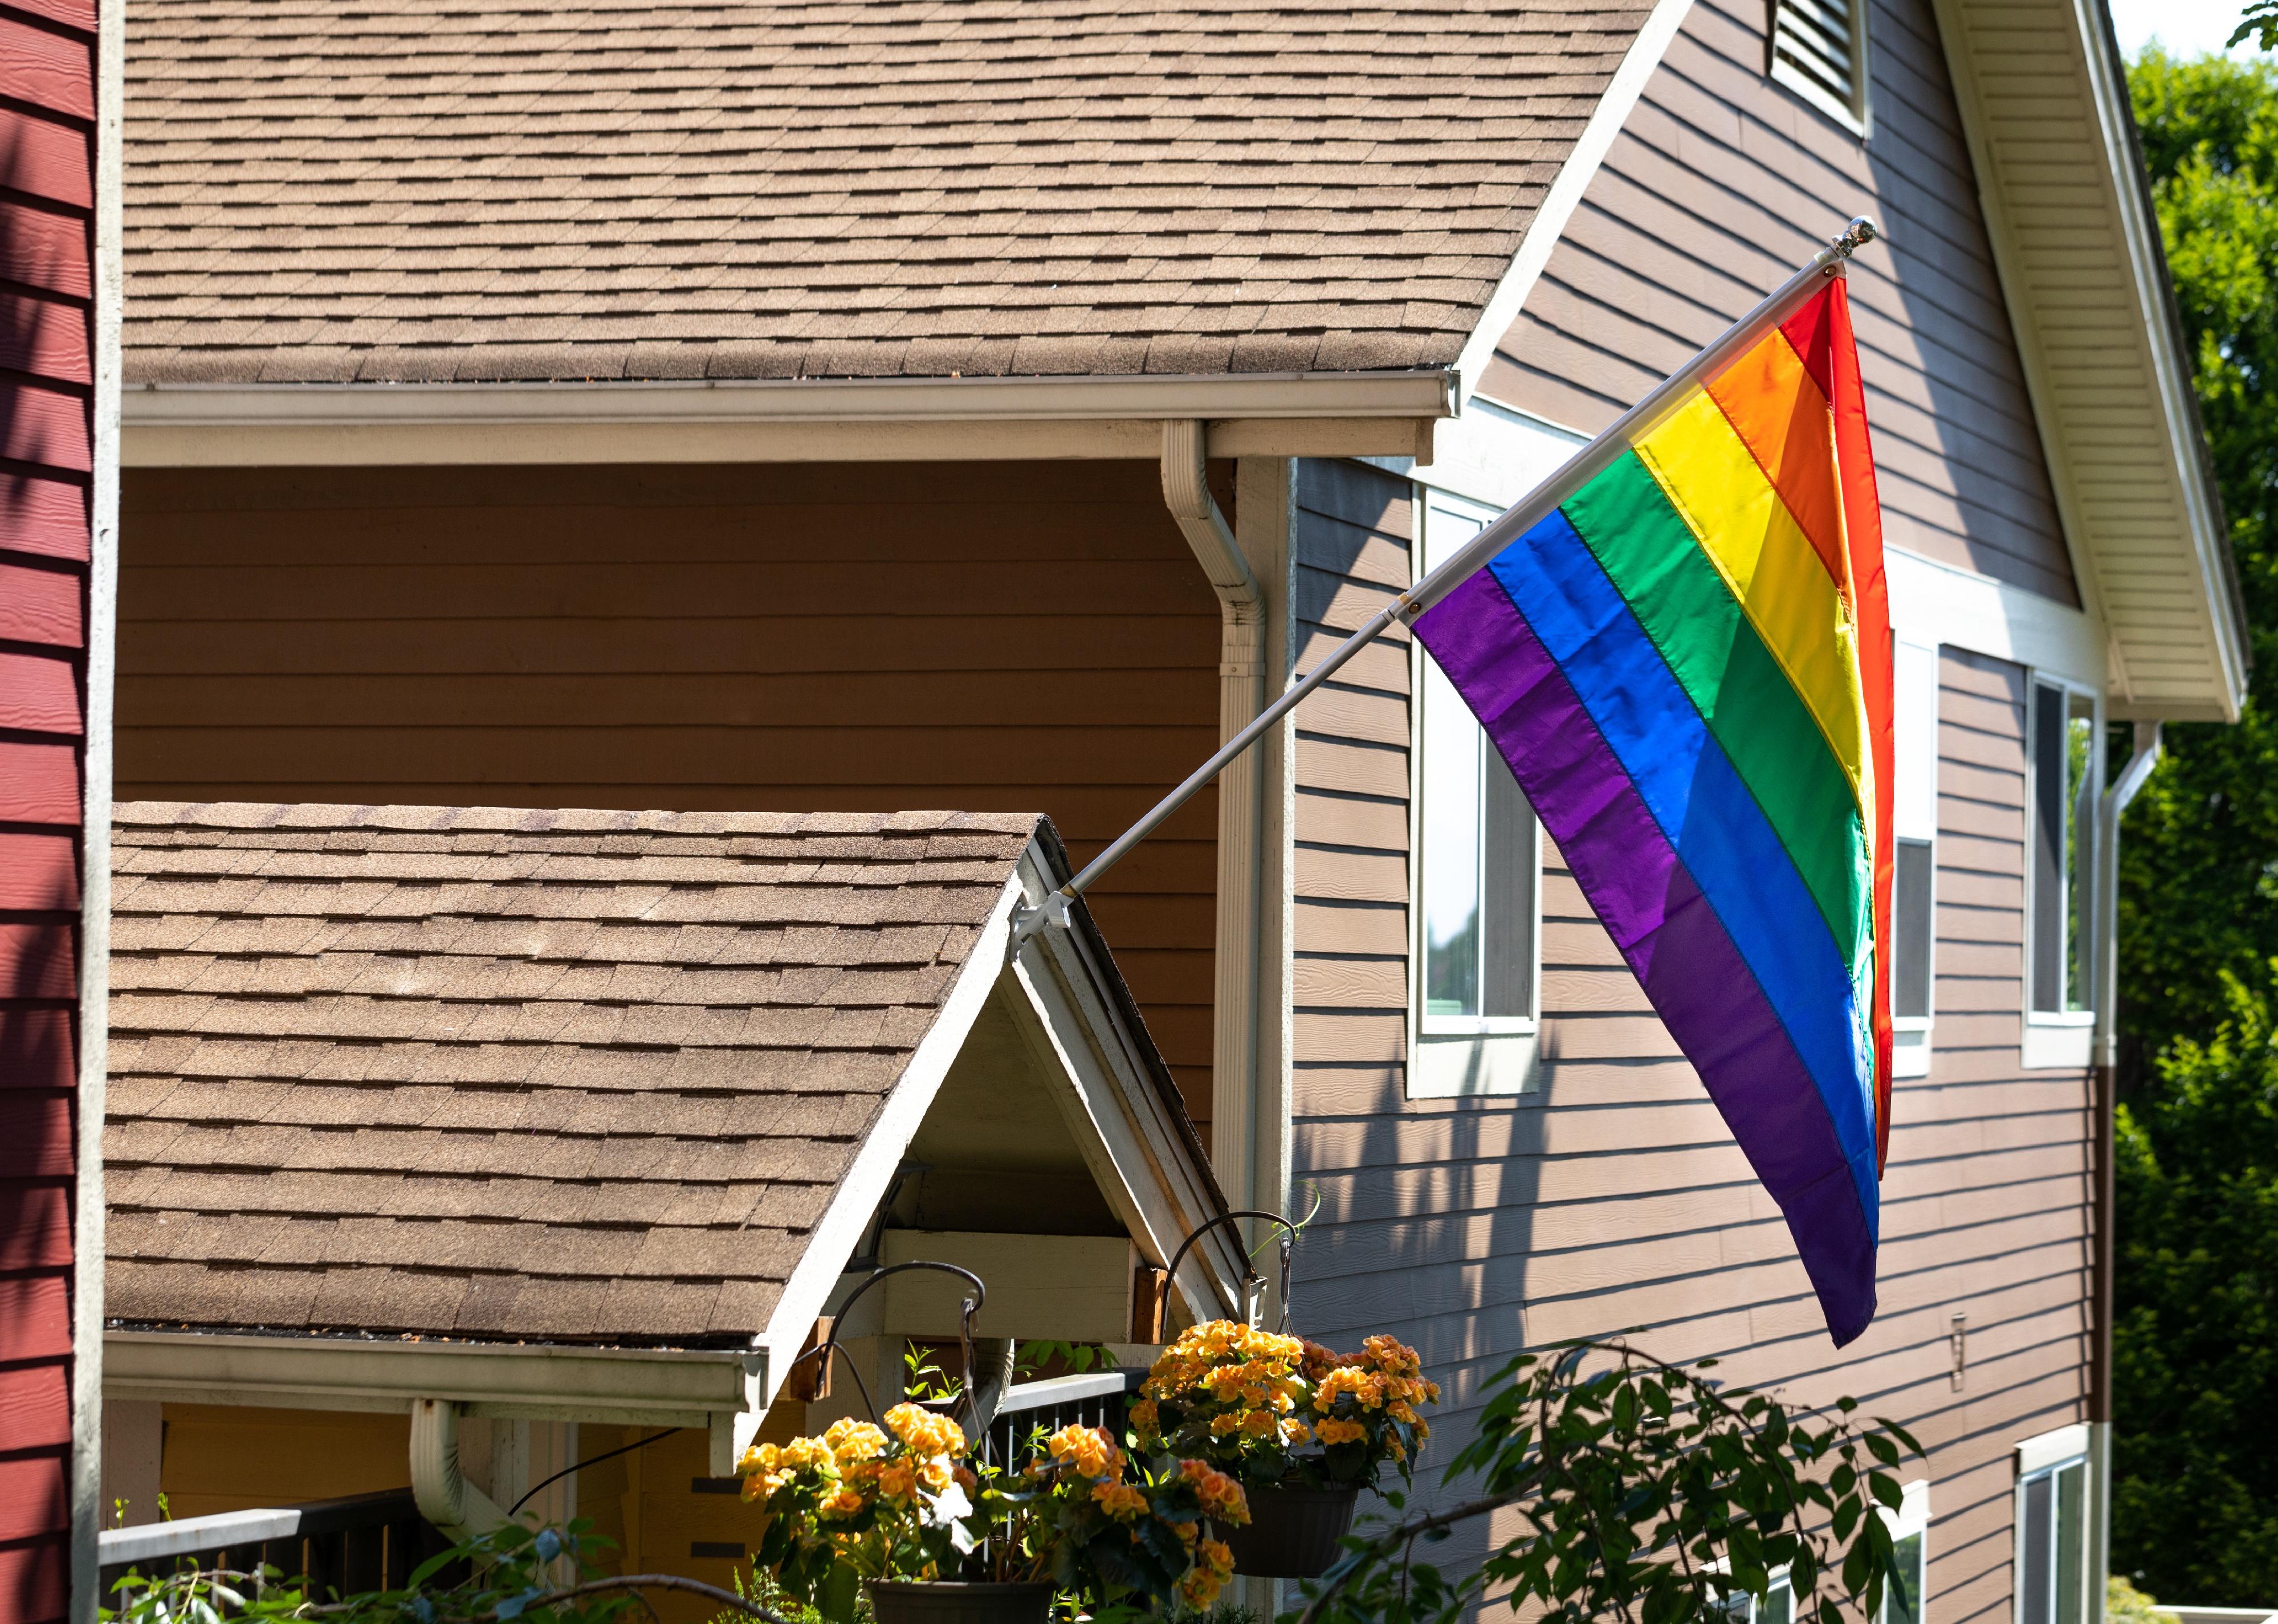
The best liberal places to live in America
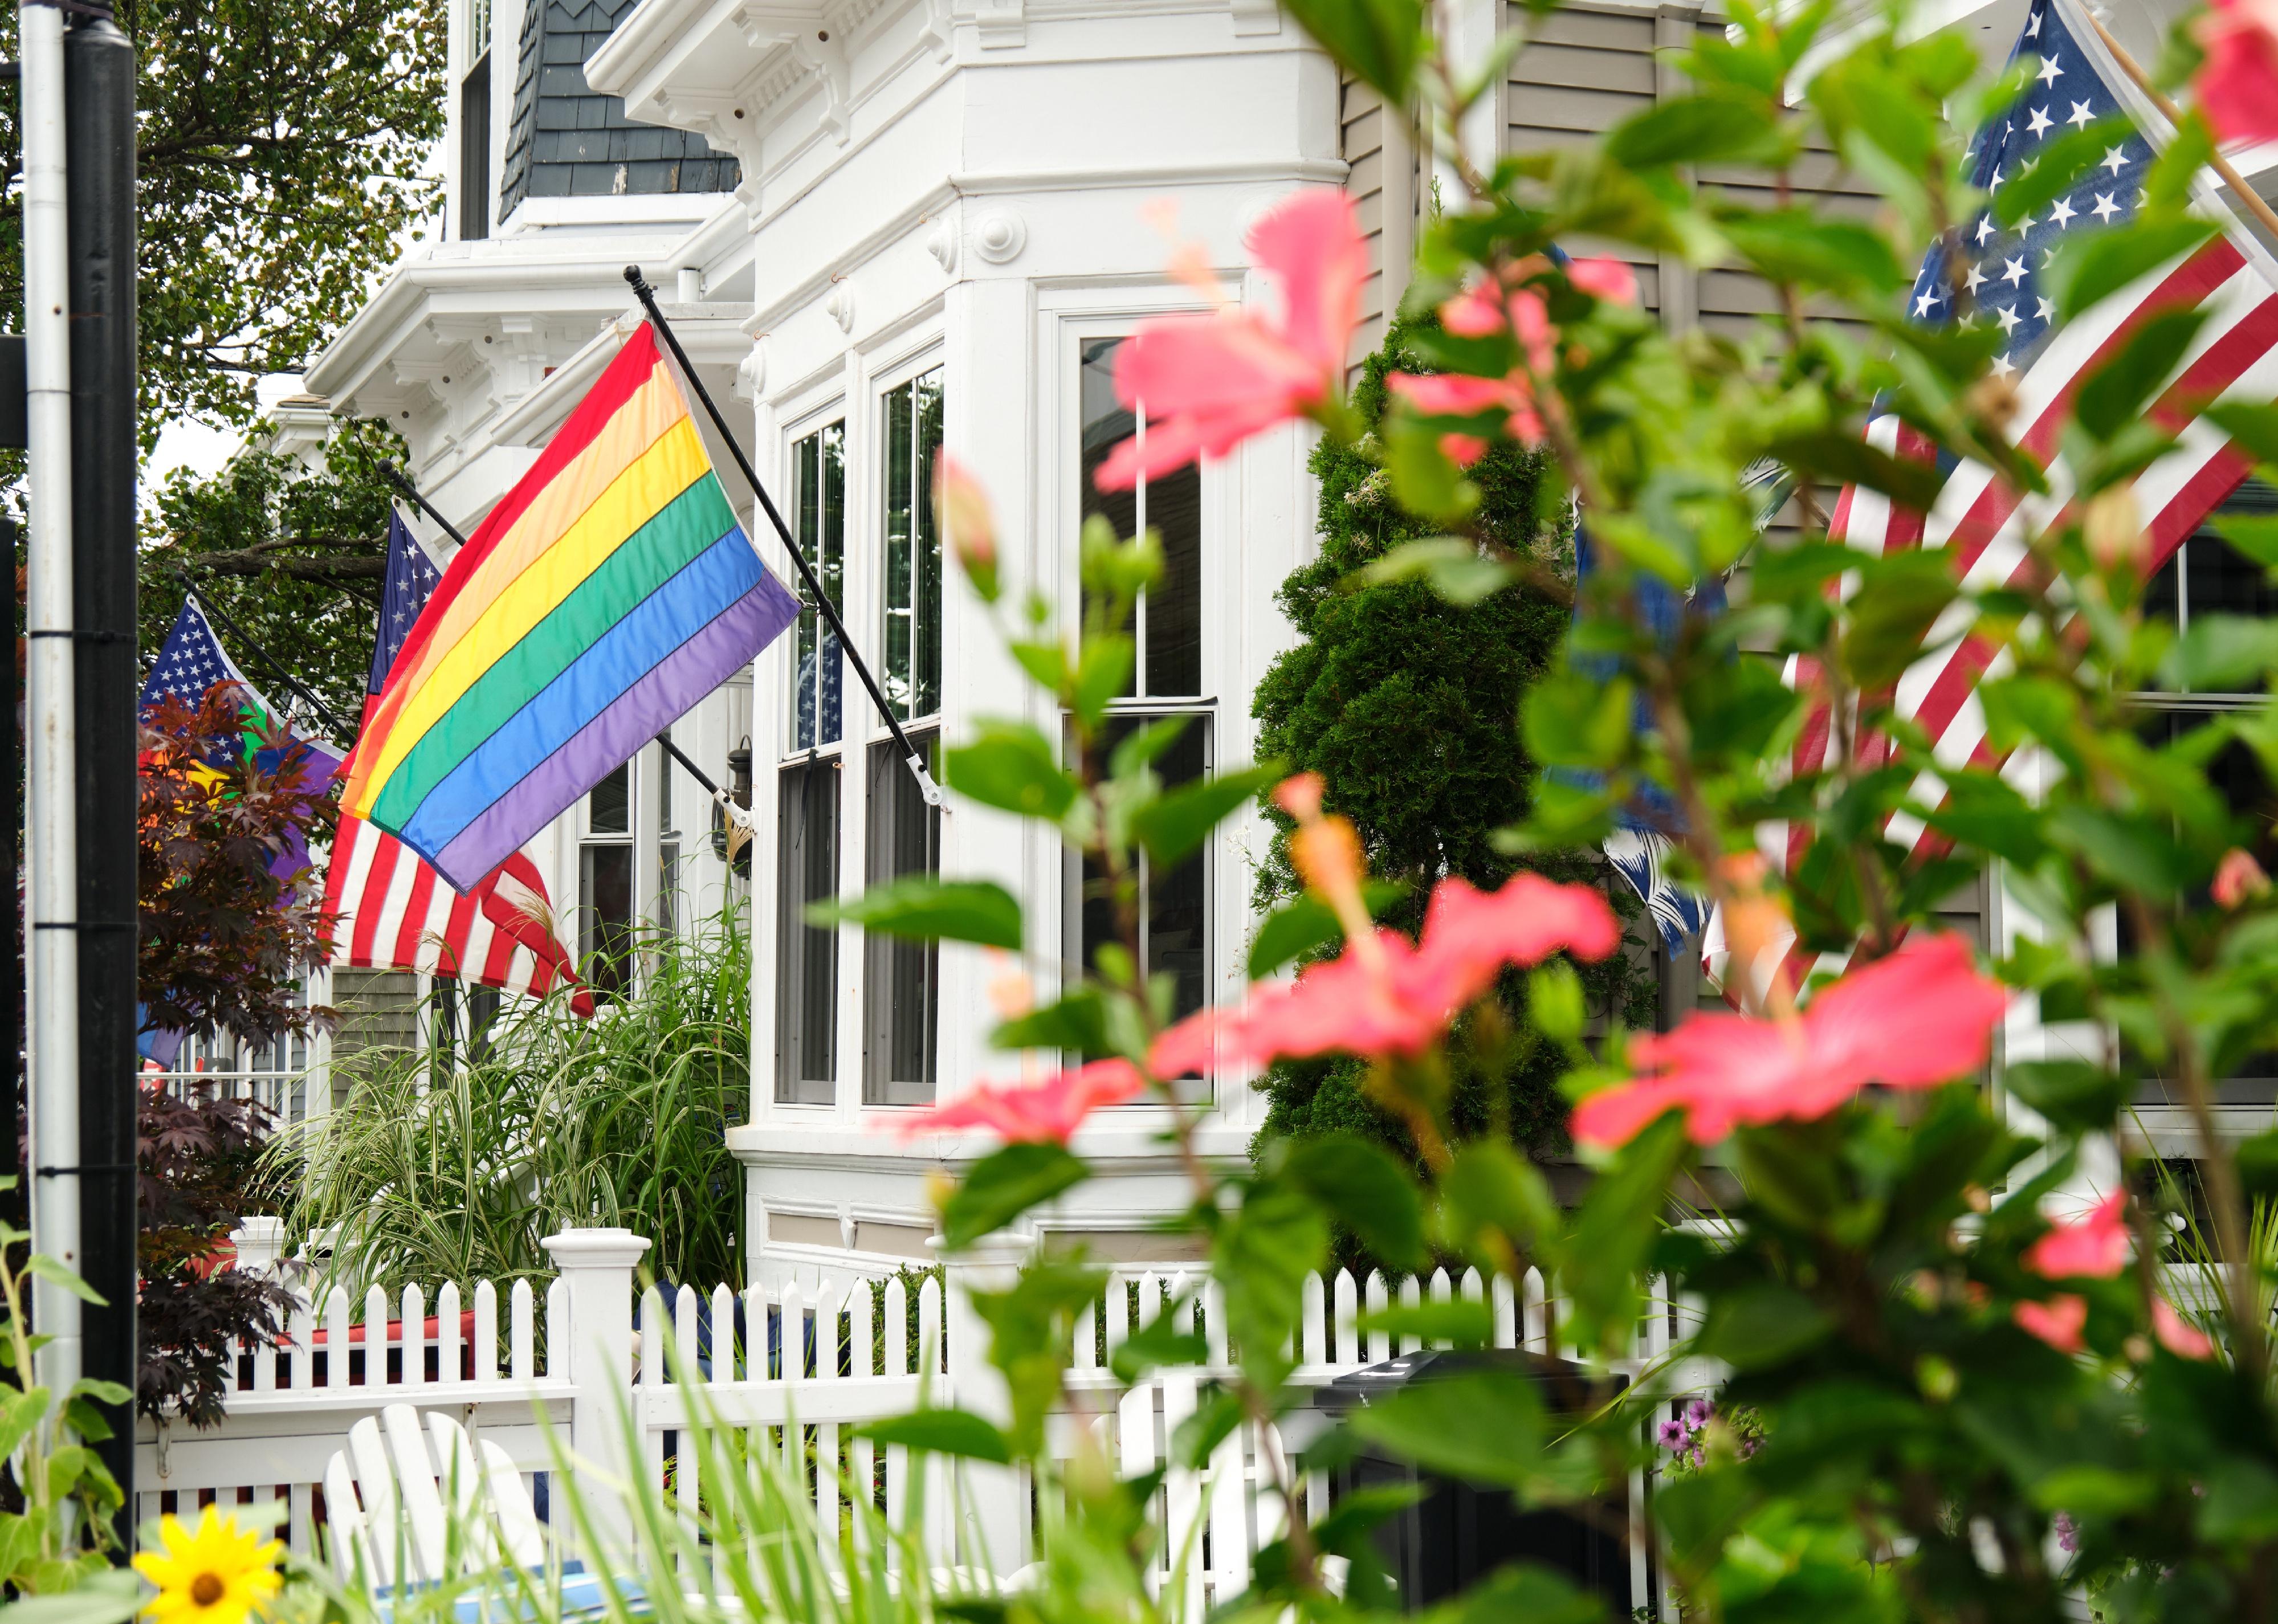
A rainbow pride flag is flanked by American flags on a house
A vibrant city setting, where the streets are highly walkable, homes are on the smaller side, and a diversity of ethnicities and races can be found throughout the community: This is the type of place where liberals prefer to live, according to a 2014 Pew Research Center study. Almost half of liberals prefer city living, with around two in 10 preferring suburban life.
Stacker analyzed data from Niche to rank the 50 best liberal places to live in the U.S. Niche sources data from several public data sources, including the Department of Education, Census Bureau, and FBI. This particular data set was acquired by filtering for “very liberal” politics on the 2022 Best Places to Live in America list.
“Very liberal” is based on presidential election results from 2012 and 2016 as compared to the average in the nation. It’s important to note that though all the populations are accurate, many of the areas listed are near a larger metropolitan area or city—for example, Radnor/Fort Myer Heights, Virginia, is right outside of Washington D.C.
Out of the top 50, the top 10 best liberal places to live in the U.S. scored well on public schools (Niche average of A+), outdoor space (Niche average of A), nightlife (Niche average of A+), health (Niche average of A+) and were good for families (Niche average of A+) but lacked in the housing (Niche average of B-) and cost of living (Niche average of C) categories.
All four regions in the continental U.S. (Northeast, South, Midwest, and West) are included in the top 10 best liberal places to live in the U.S. The median household income of the top 10 best liberal places to live in the U.S. only dipped below six figures in one location (Ocean Park, California), and even then, areas surrounding Santa Monica are affluent.
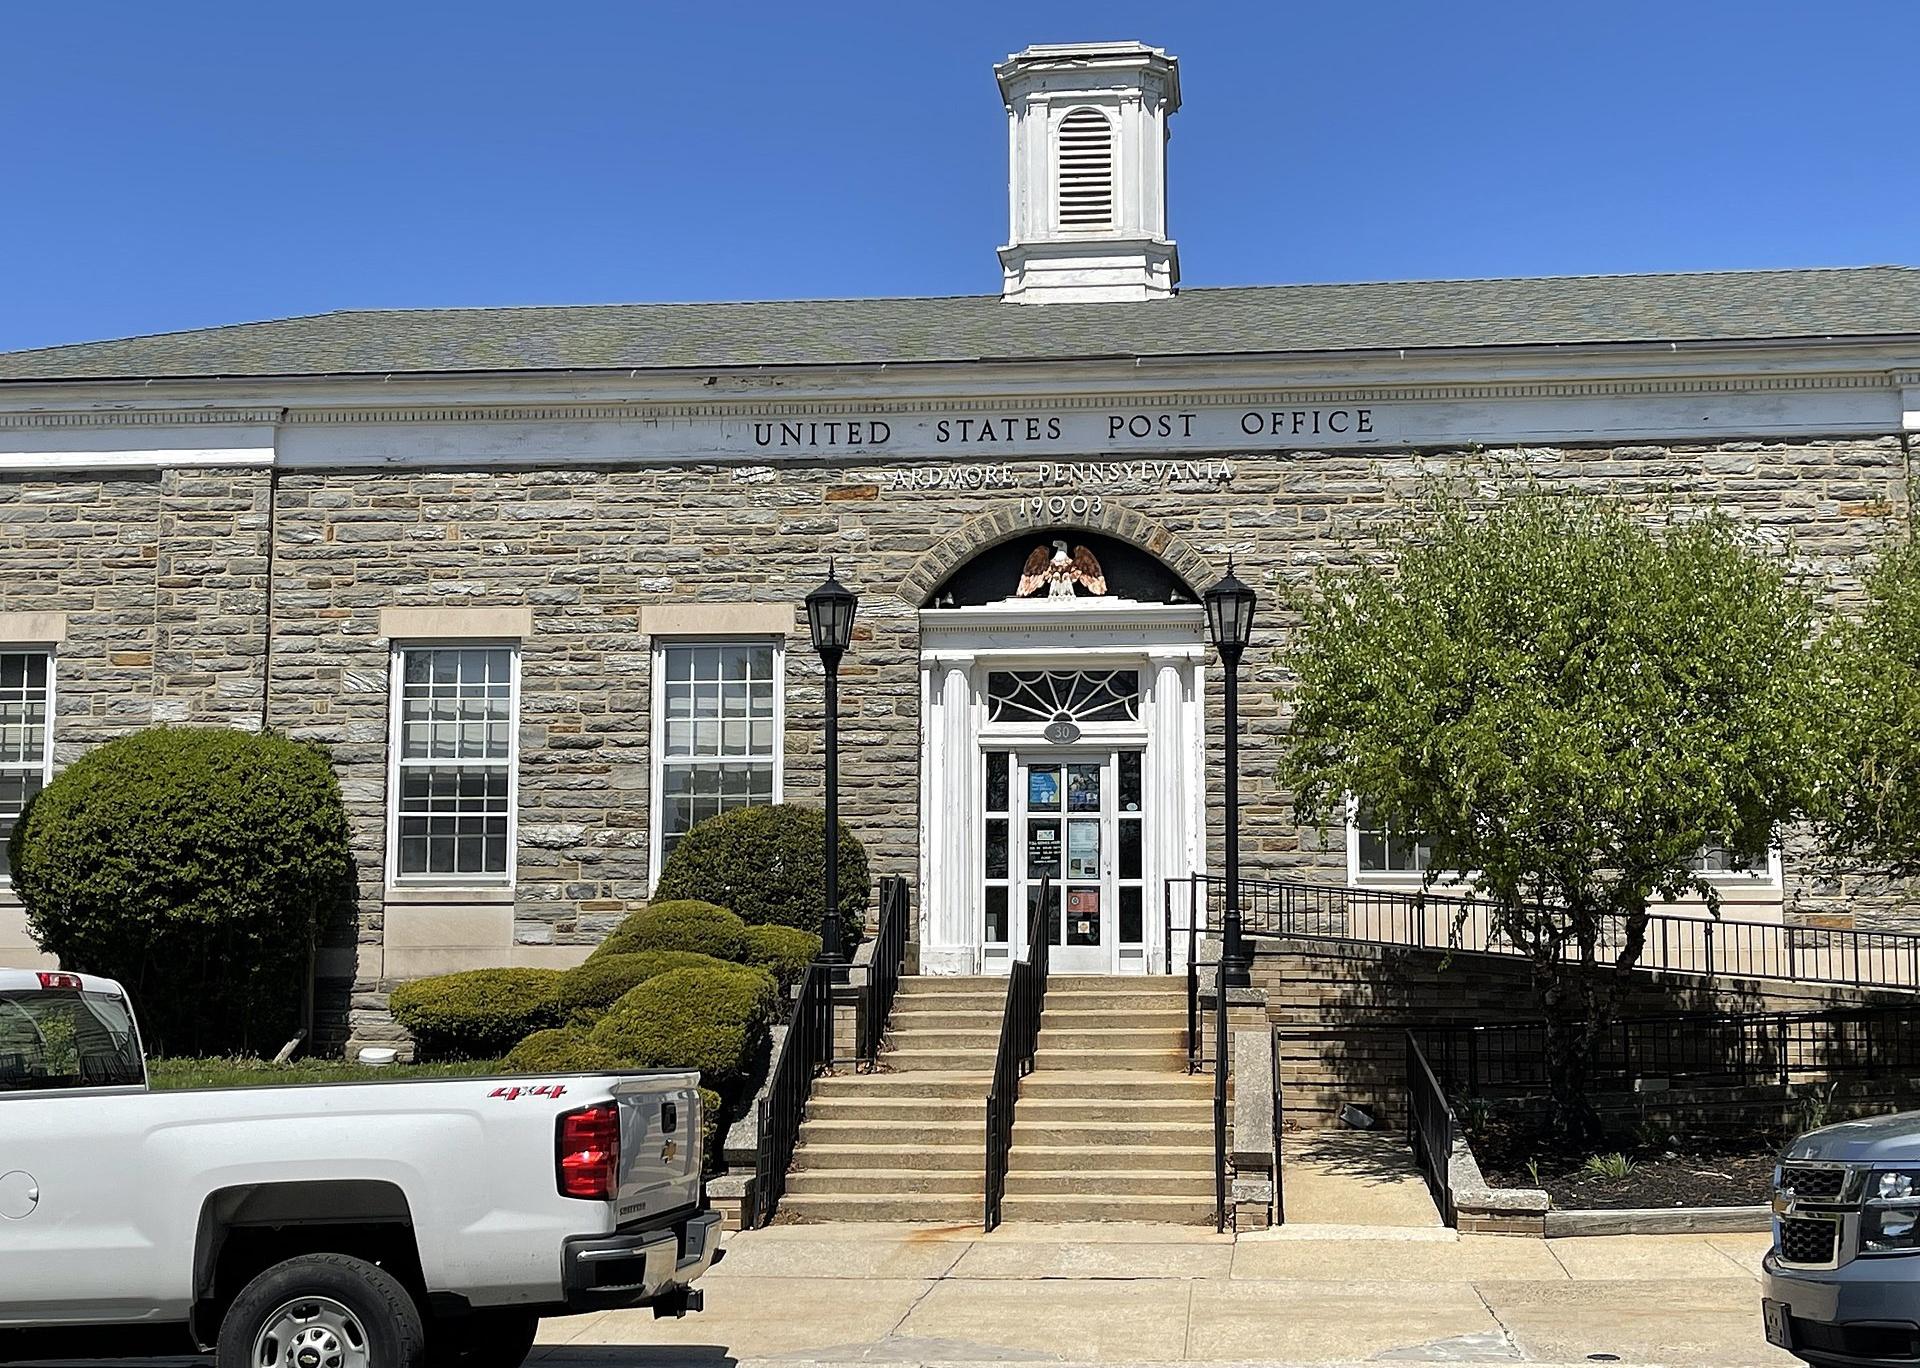
Ardmore, Pennsylvania, which is #1 on this list, is a Philadelphia suburb with a suburban and urban feel where many residents are liberal and young professionals. The historic Black community offers many amenities and institutions, including basketball courts, a swimming pool, a library, and a variety of vibrant restaurants, breweries, and live music at the Ardmore Music Hall.
College Terrace, California—#23 on this list and near the Stanford University campus—provides a college-town atmosphere and offers residents walkable streets filled with boutiques and restaurants. Arlington, Virginia, #50 on this list, is located in the Washington D.C. area, making it a perfect place for people who want to enjoy the D.C. nightlife—or who are happy to simply commute into the city during the week. Arlington has an urban atmosphere, many parks, coffee shops, bars, and restaurants, and residents include many young professionals.
Keep reading to learn more about the best liberal places to live in the U.S., including their population, median rent, median home value, area feel, and more.
You may also like: These are the best cities to raise a family in
![]()
Sean Pavone // Shutterstock
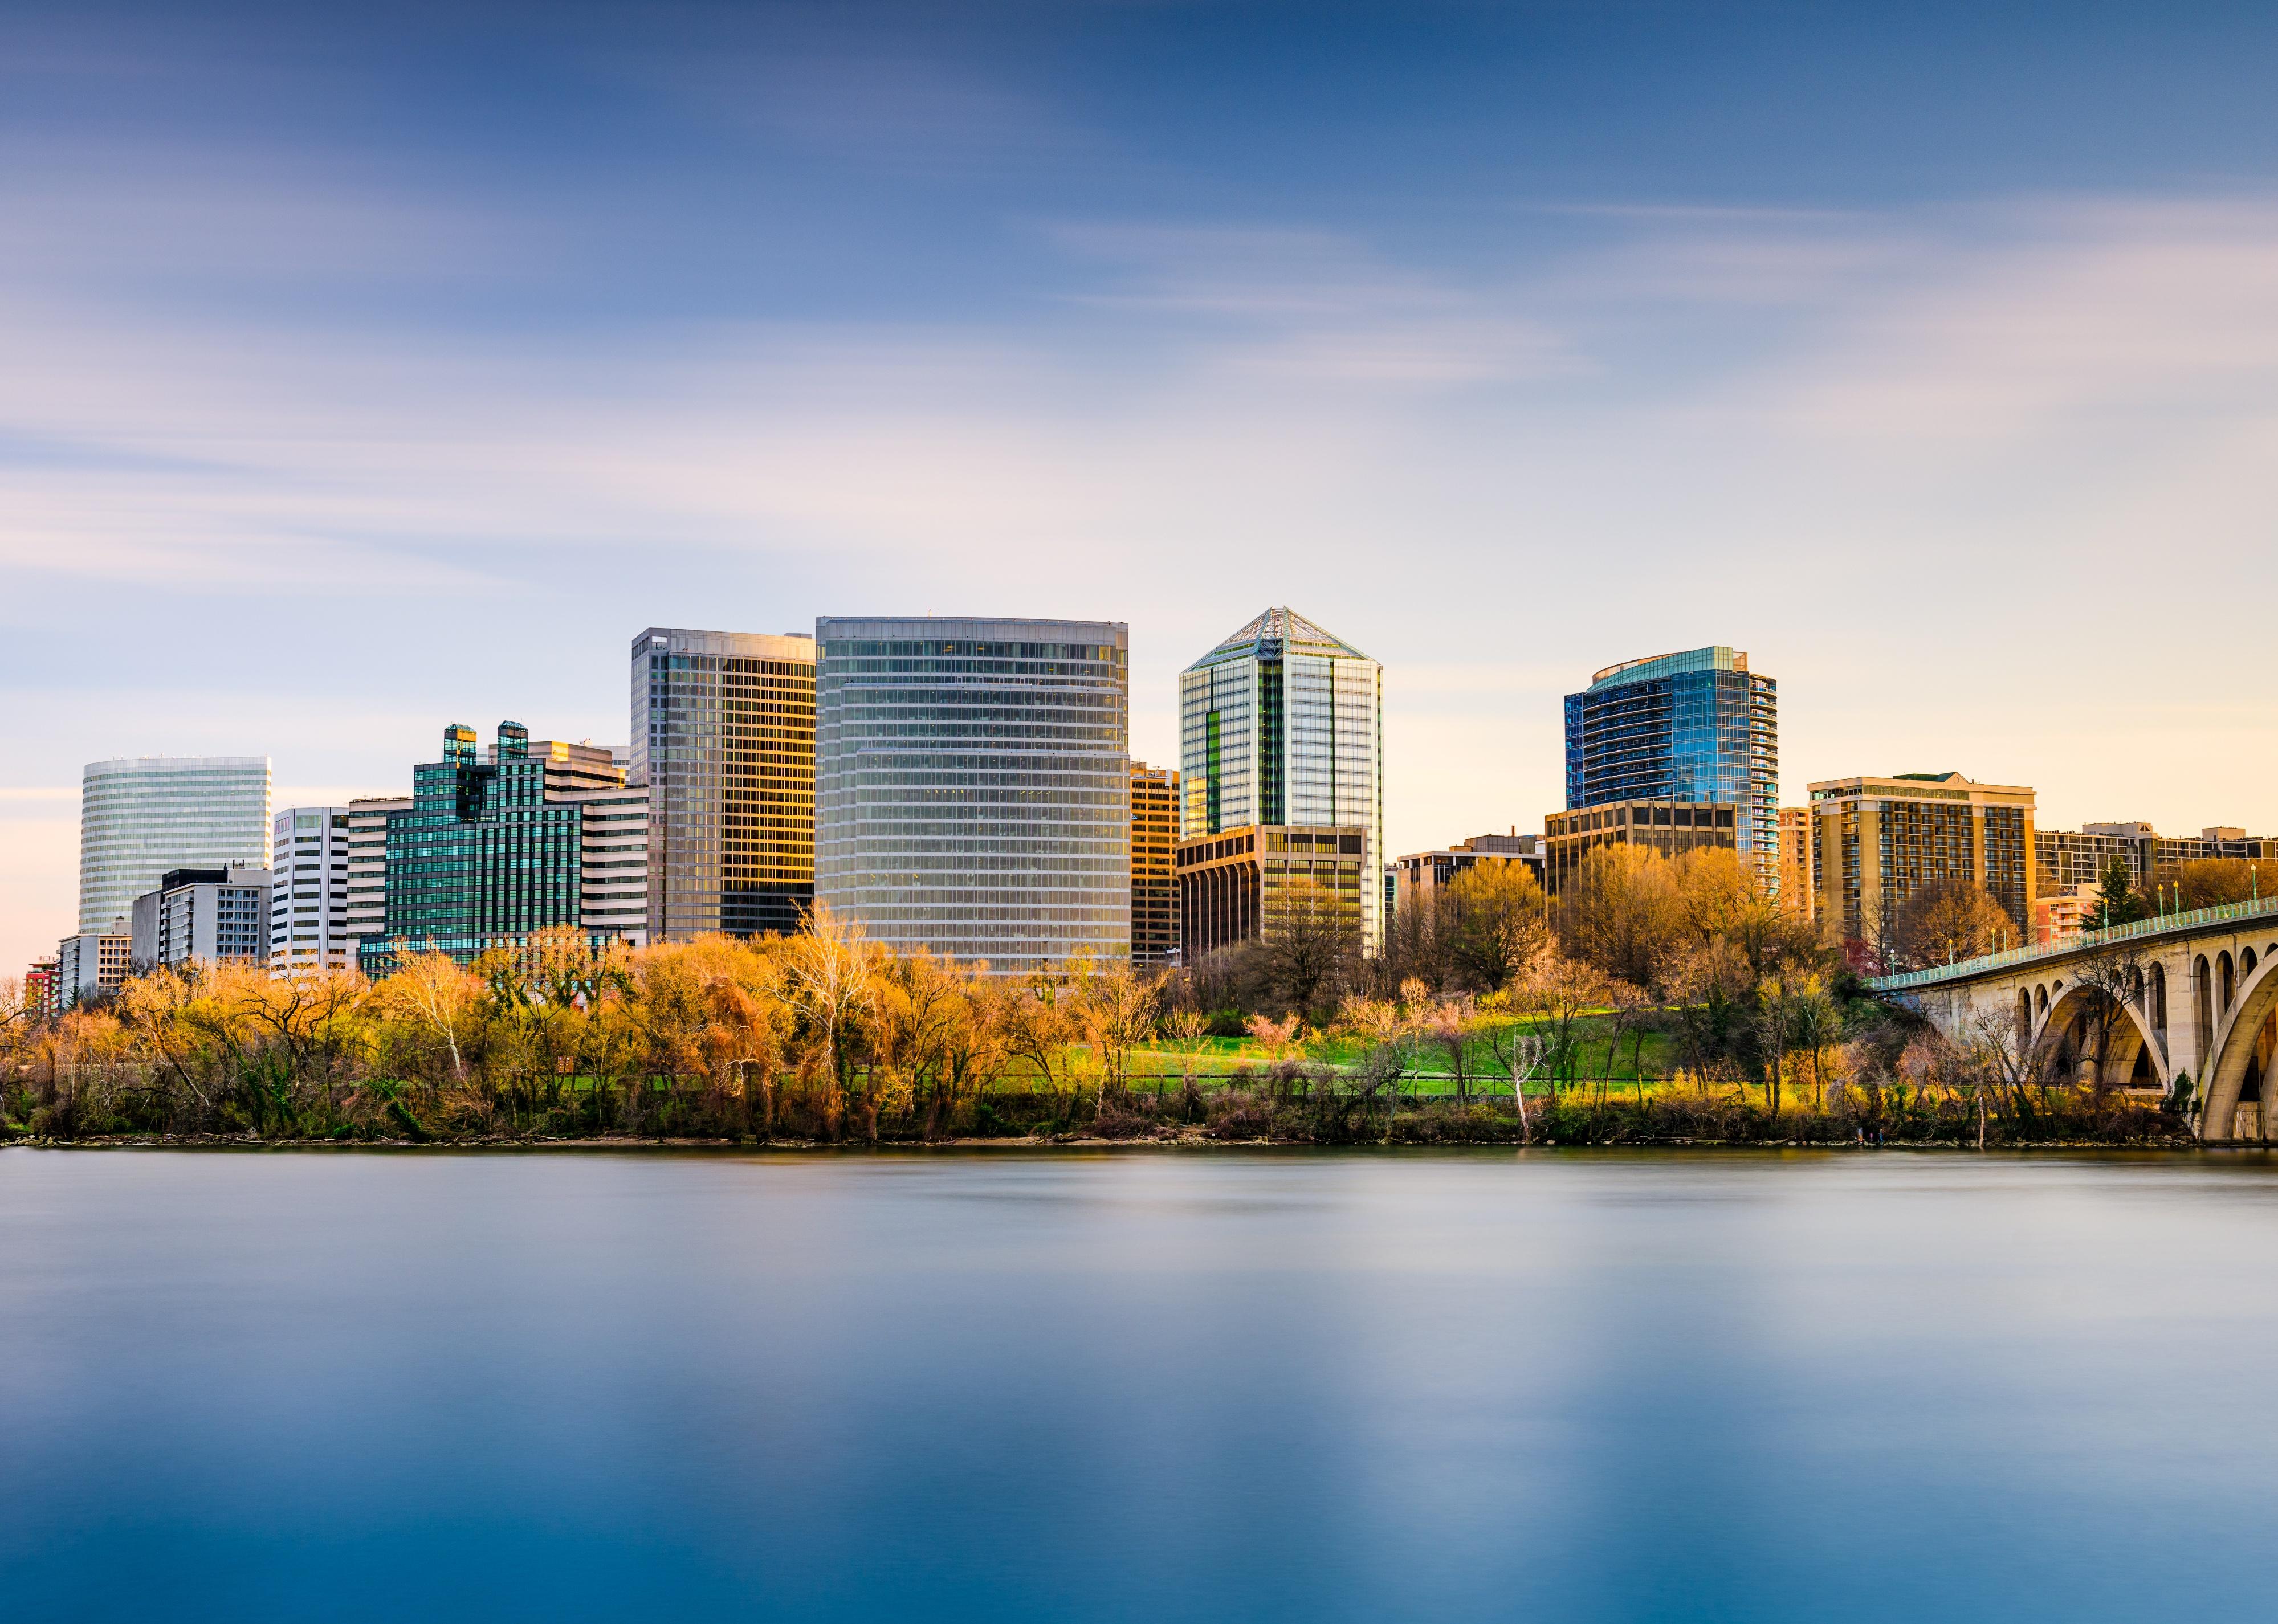
#50. Arlington, Virginia
Arlington, Virginia, city skyline on the Potomac River
– Population: 236,434
– Median household income: $122,604
– Median home value: $731,700
– Median rent: $2,005
– Percent of people who own a home: 43%
– Area feel: Urban
William A. Morgan // Shutterstock
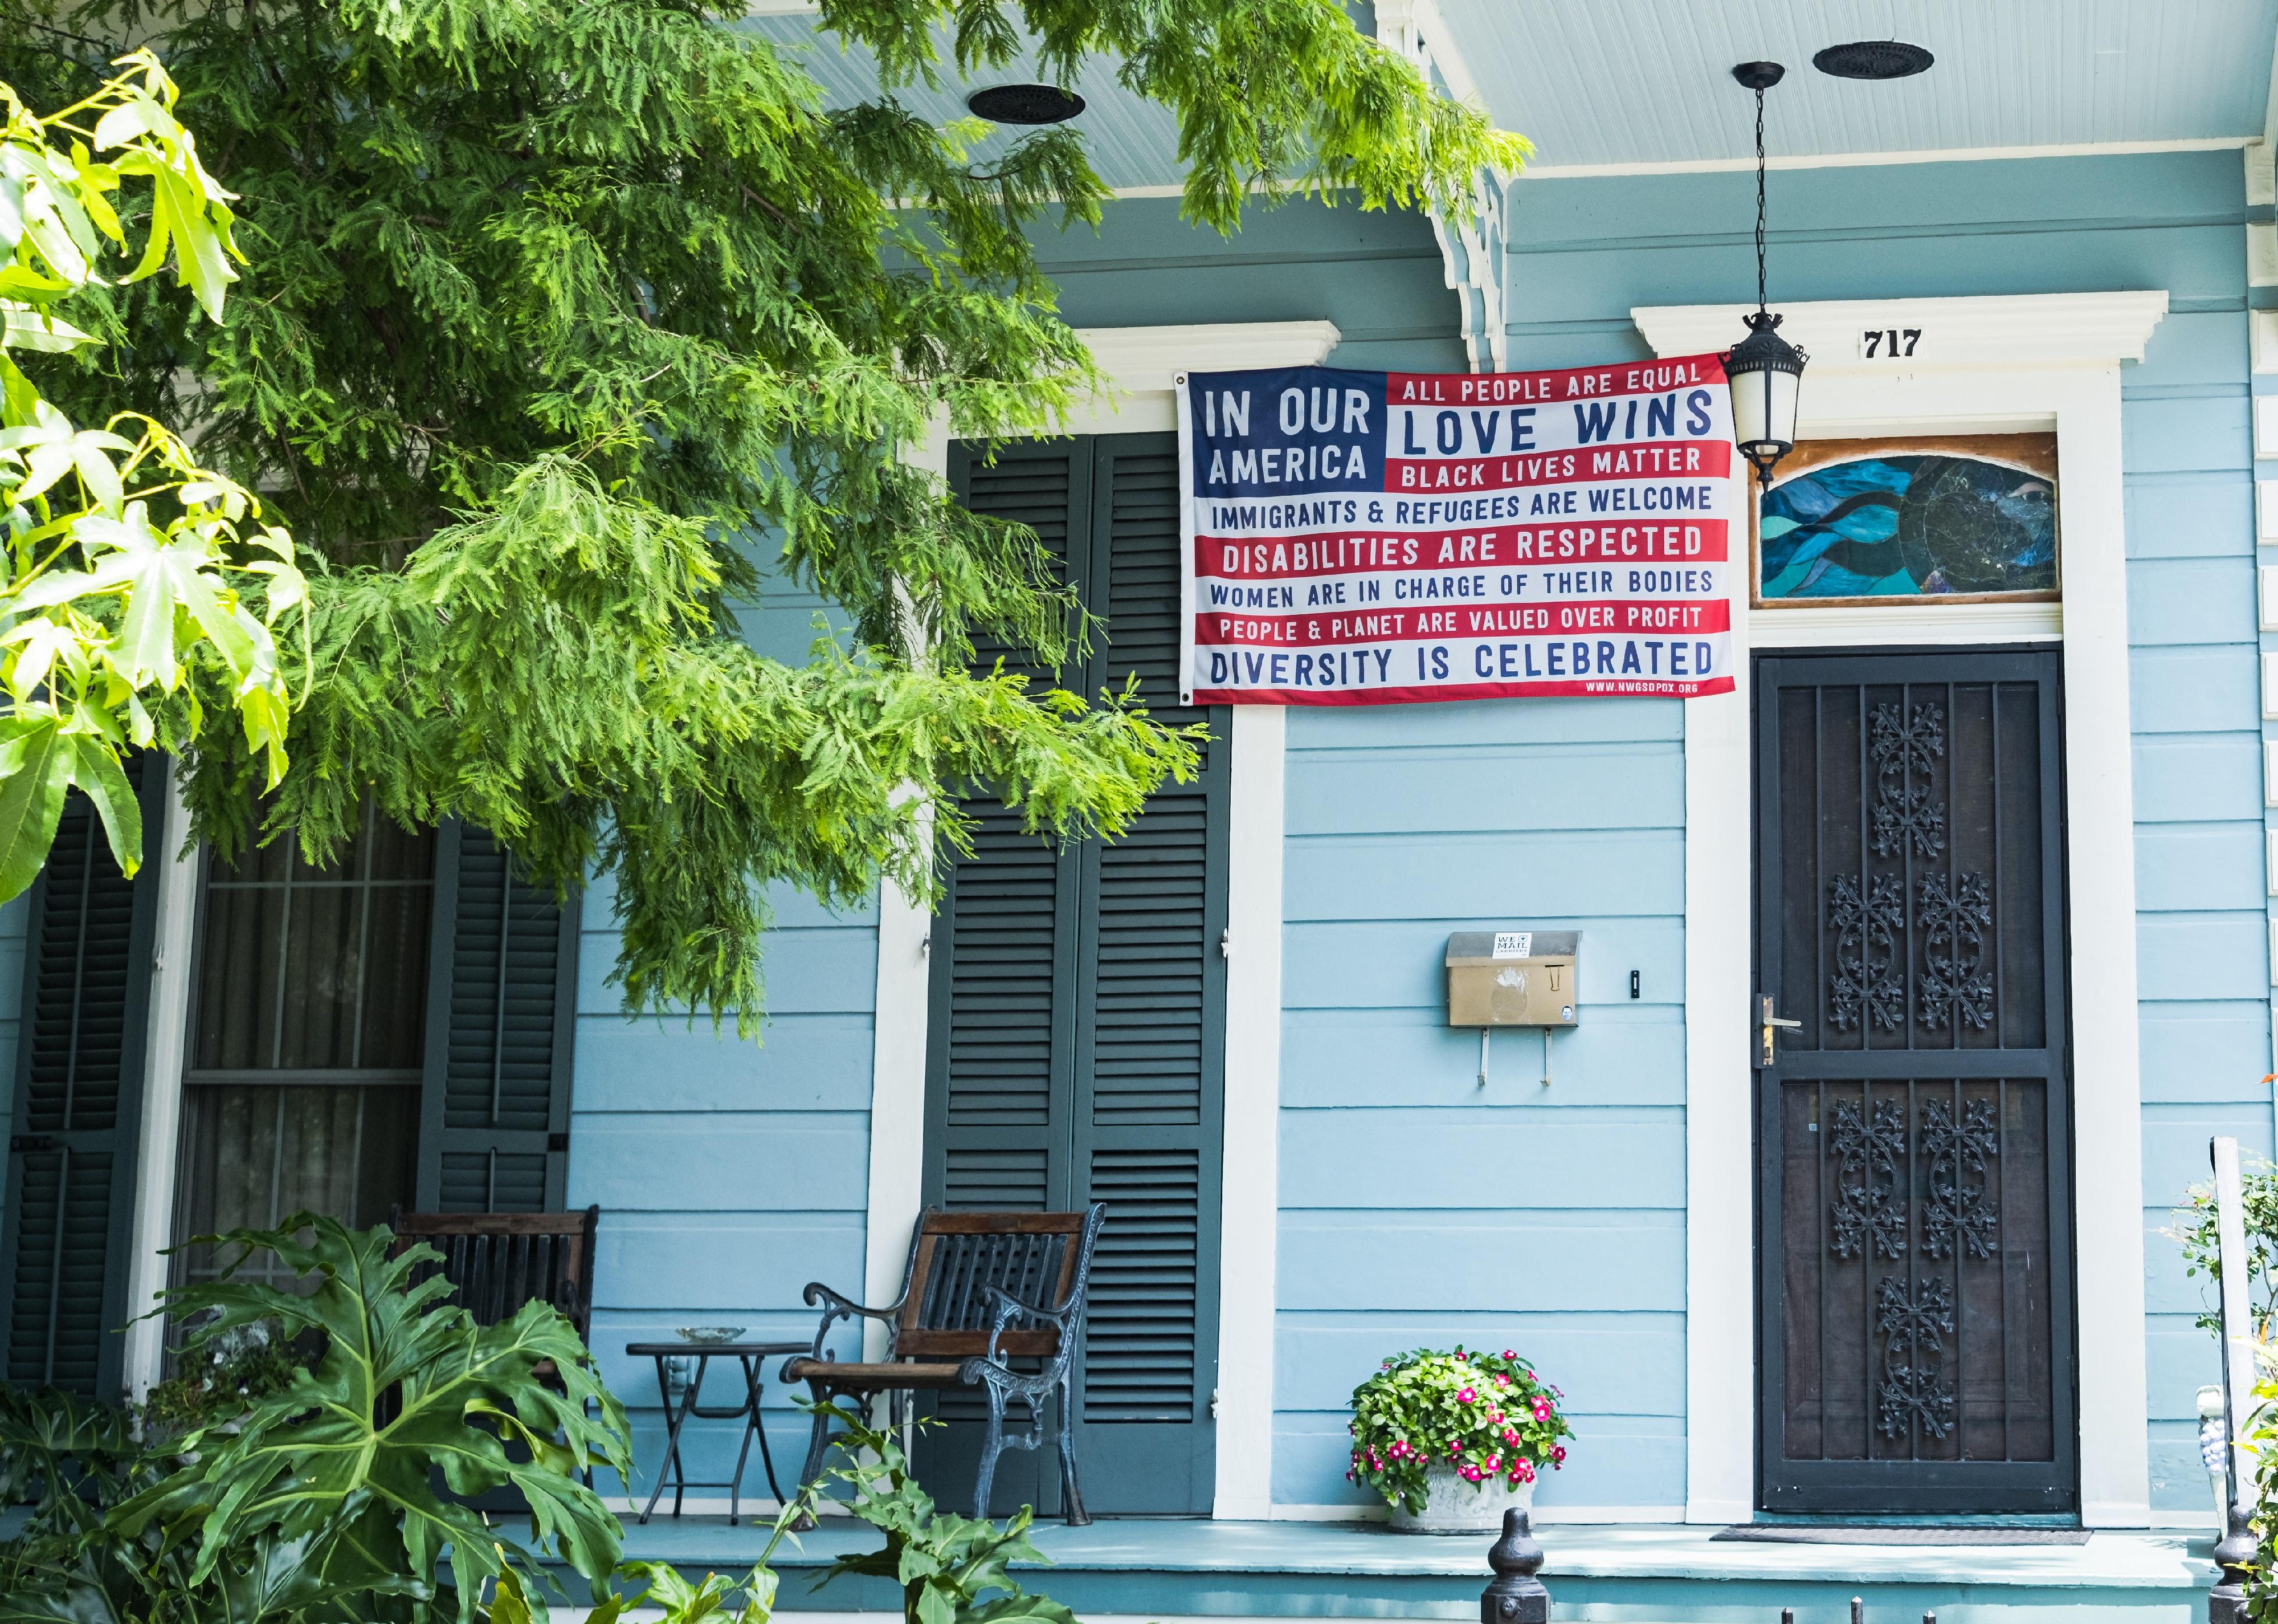
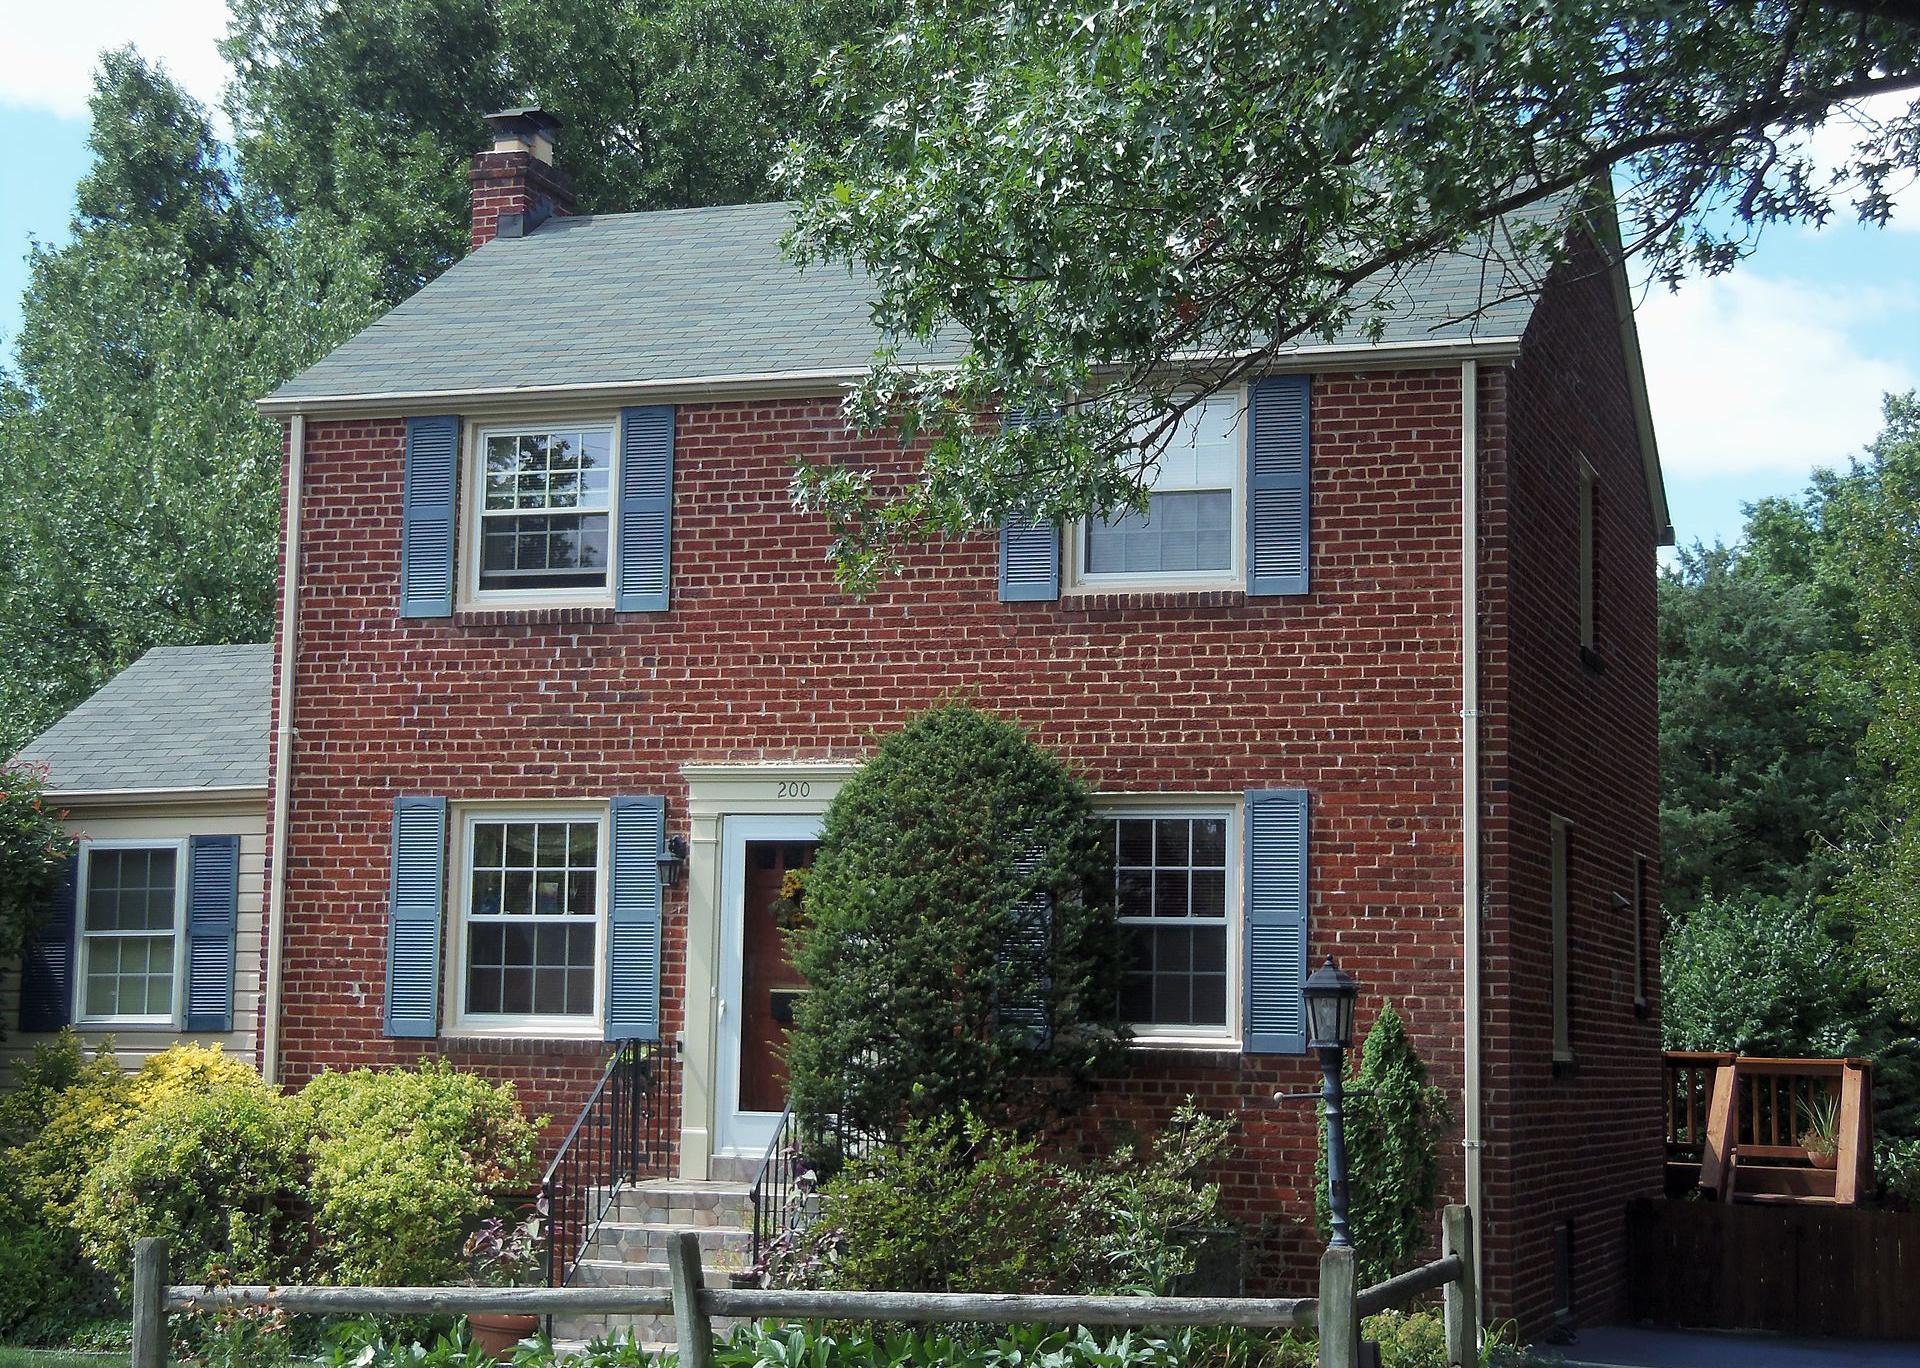
#49. North Highland, Virginia
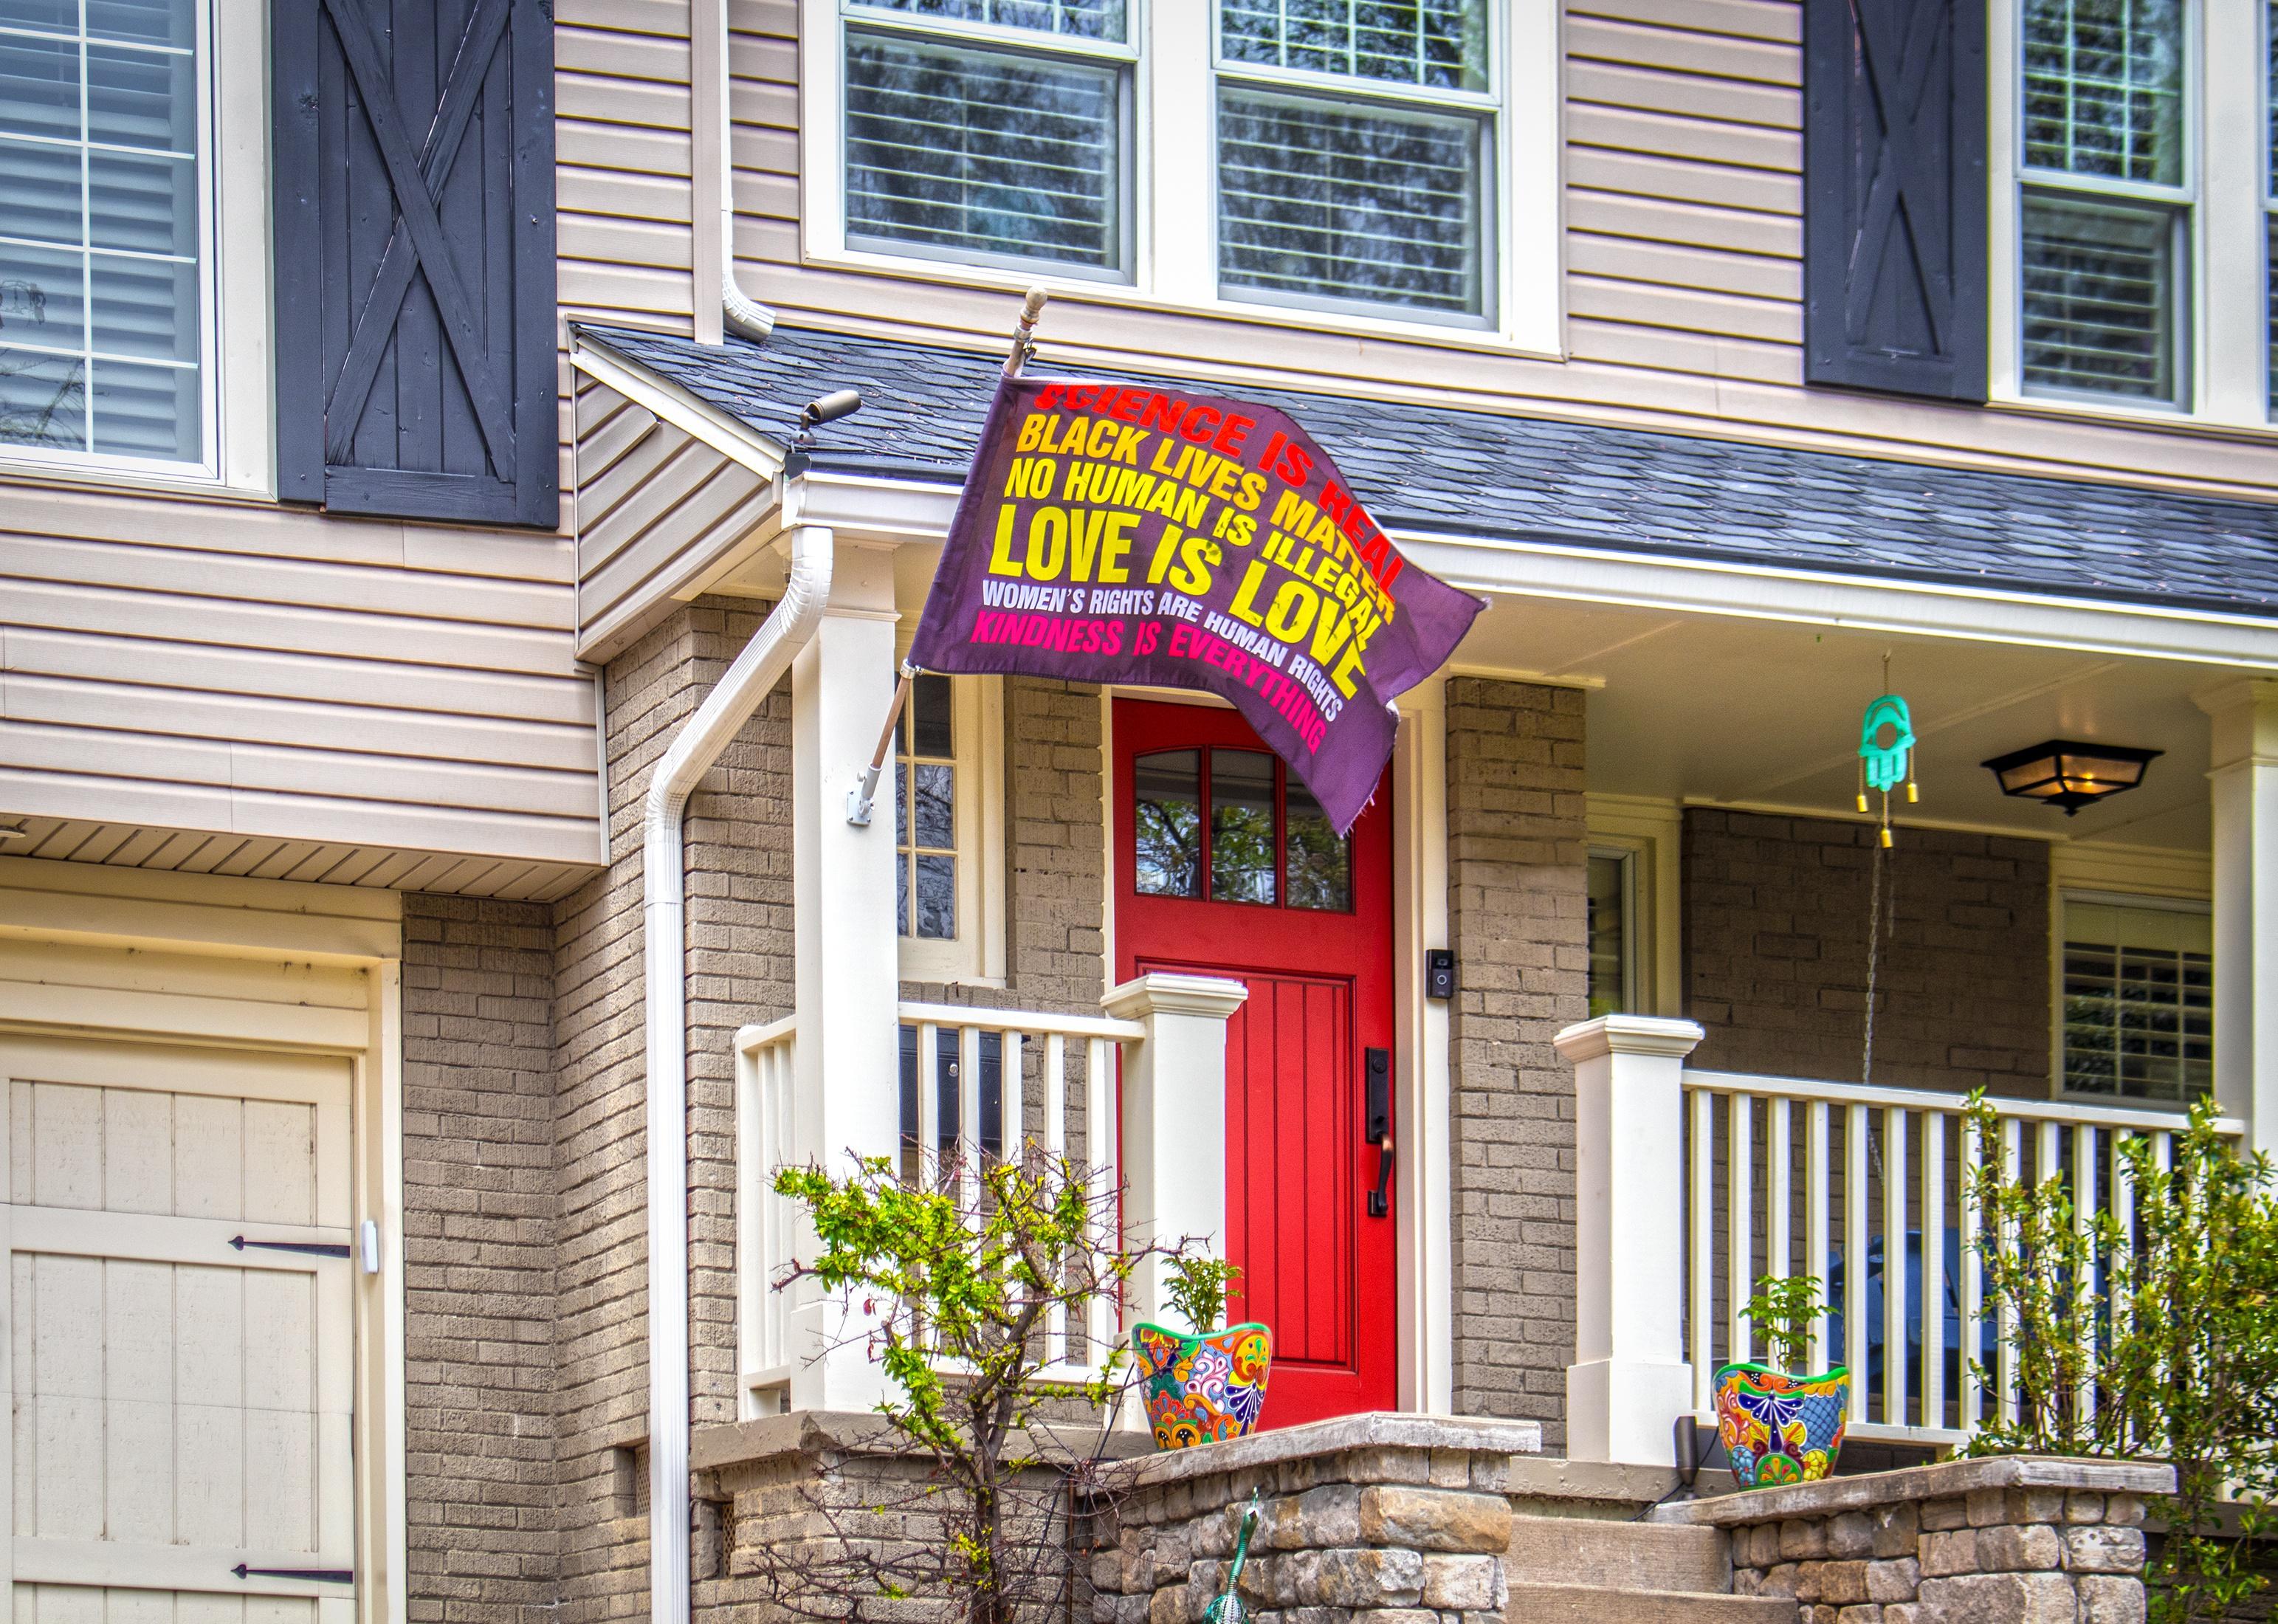
American flag with a message on front porch
– Population: 4,423
– Median household income: $109,407
– Median home value: $516,370
– Median rent: $1,936
– Percent of people who own a home: 33%
– Area feel: null
BublikHaus // Shutterstock
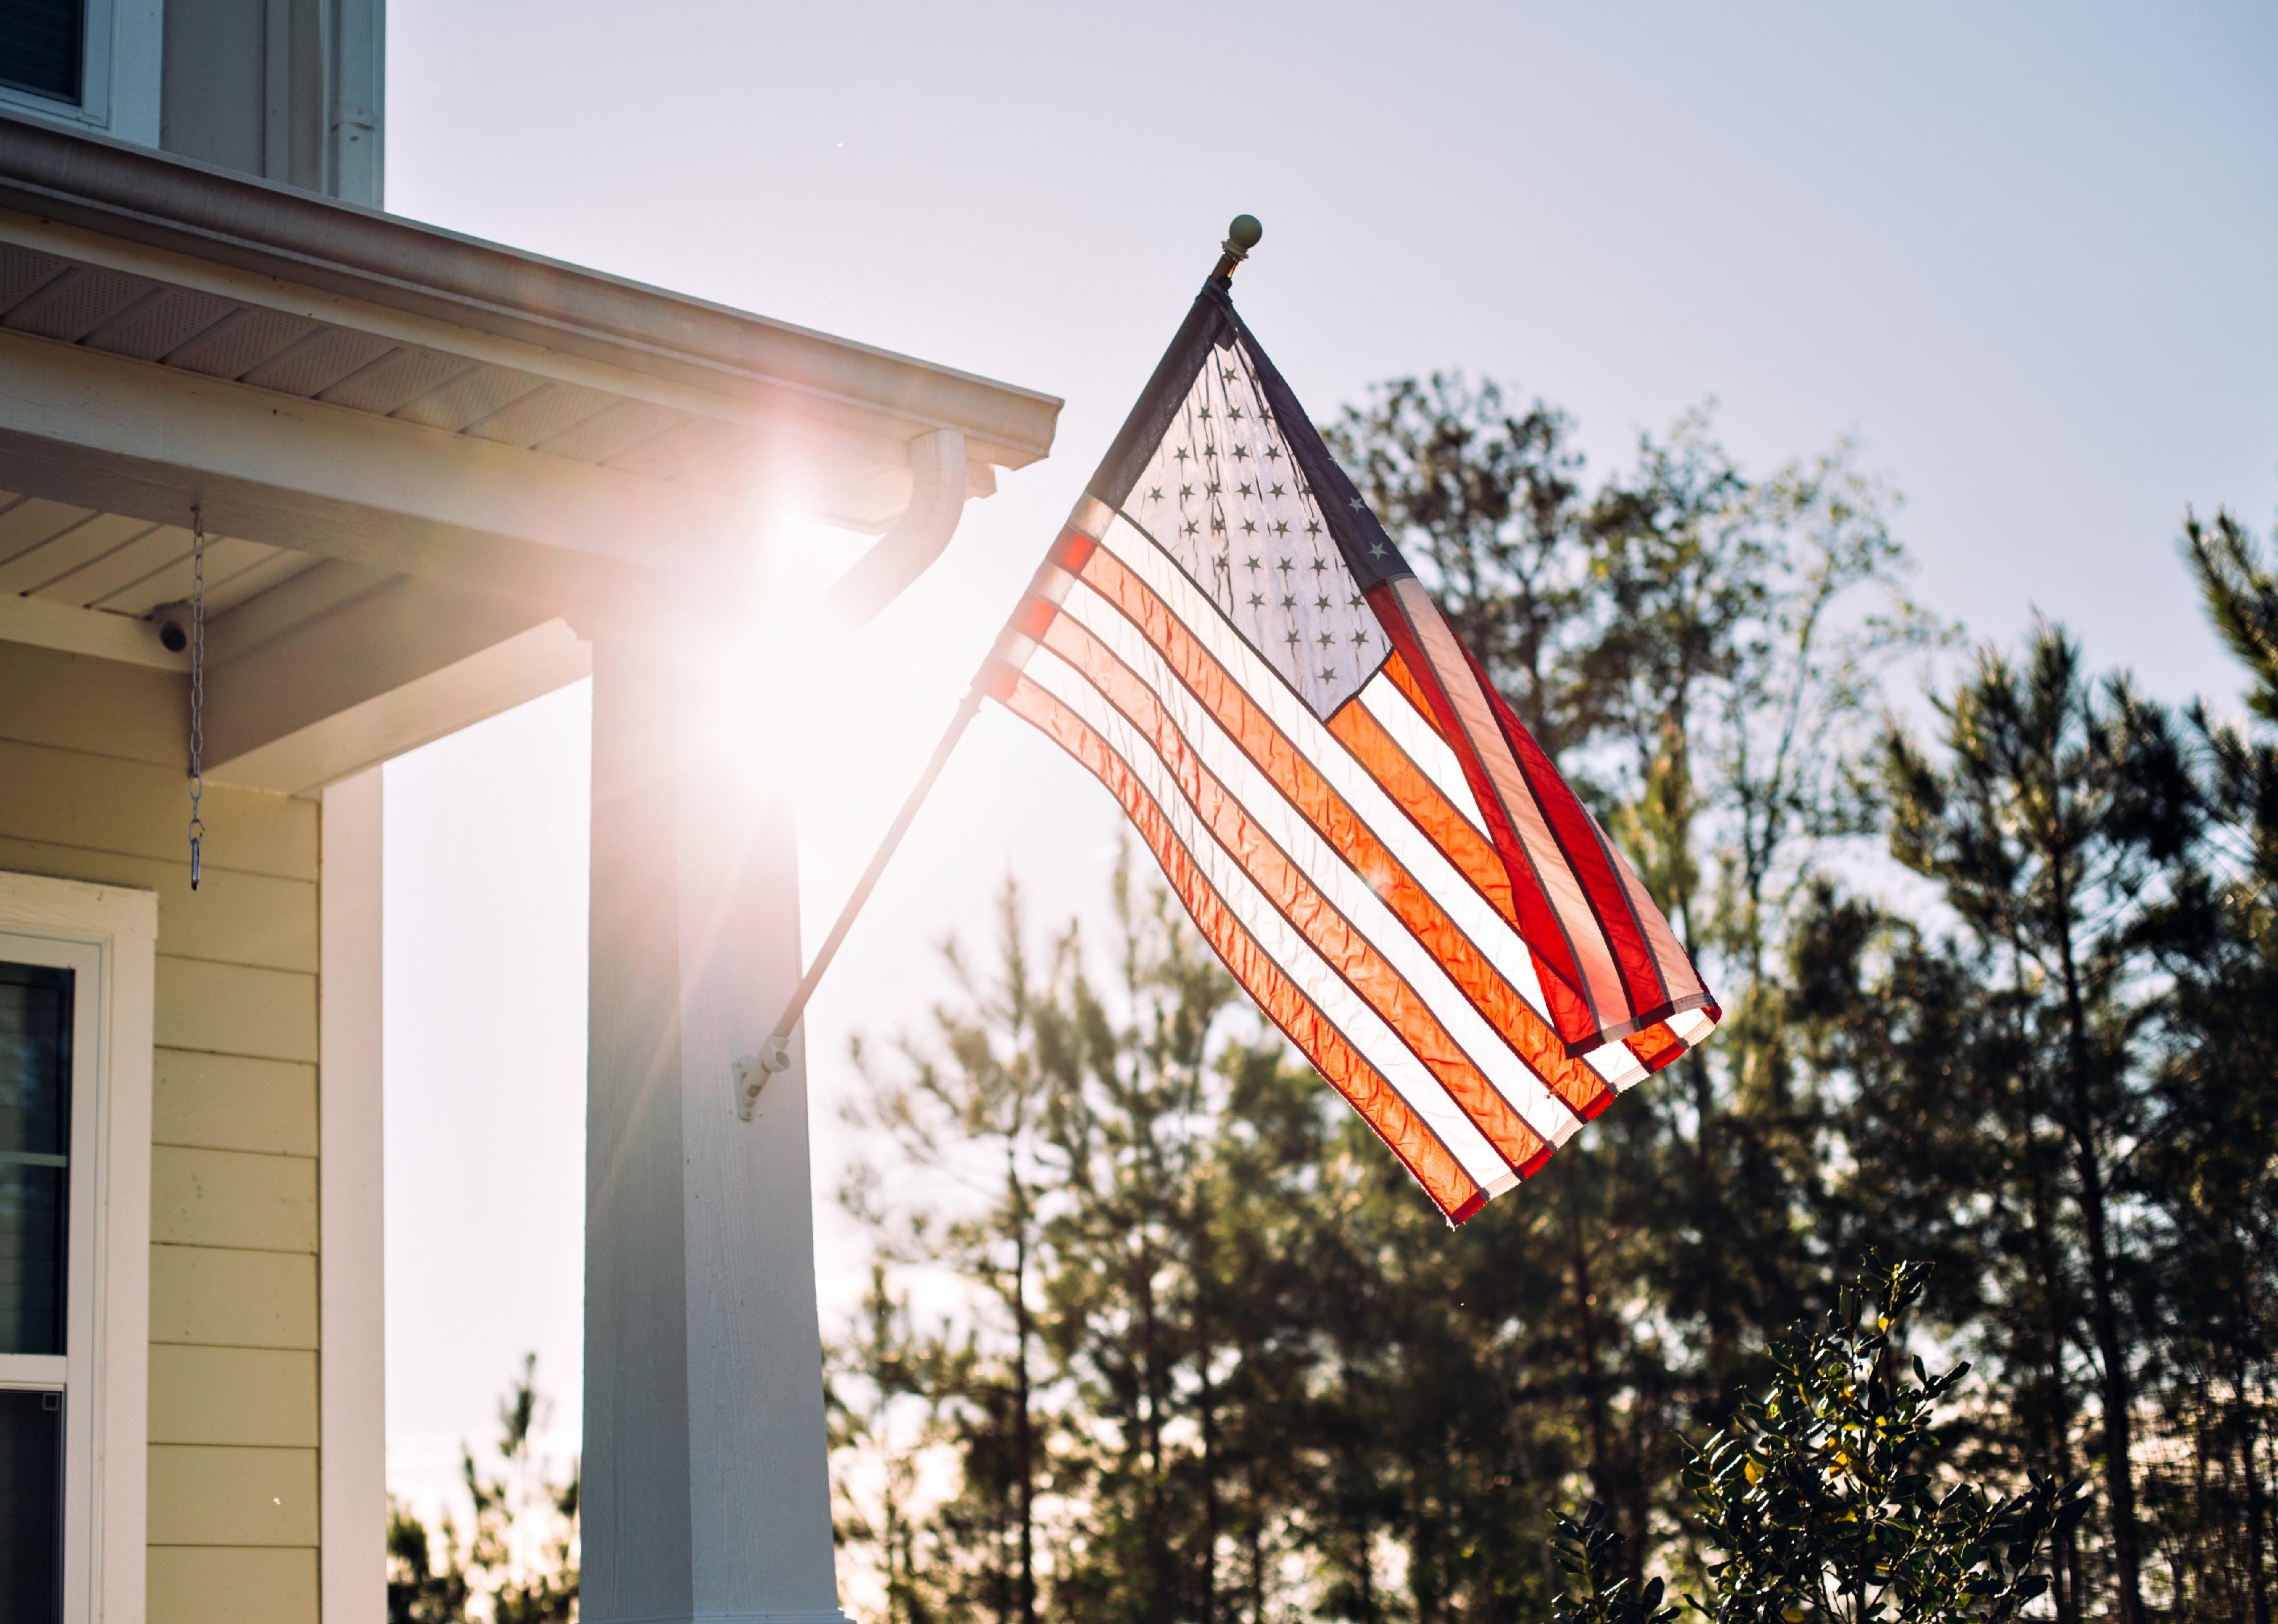
#48. Community Center, California
Front side of typical American porch colonial house
– Population: 1,957
– Median household income: $242,292
– Median home value: $2,000,001
– Median rent: $2,982
– Percent of people who own a home: 80%
– Area feel: Sparse suburban
VDB Photos // Shutterstock
#47. Princeton Meadows, New Jersey
Rainbow Pride flag on the front of a residential house
– Population: 14,261
– Median household income: $112,520
– Median home value: $14,261
– Median rent: $1,622
– Percent of people who own a home: 43%
– Area feel: Urban suburban mix
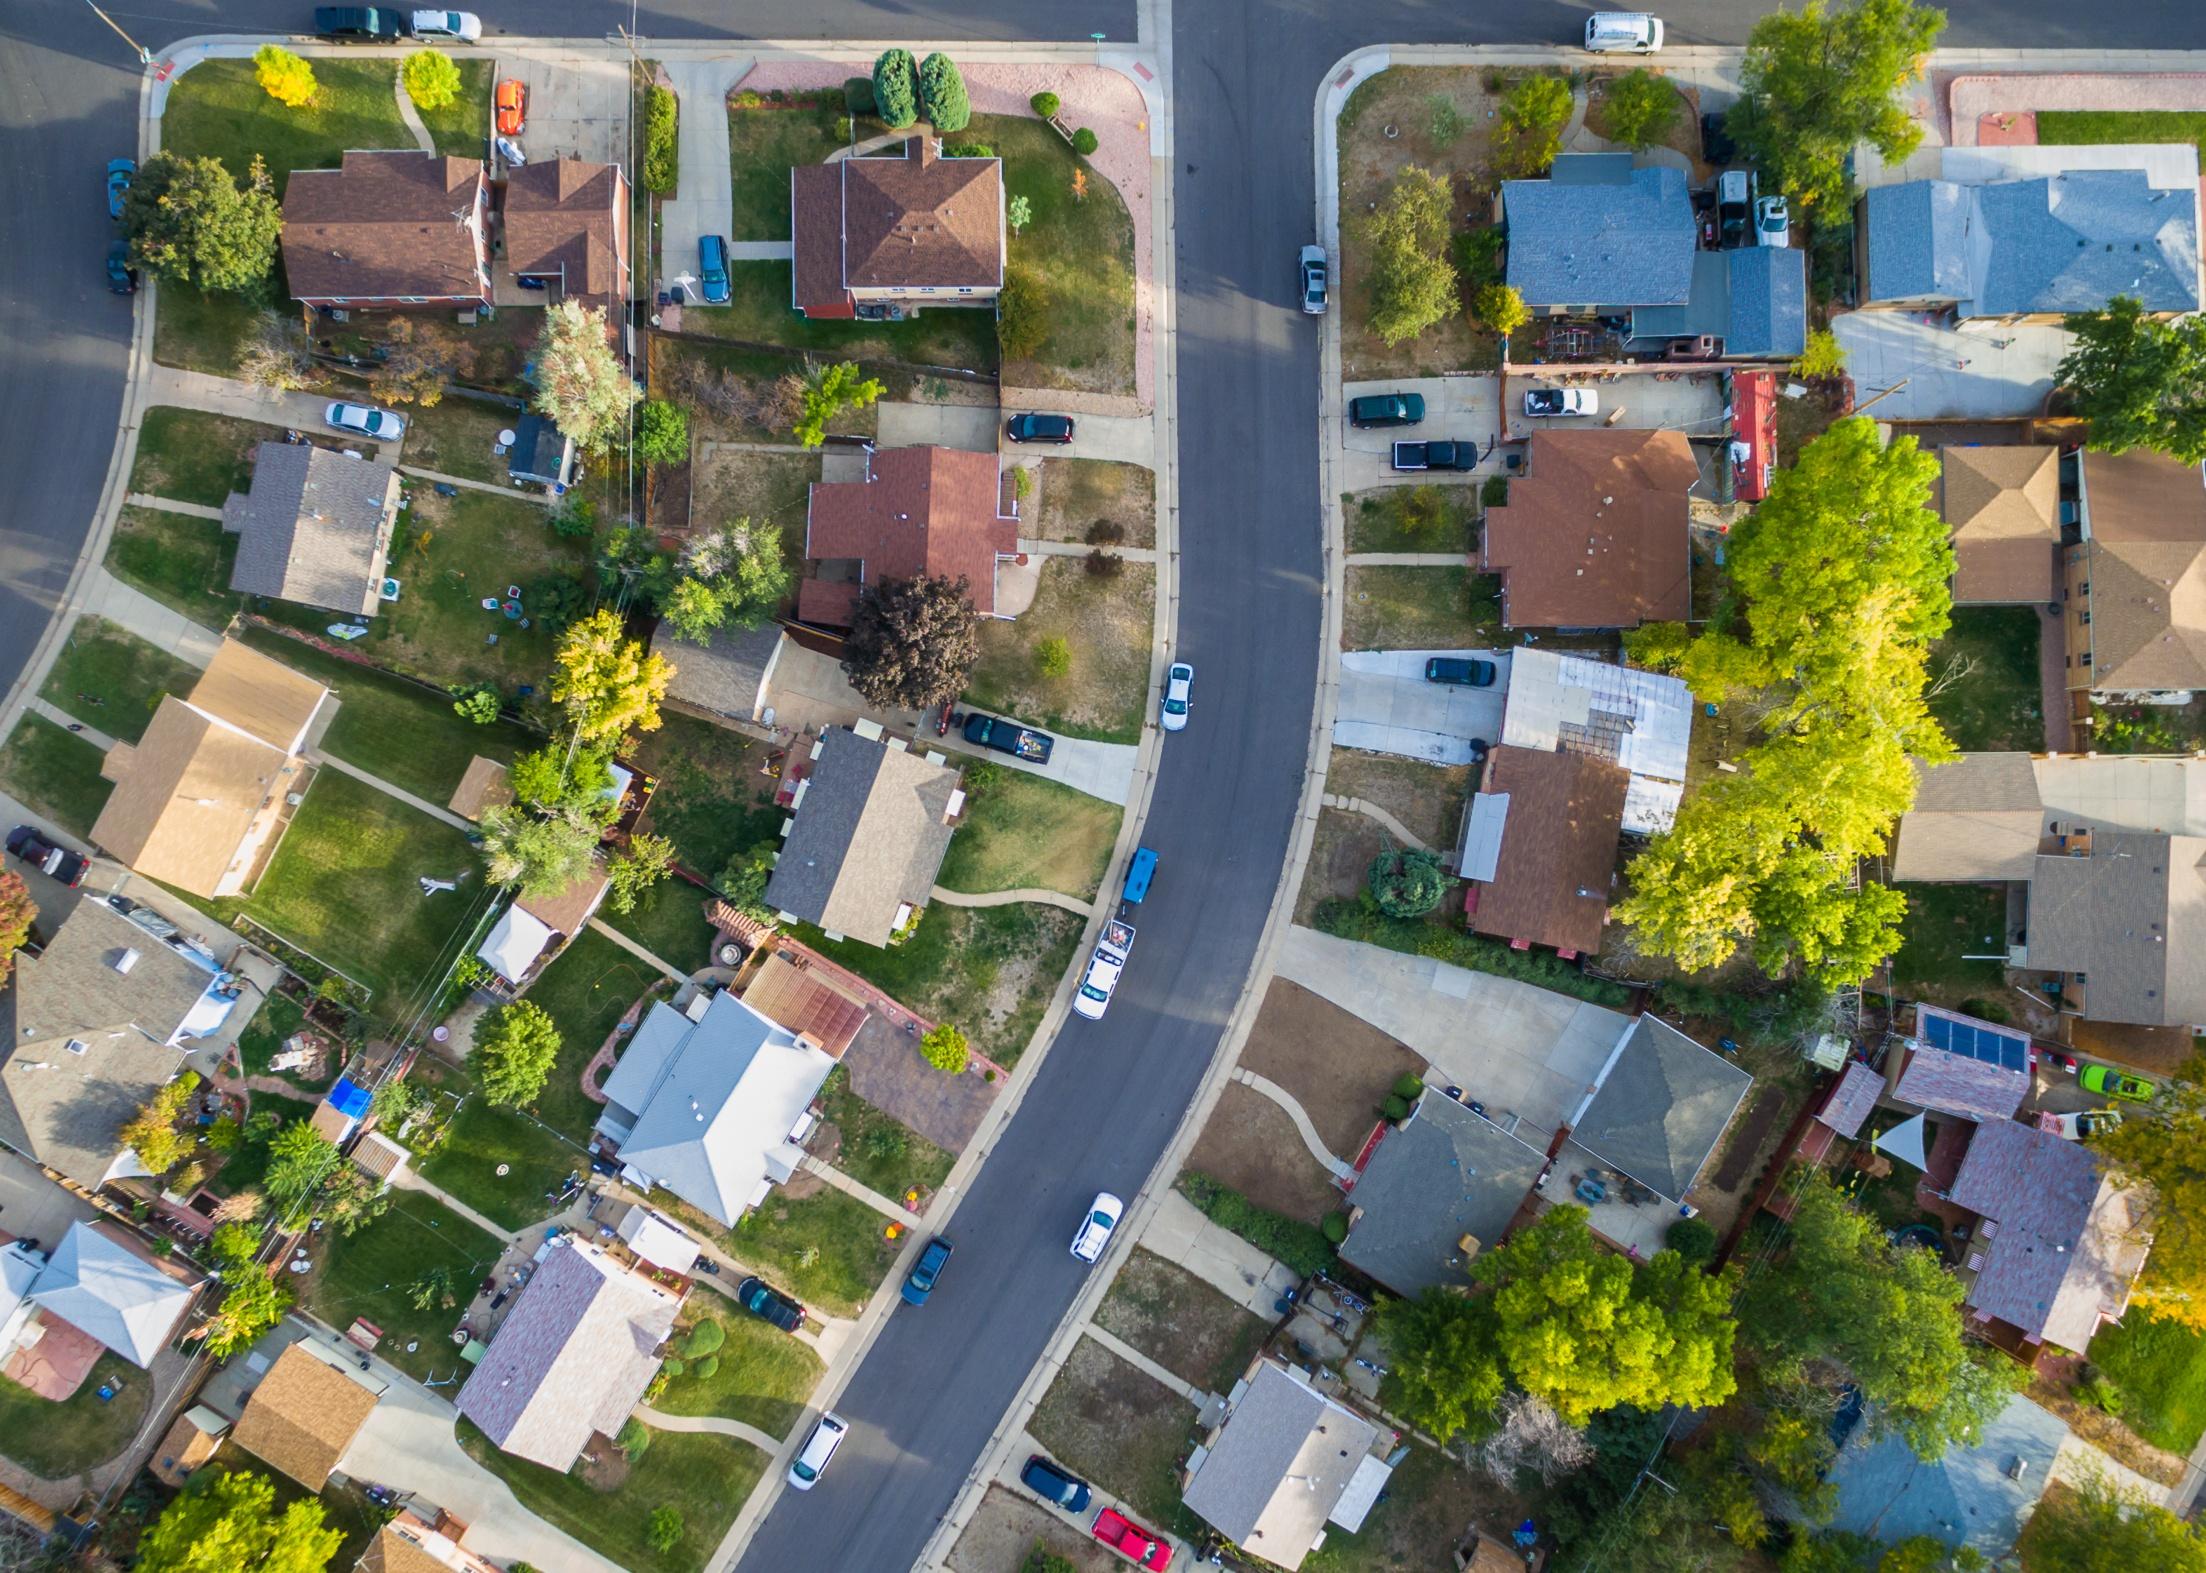
Arina P Habich // Shutterstock
#46. Agassiz, Massachusetts
Aerial view of residential neighborhood
– Population: 5,360
– Median household income: $115,077
– Median home value: $1,268,583
– Median rent: $2,391
– Percent of people who own a home: 31%
– Area feel: Urban
You may also like: Best places to live in the Midwest
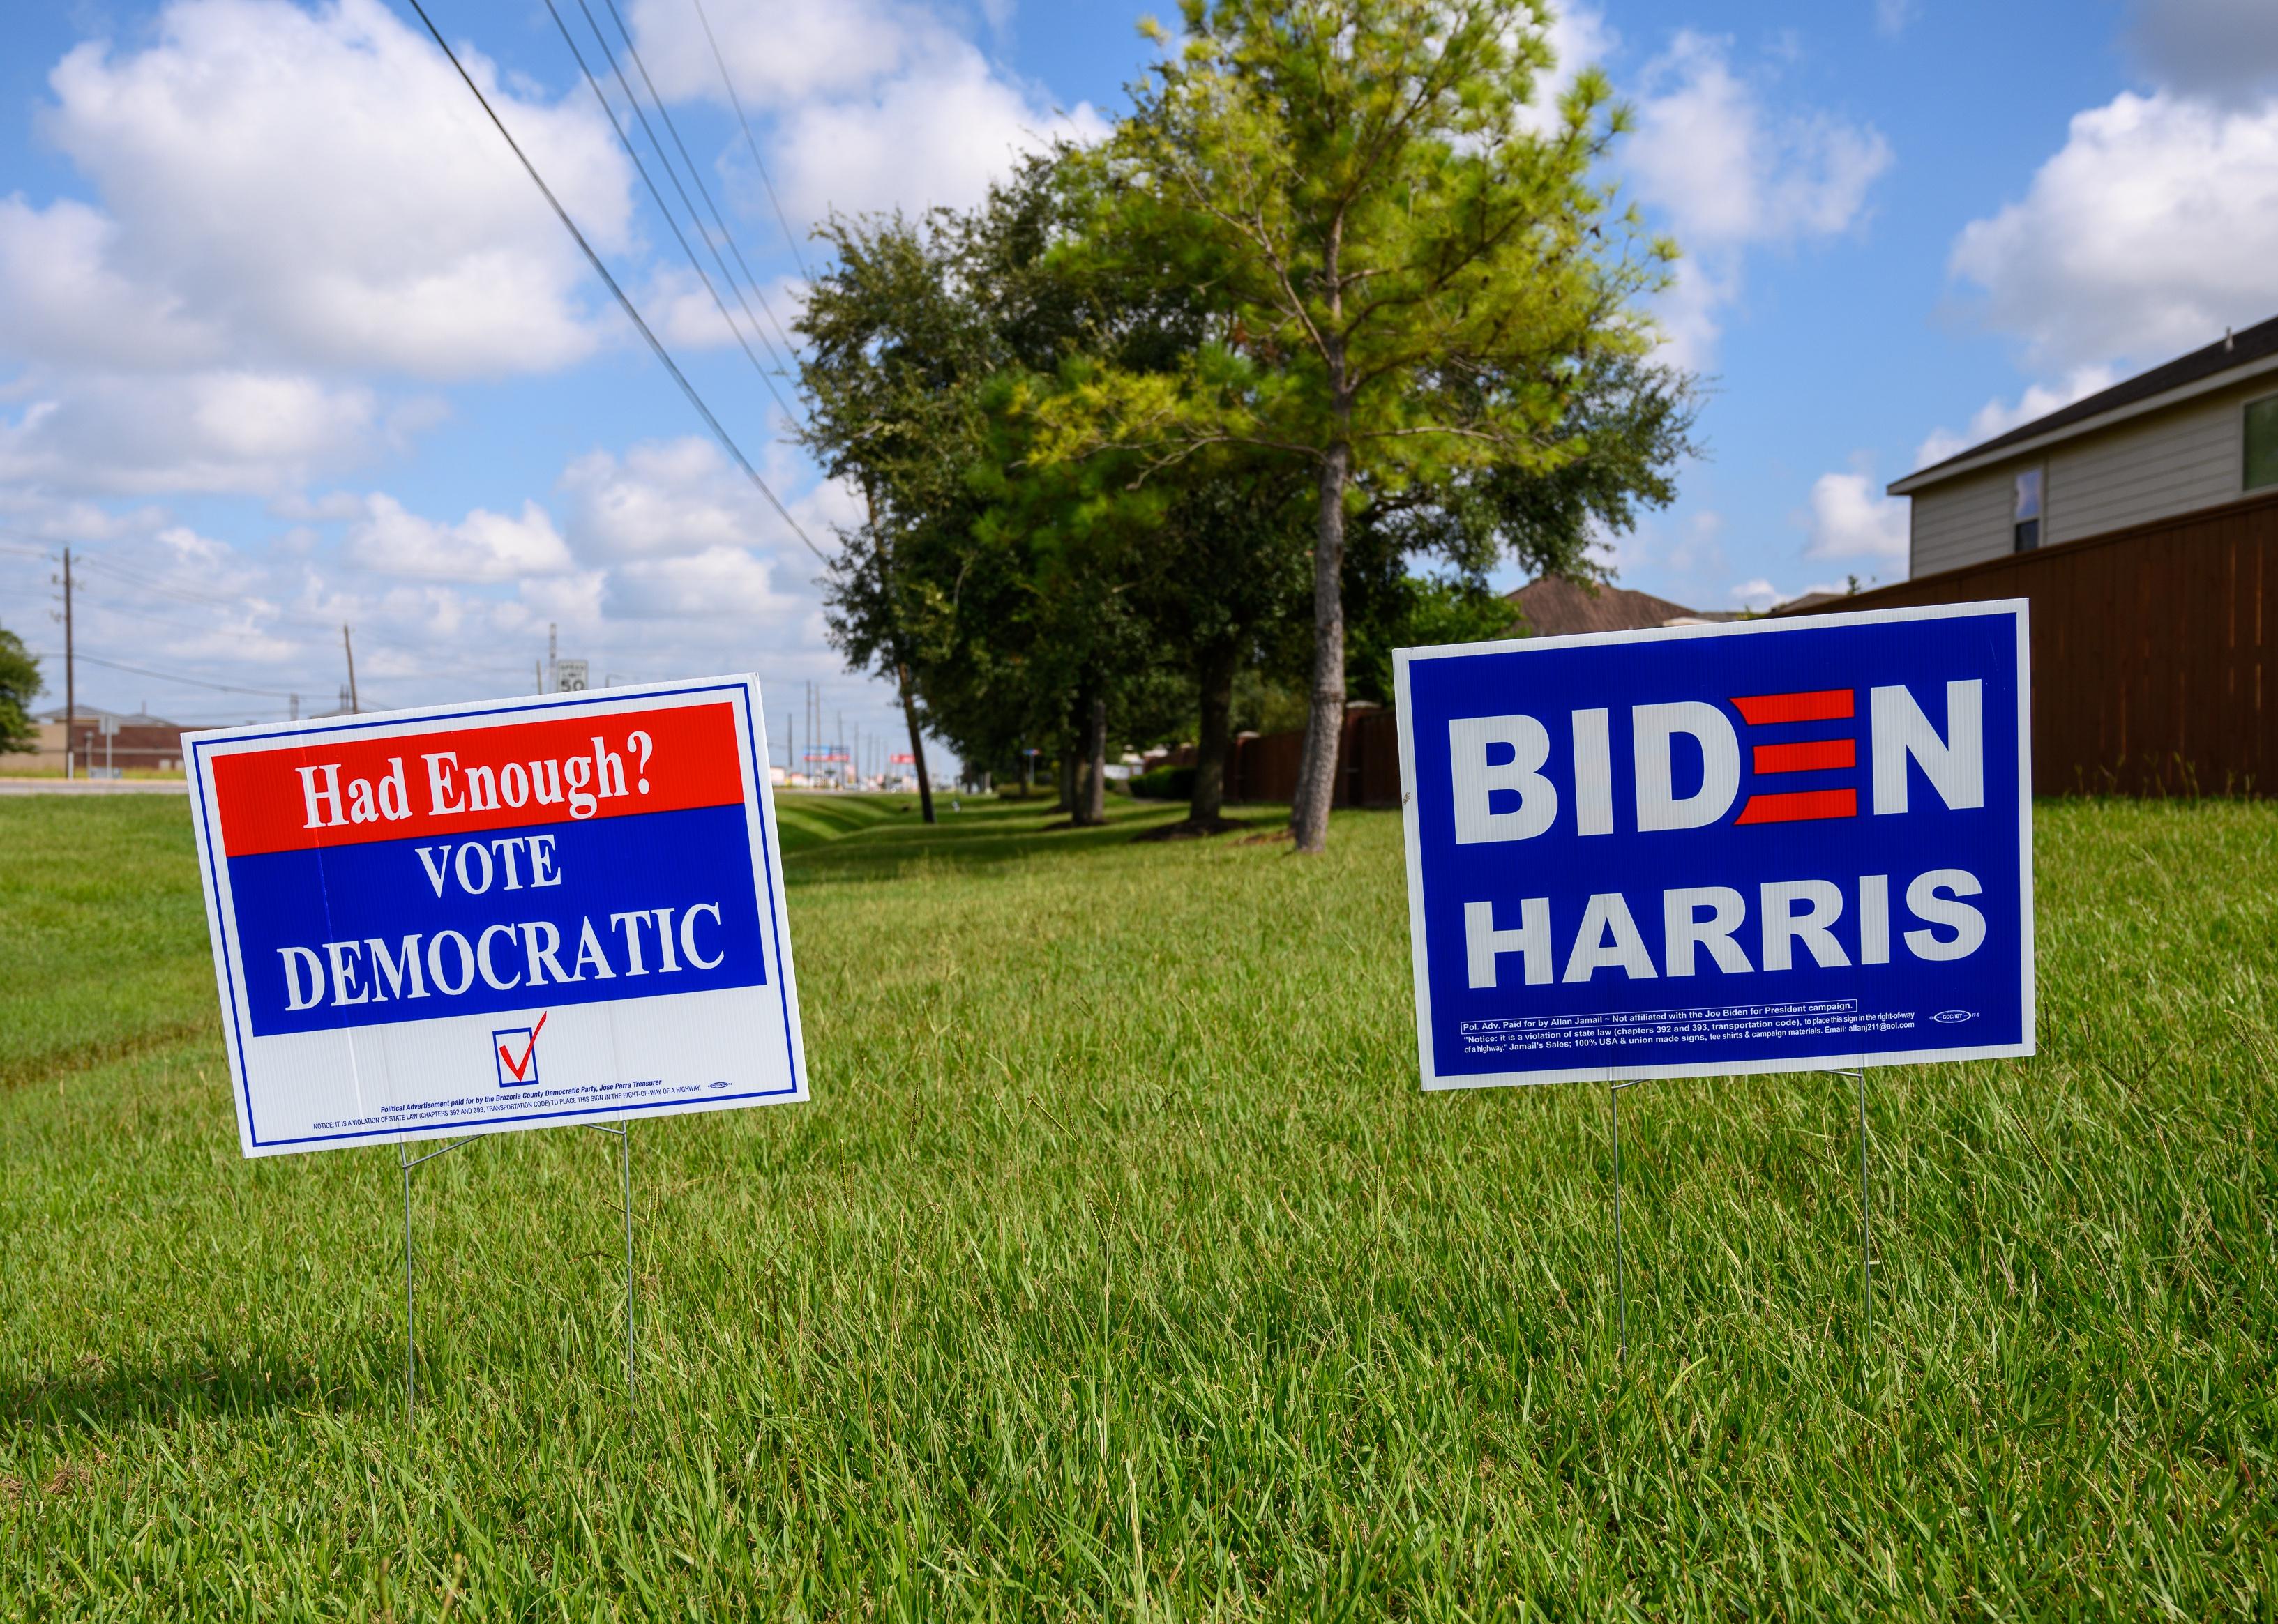
michelmond // Shutterstock
#45. Greenmeadow, California
Election signs in a yard
– Population: 2,132
– Median household income: $208,524
– Median home value: $1,968,986
– Median rent: $2,531
– Percent of people who own a home: 75%
– Area feel: Urban suburban mix
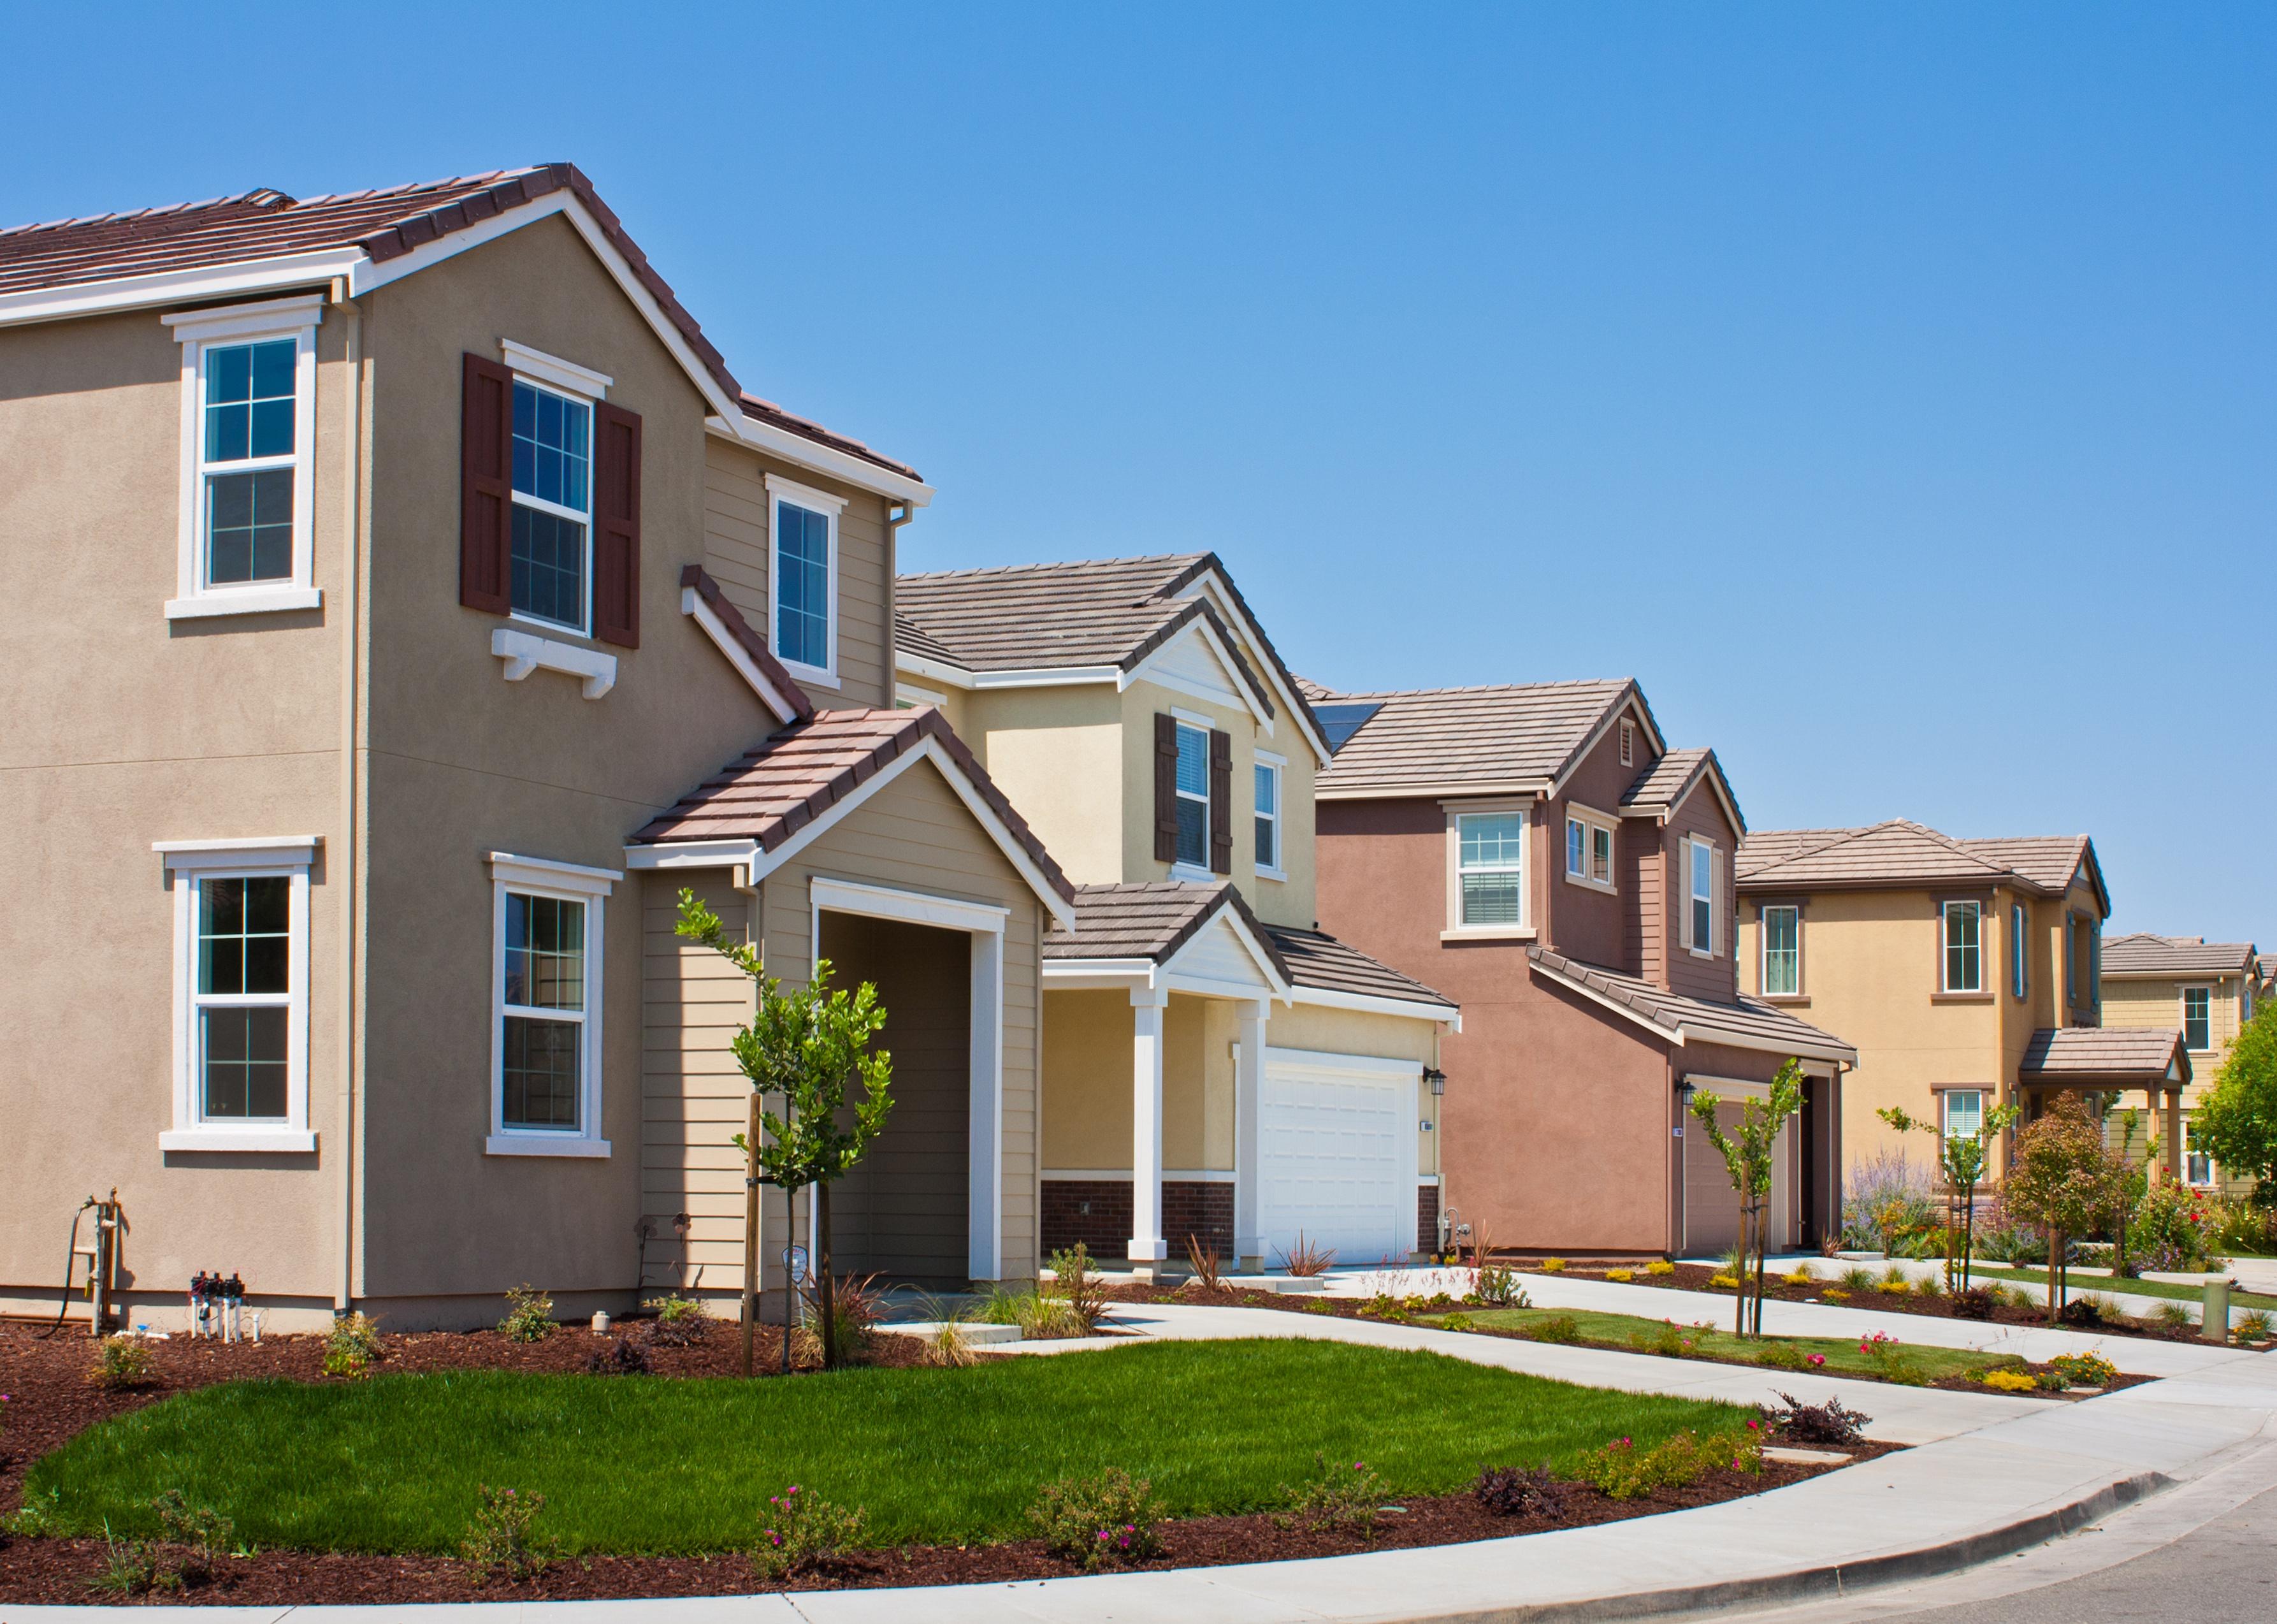
pbk-pg // Shutterstock
#44. Barron Park, California
A row of new tract houses in a residential subdivision
– Population: 2,967
– Median household income: $202,703
– Median home value: $1,991,754
– Median rent: $2,665
– Percent of people who own a home: 65%
– Area feel: Urban suburban mix
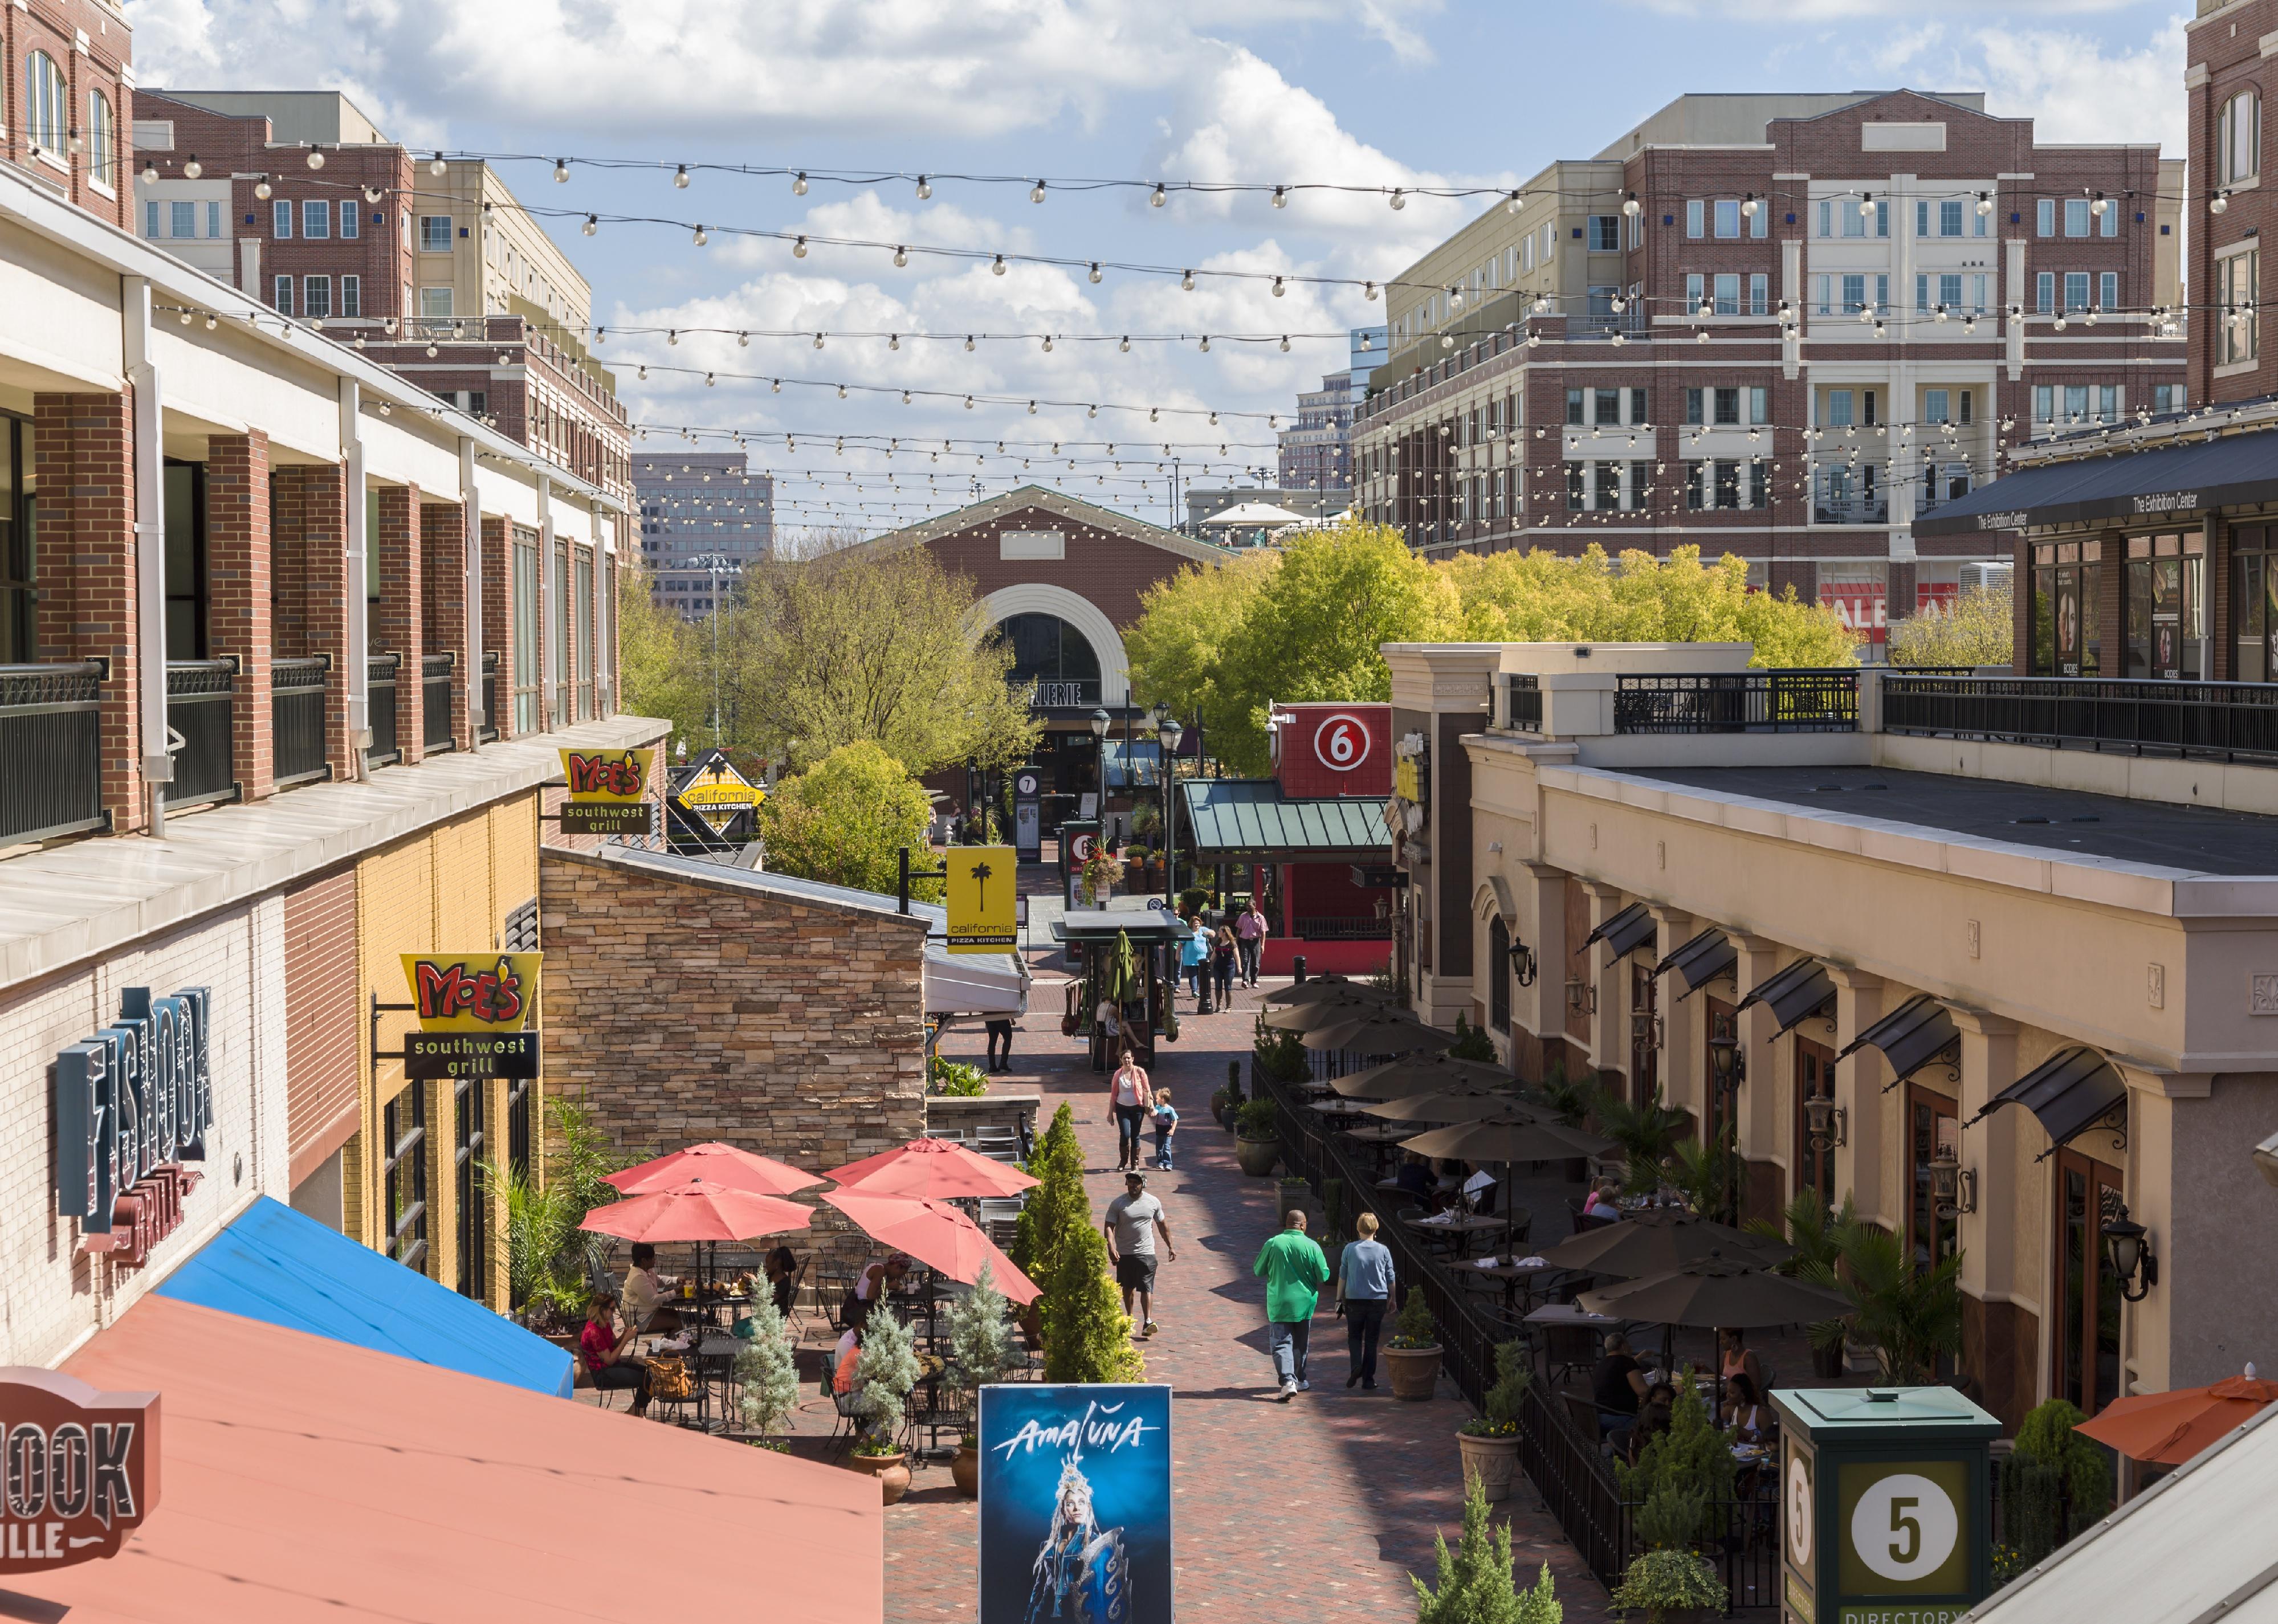
JSvideos // Shutterstock
#43. Atlantic Station, Georgia
Unidentified people visit shopping mall at Atlantic Station
– Population: 2,378
– Median household income: $68,485
– Median home value: $209,826
– Median rent: $1,773
– Percent of people who own a home: 54%
– Area feel: Dense urban
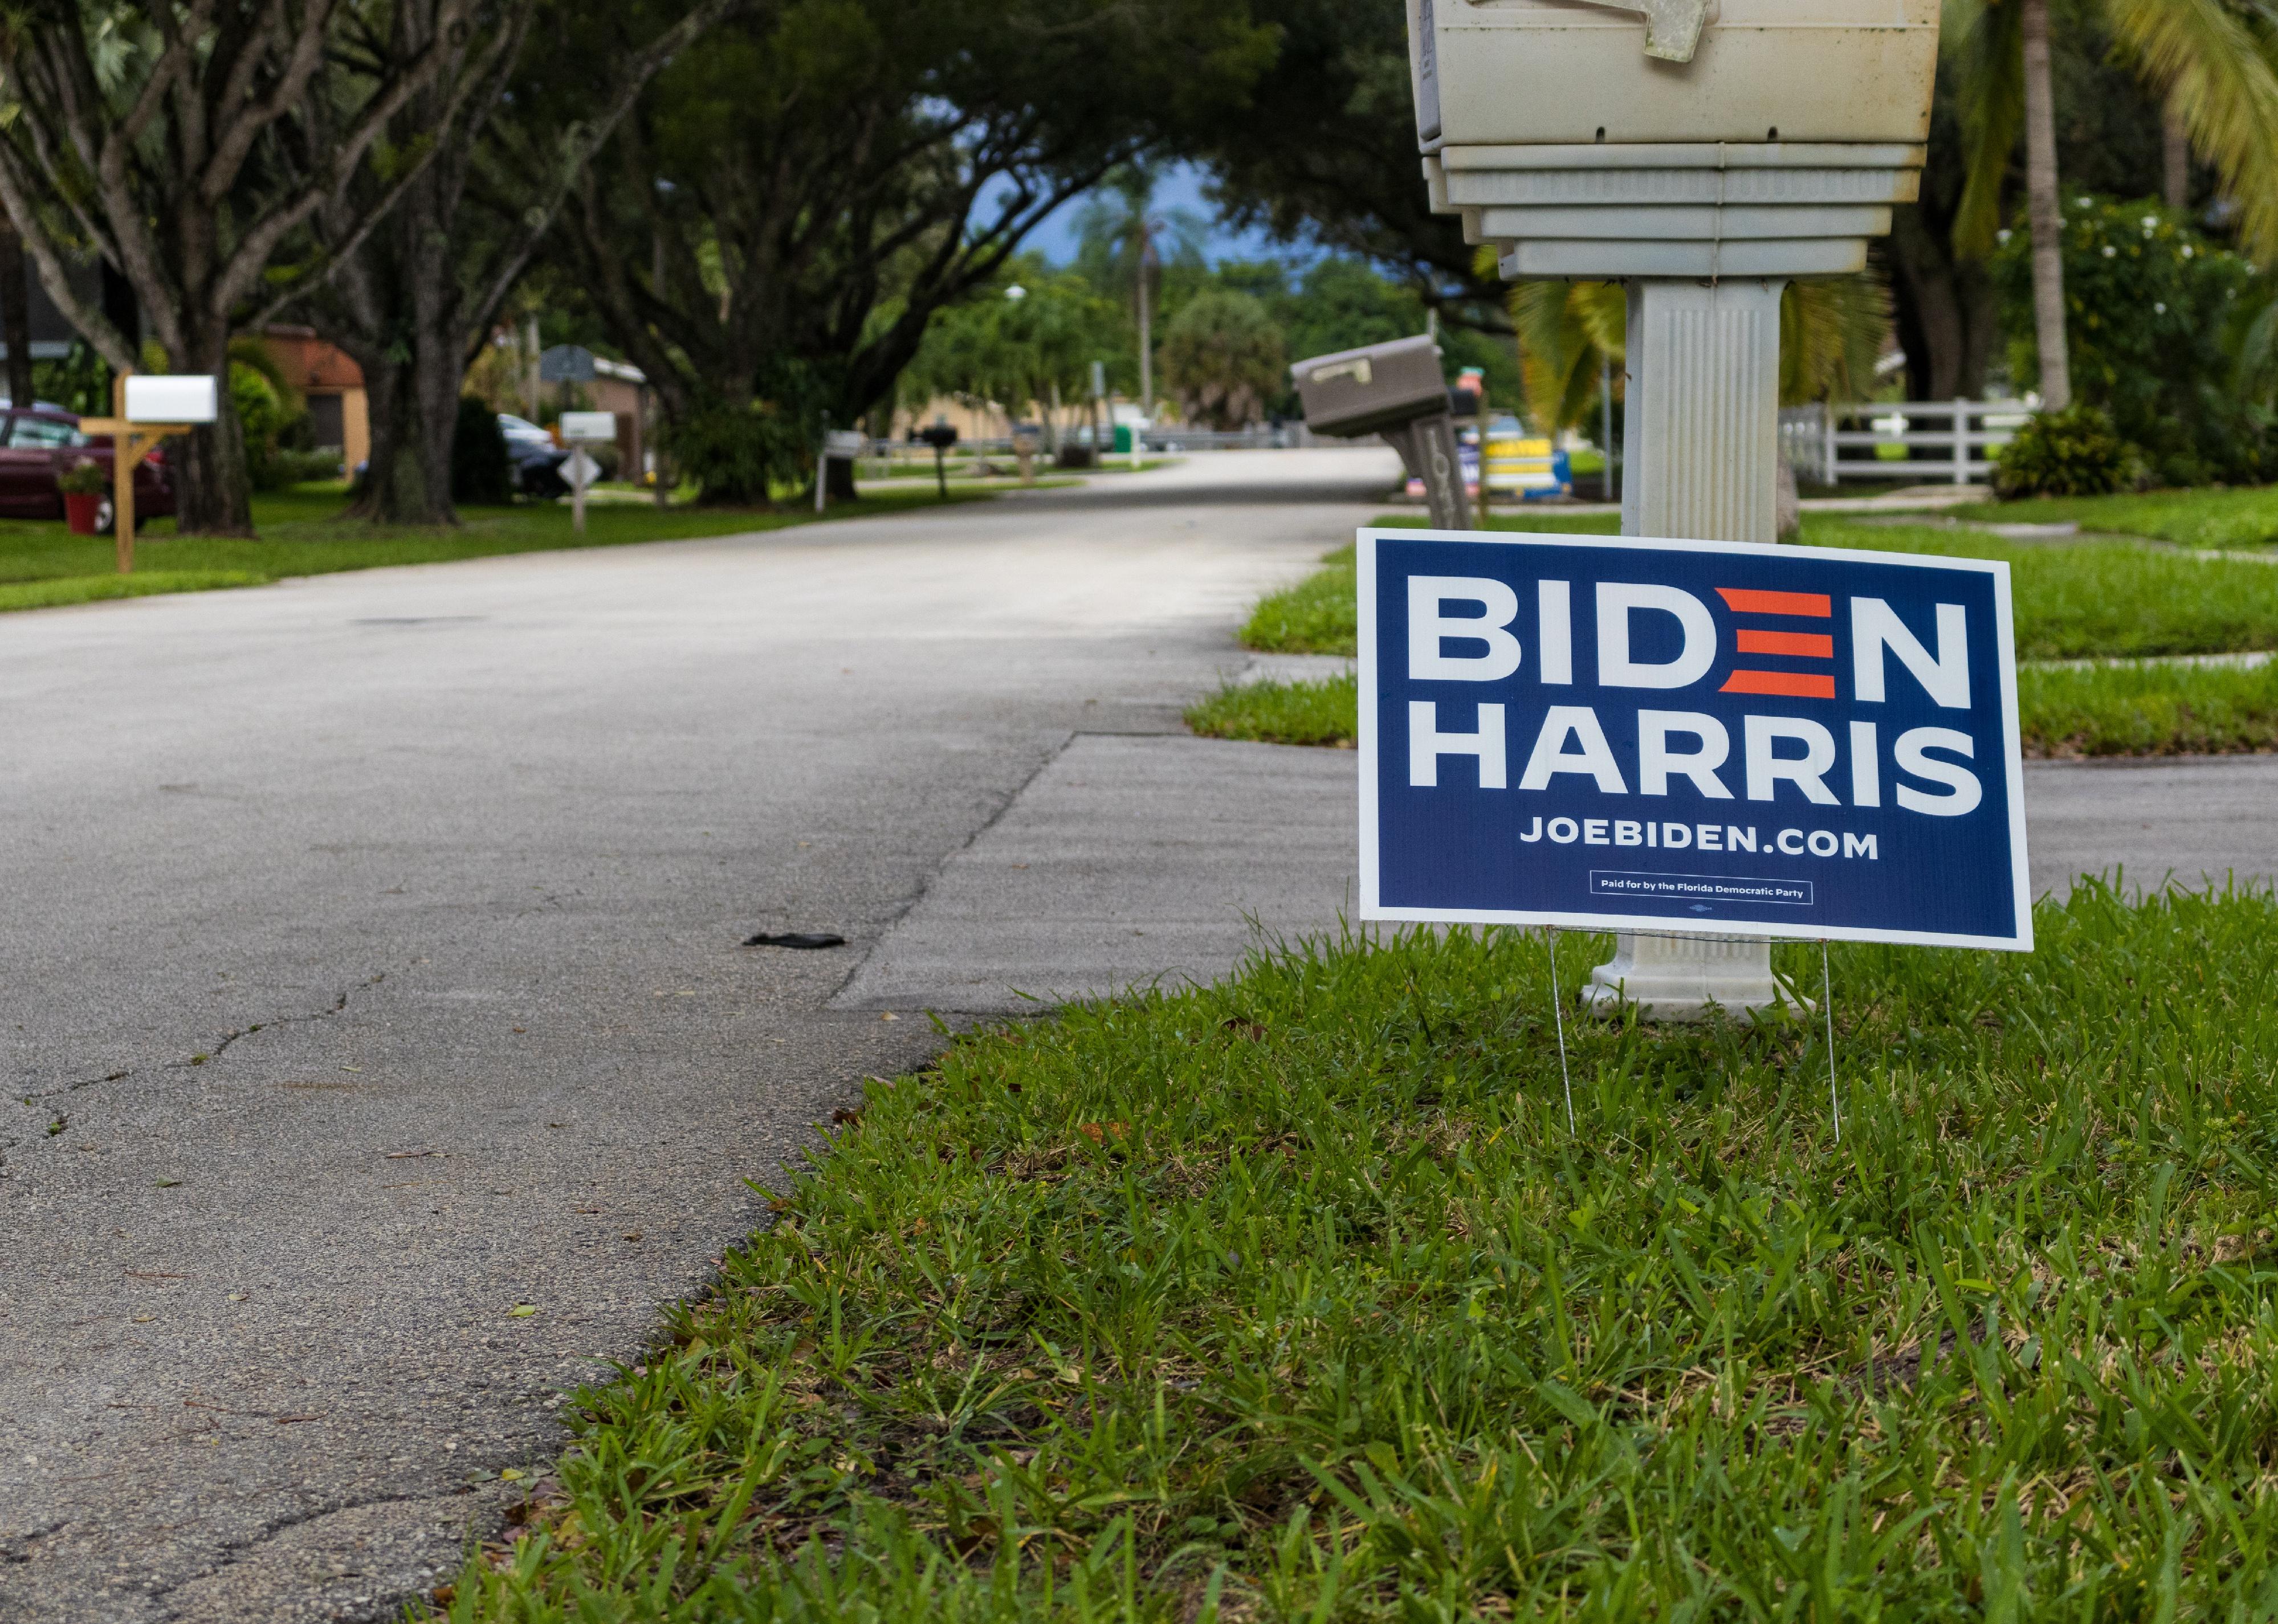
Kirk J. Englehardt // Shutterstock
#42. Thornton Park, Florida
Biden yard sign against a mailbox
– Population: 376
– Median household income: $102,969
– Median home value: $418,784
– Median rent: $1,160
– Percent of people who own a home: 63%
– Area feel: Urban suburban mix
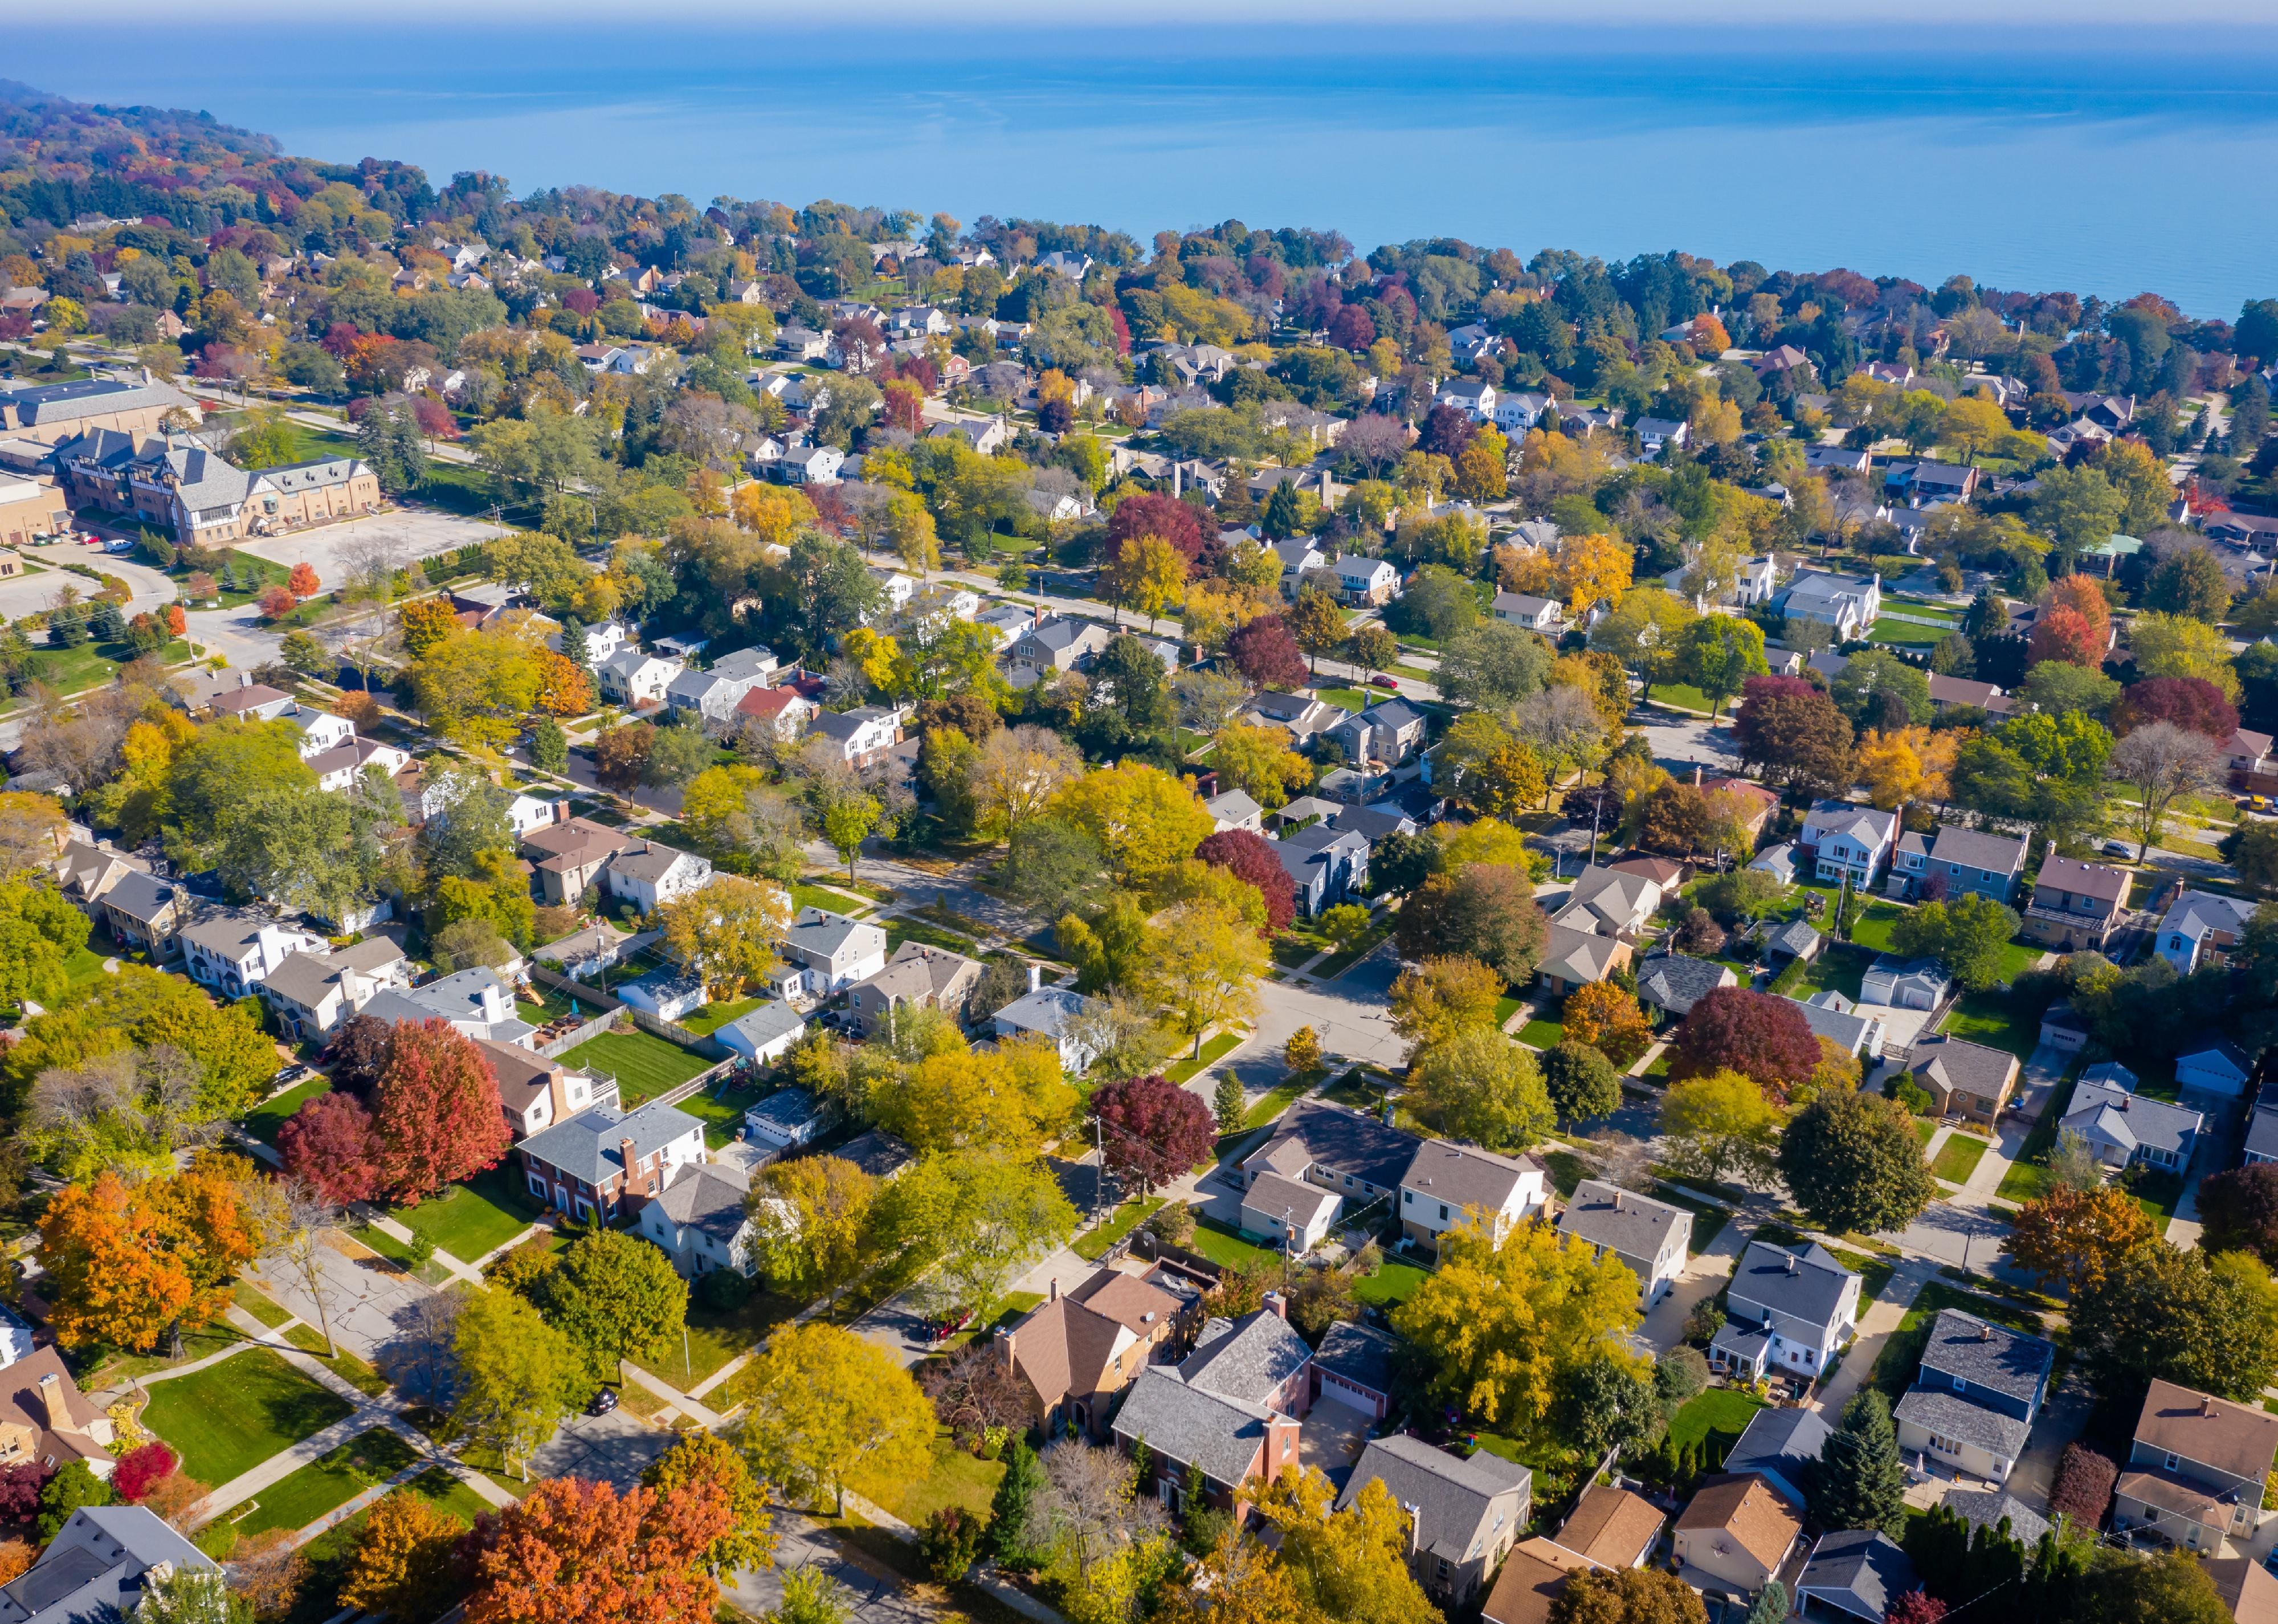
James Meyer // Shutterstock
#41. Whitefish Bay, Wisconsin
Aerial view of suburban Whitefish Bay, Wisconsin
– Population: 13,890
– Median household income: $129,331
– Median home value: $393,300
– Median rent: $1,199
– Percent of people who own a home: 80%
– Area feel: Sparse suburban
You may also like: Here are the best places to live on the East Coast, from New England to the Florida Keys
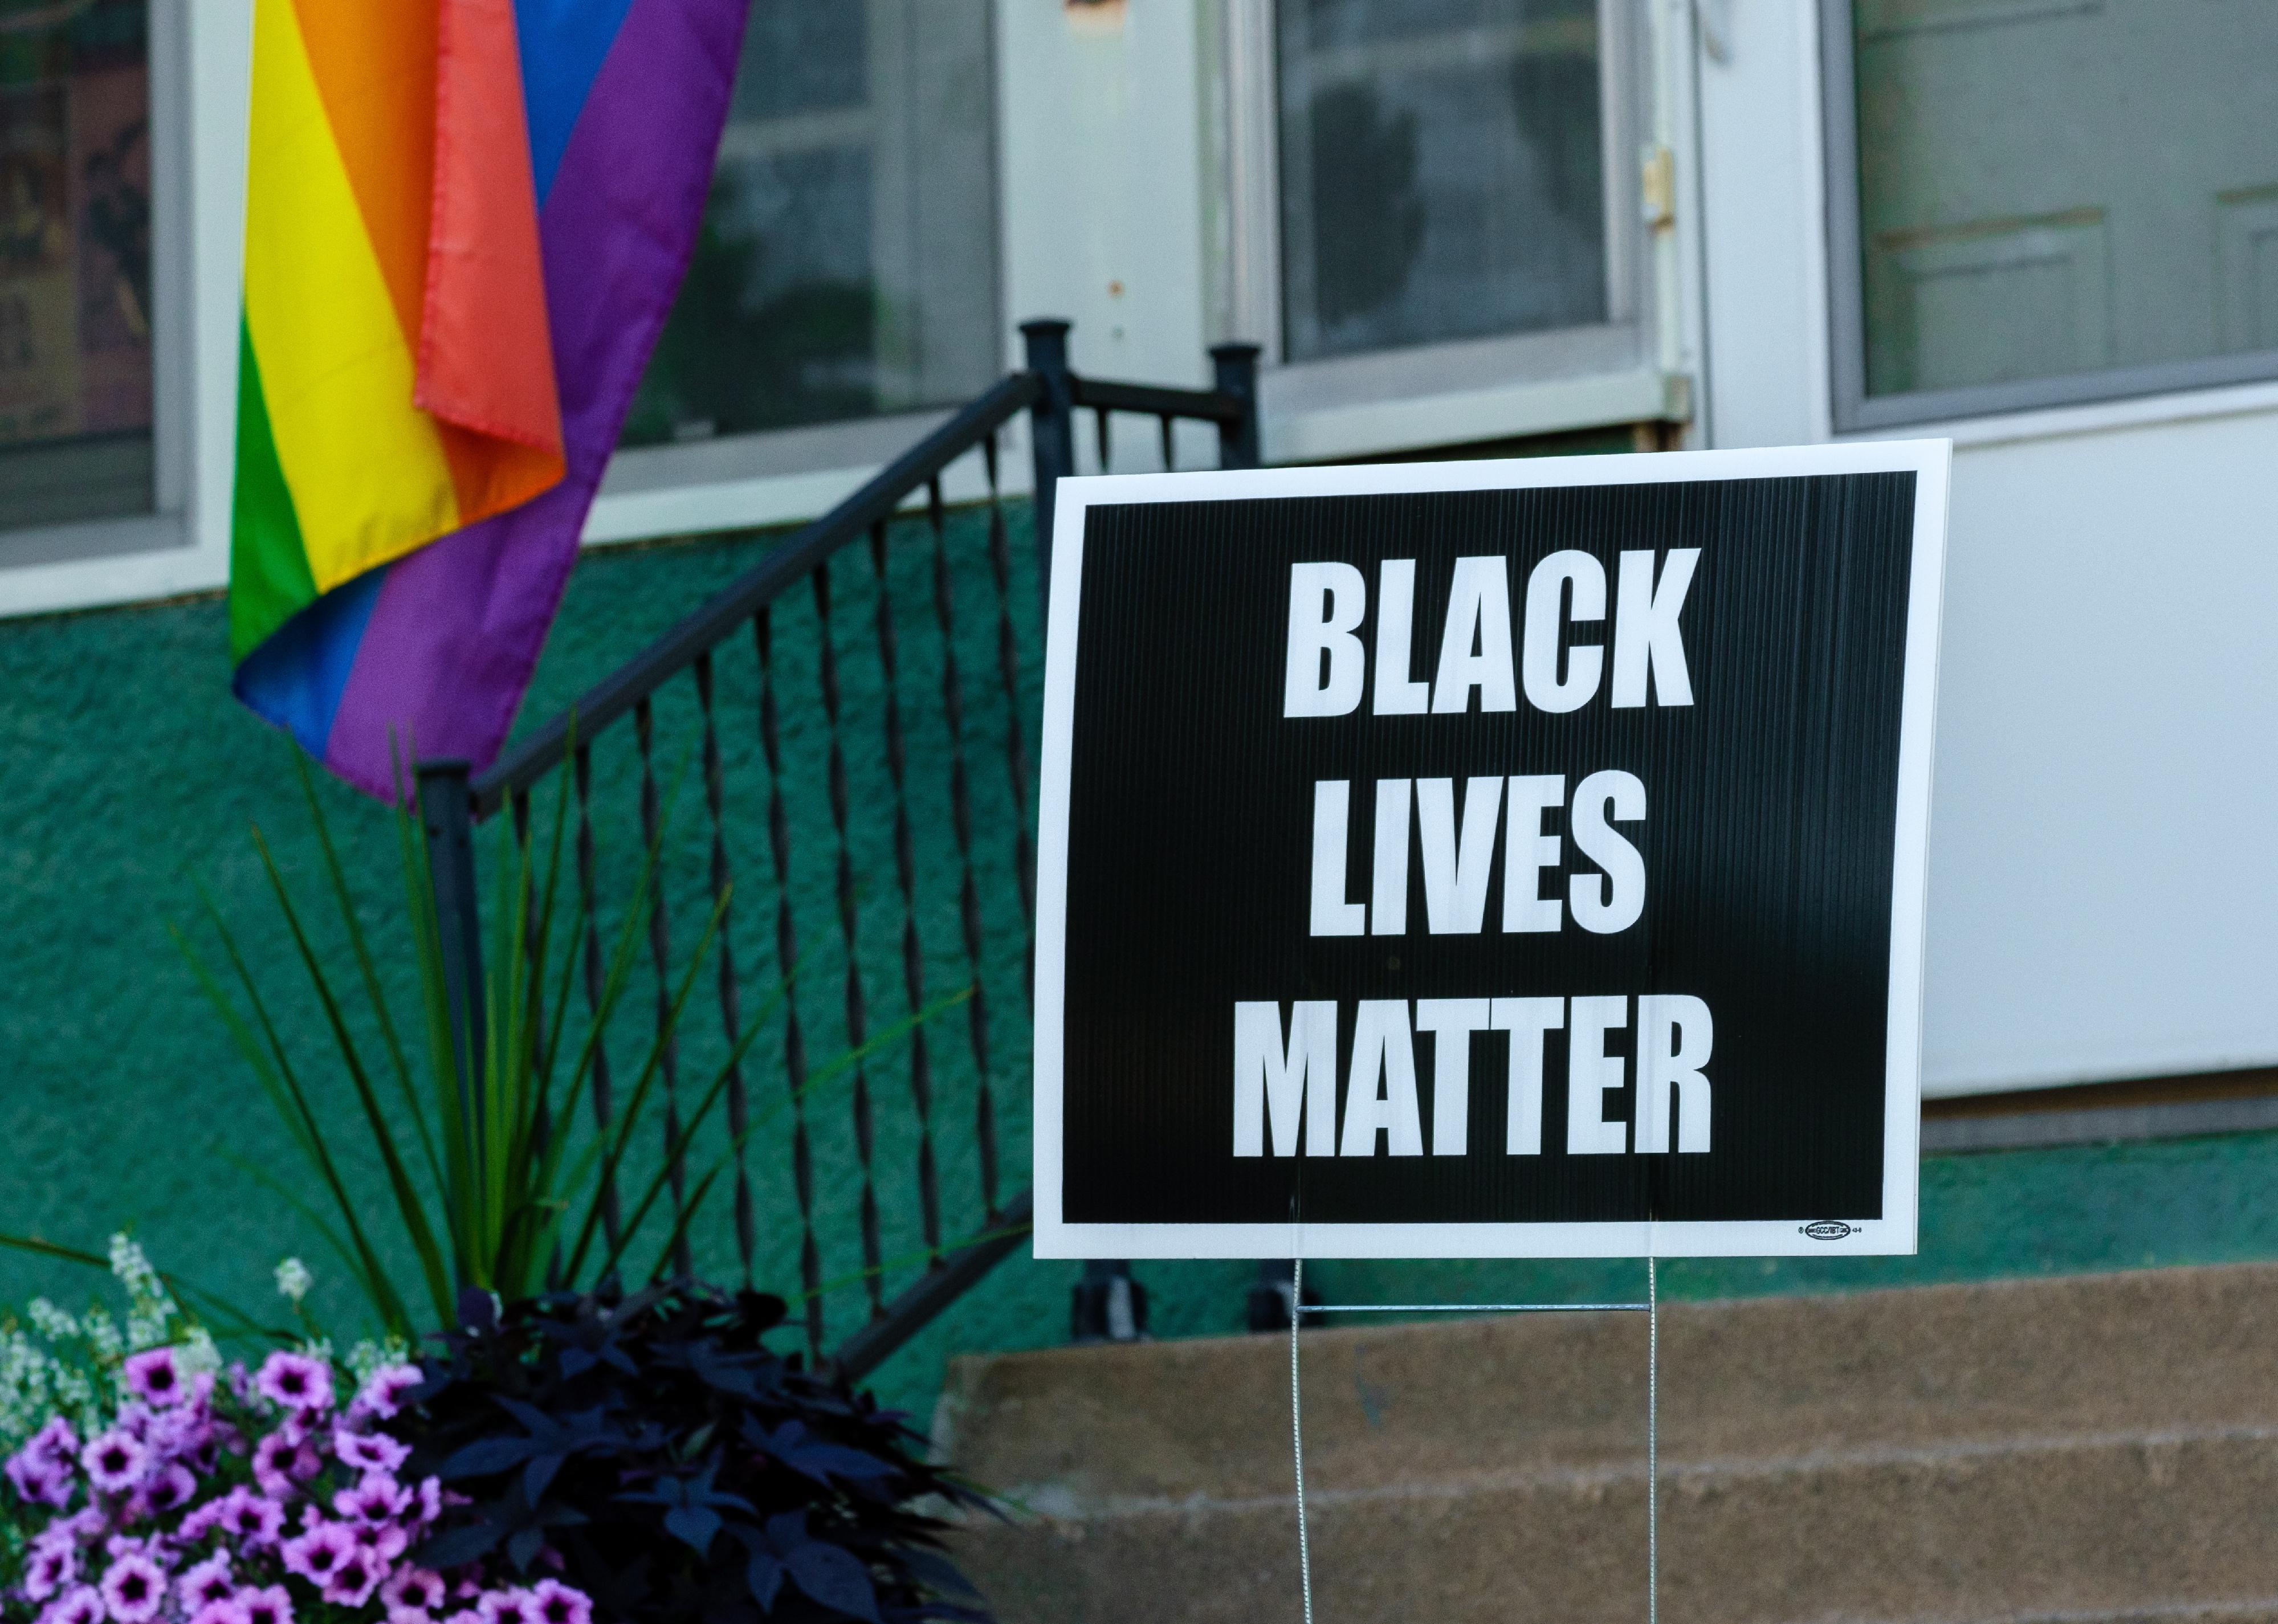
dkdkdkdk // Shutterstock
#40. Professorville, California
Black Lives Matter sign in a residential neighborhood
– Population: 813
– Median household income: $245,749
– Median home value: $1,996,580
– Median rent: $3,424
– Percent of people who own a home: 59%
– Area feel: Sparse suburban
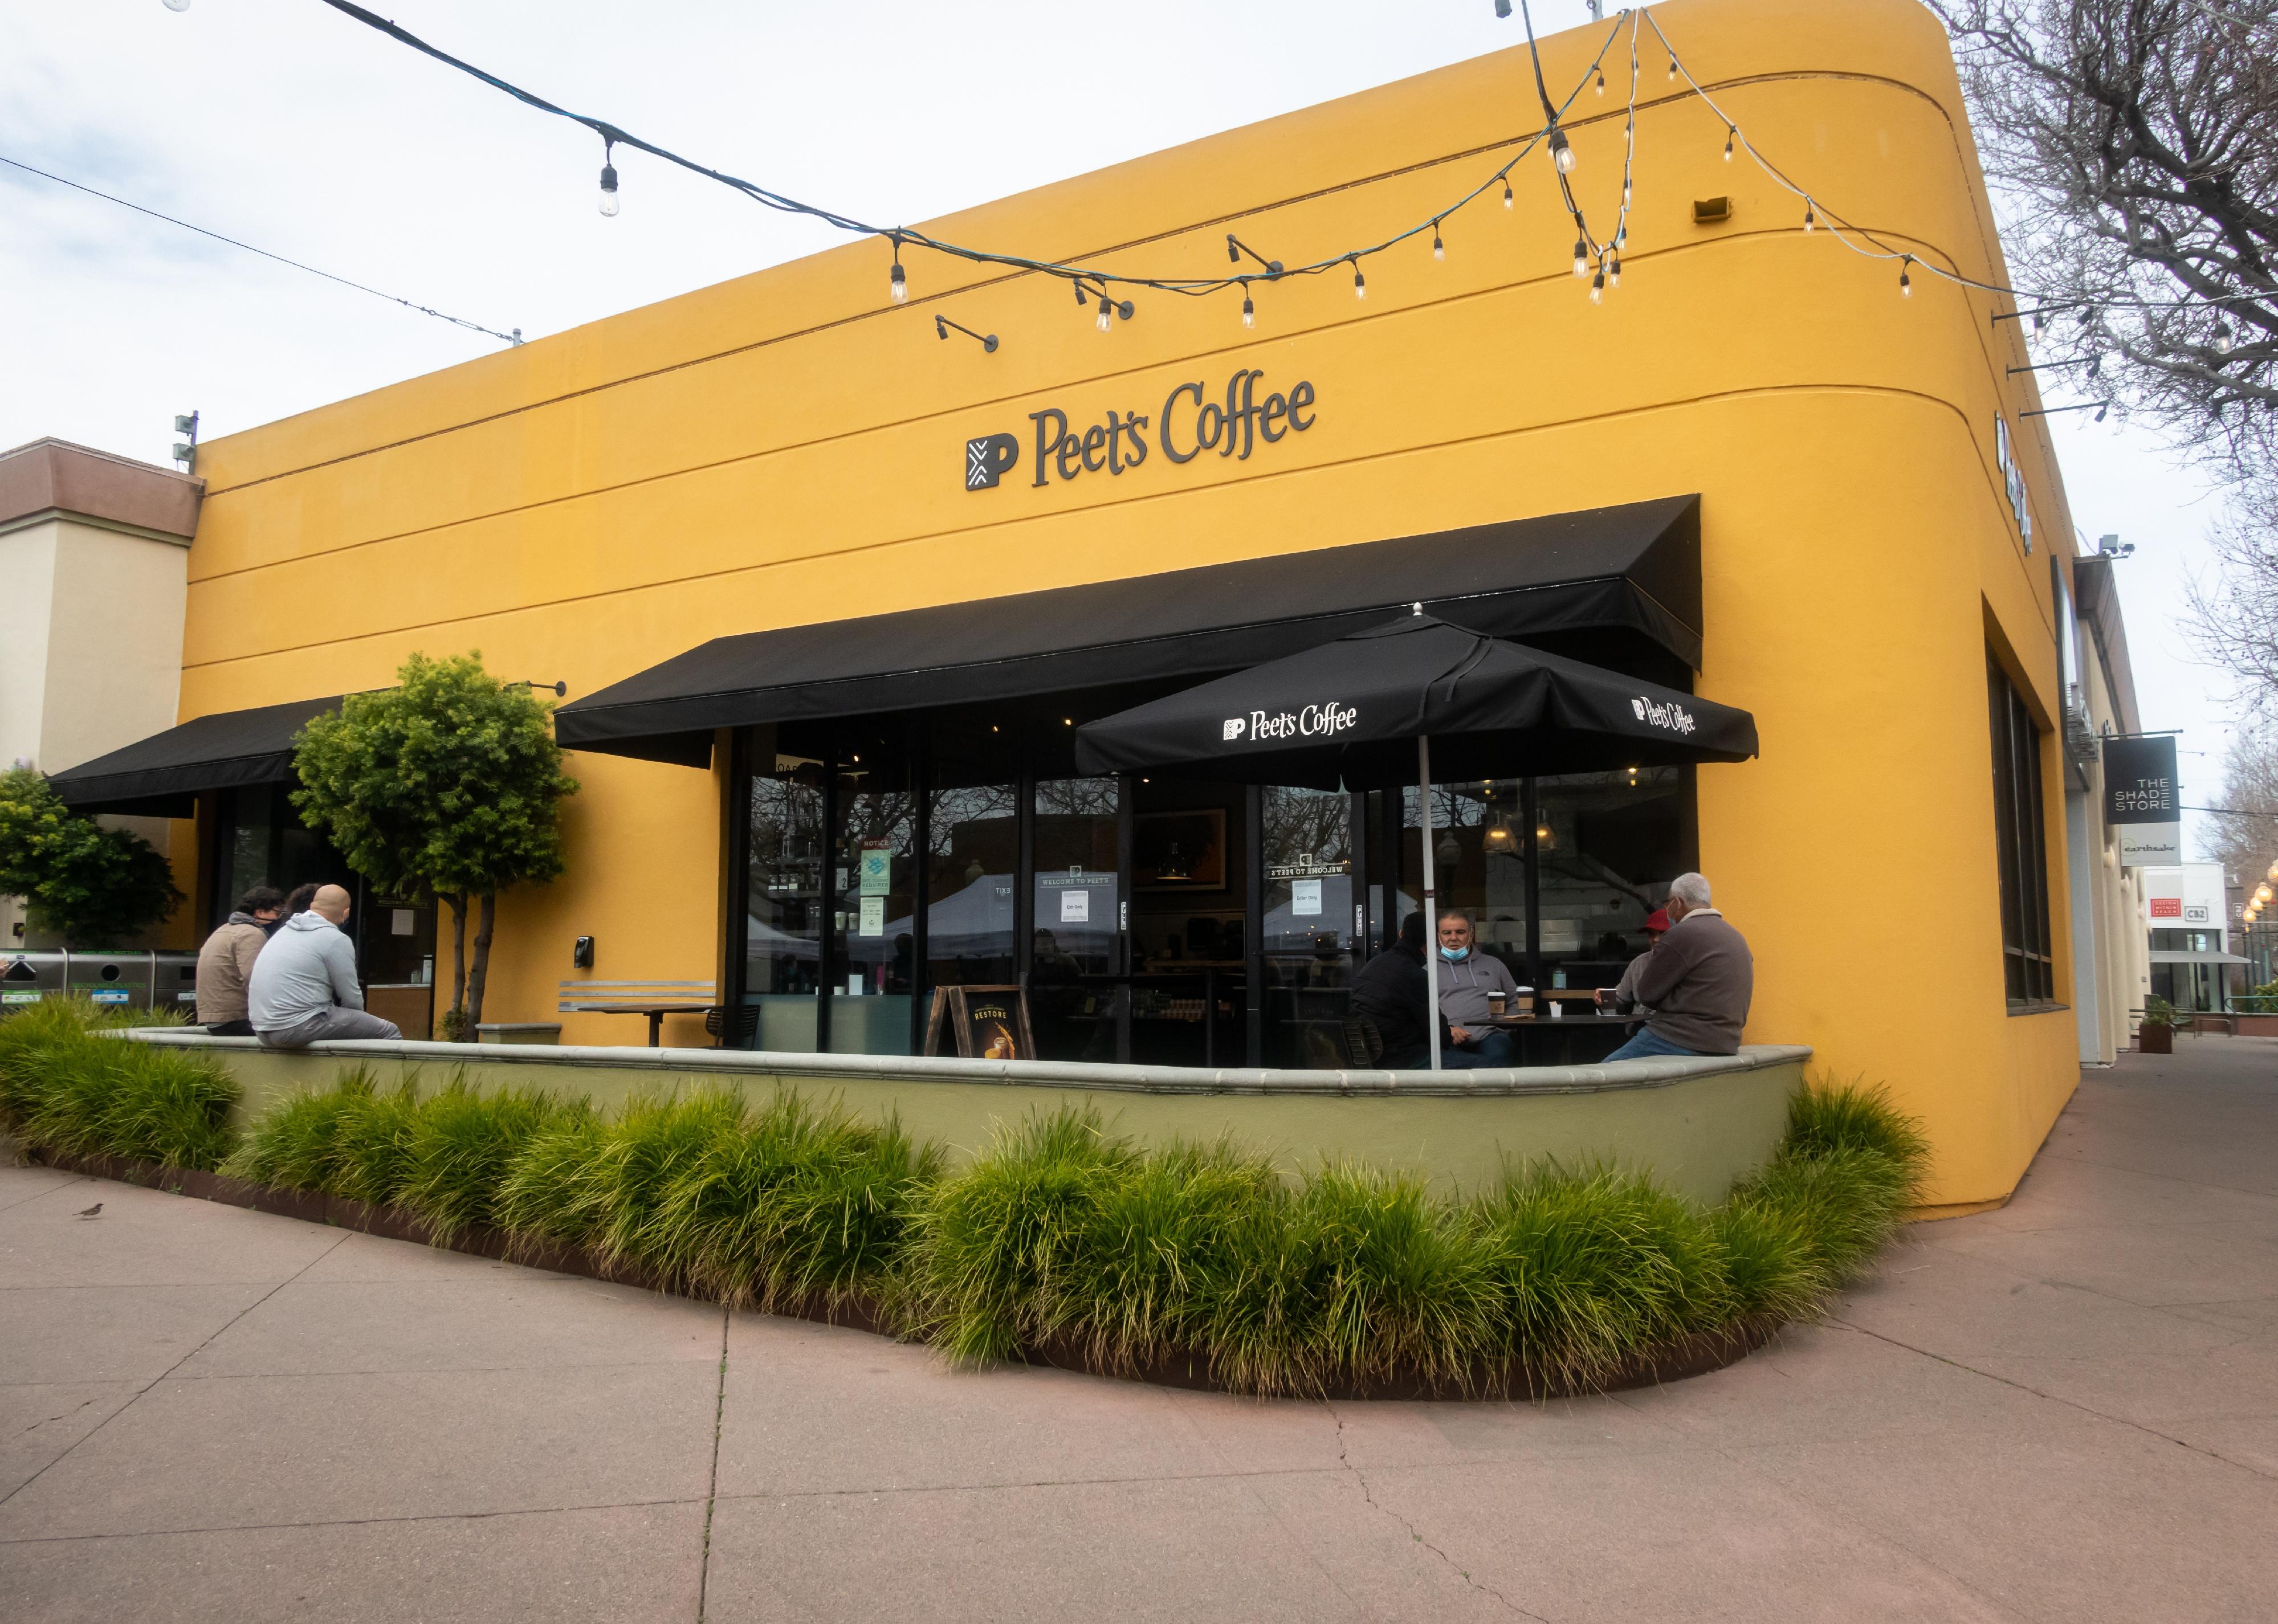
Chris Allan // Shutterstock
#39. North Berkeley, California
Photo of the brightly painted, yellow Peet’s Coffee
– Population: 7,624
– Median household income: $94,290
– Median home value: $1,110,325
– Median rent: $1,782
– Percent of people who own a home: 41%
– Area feel: Urban
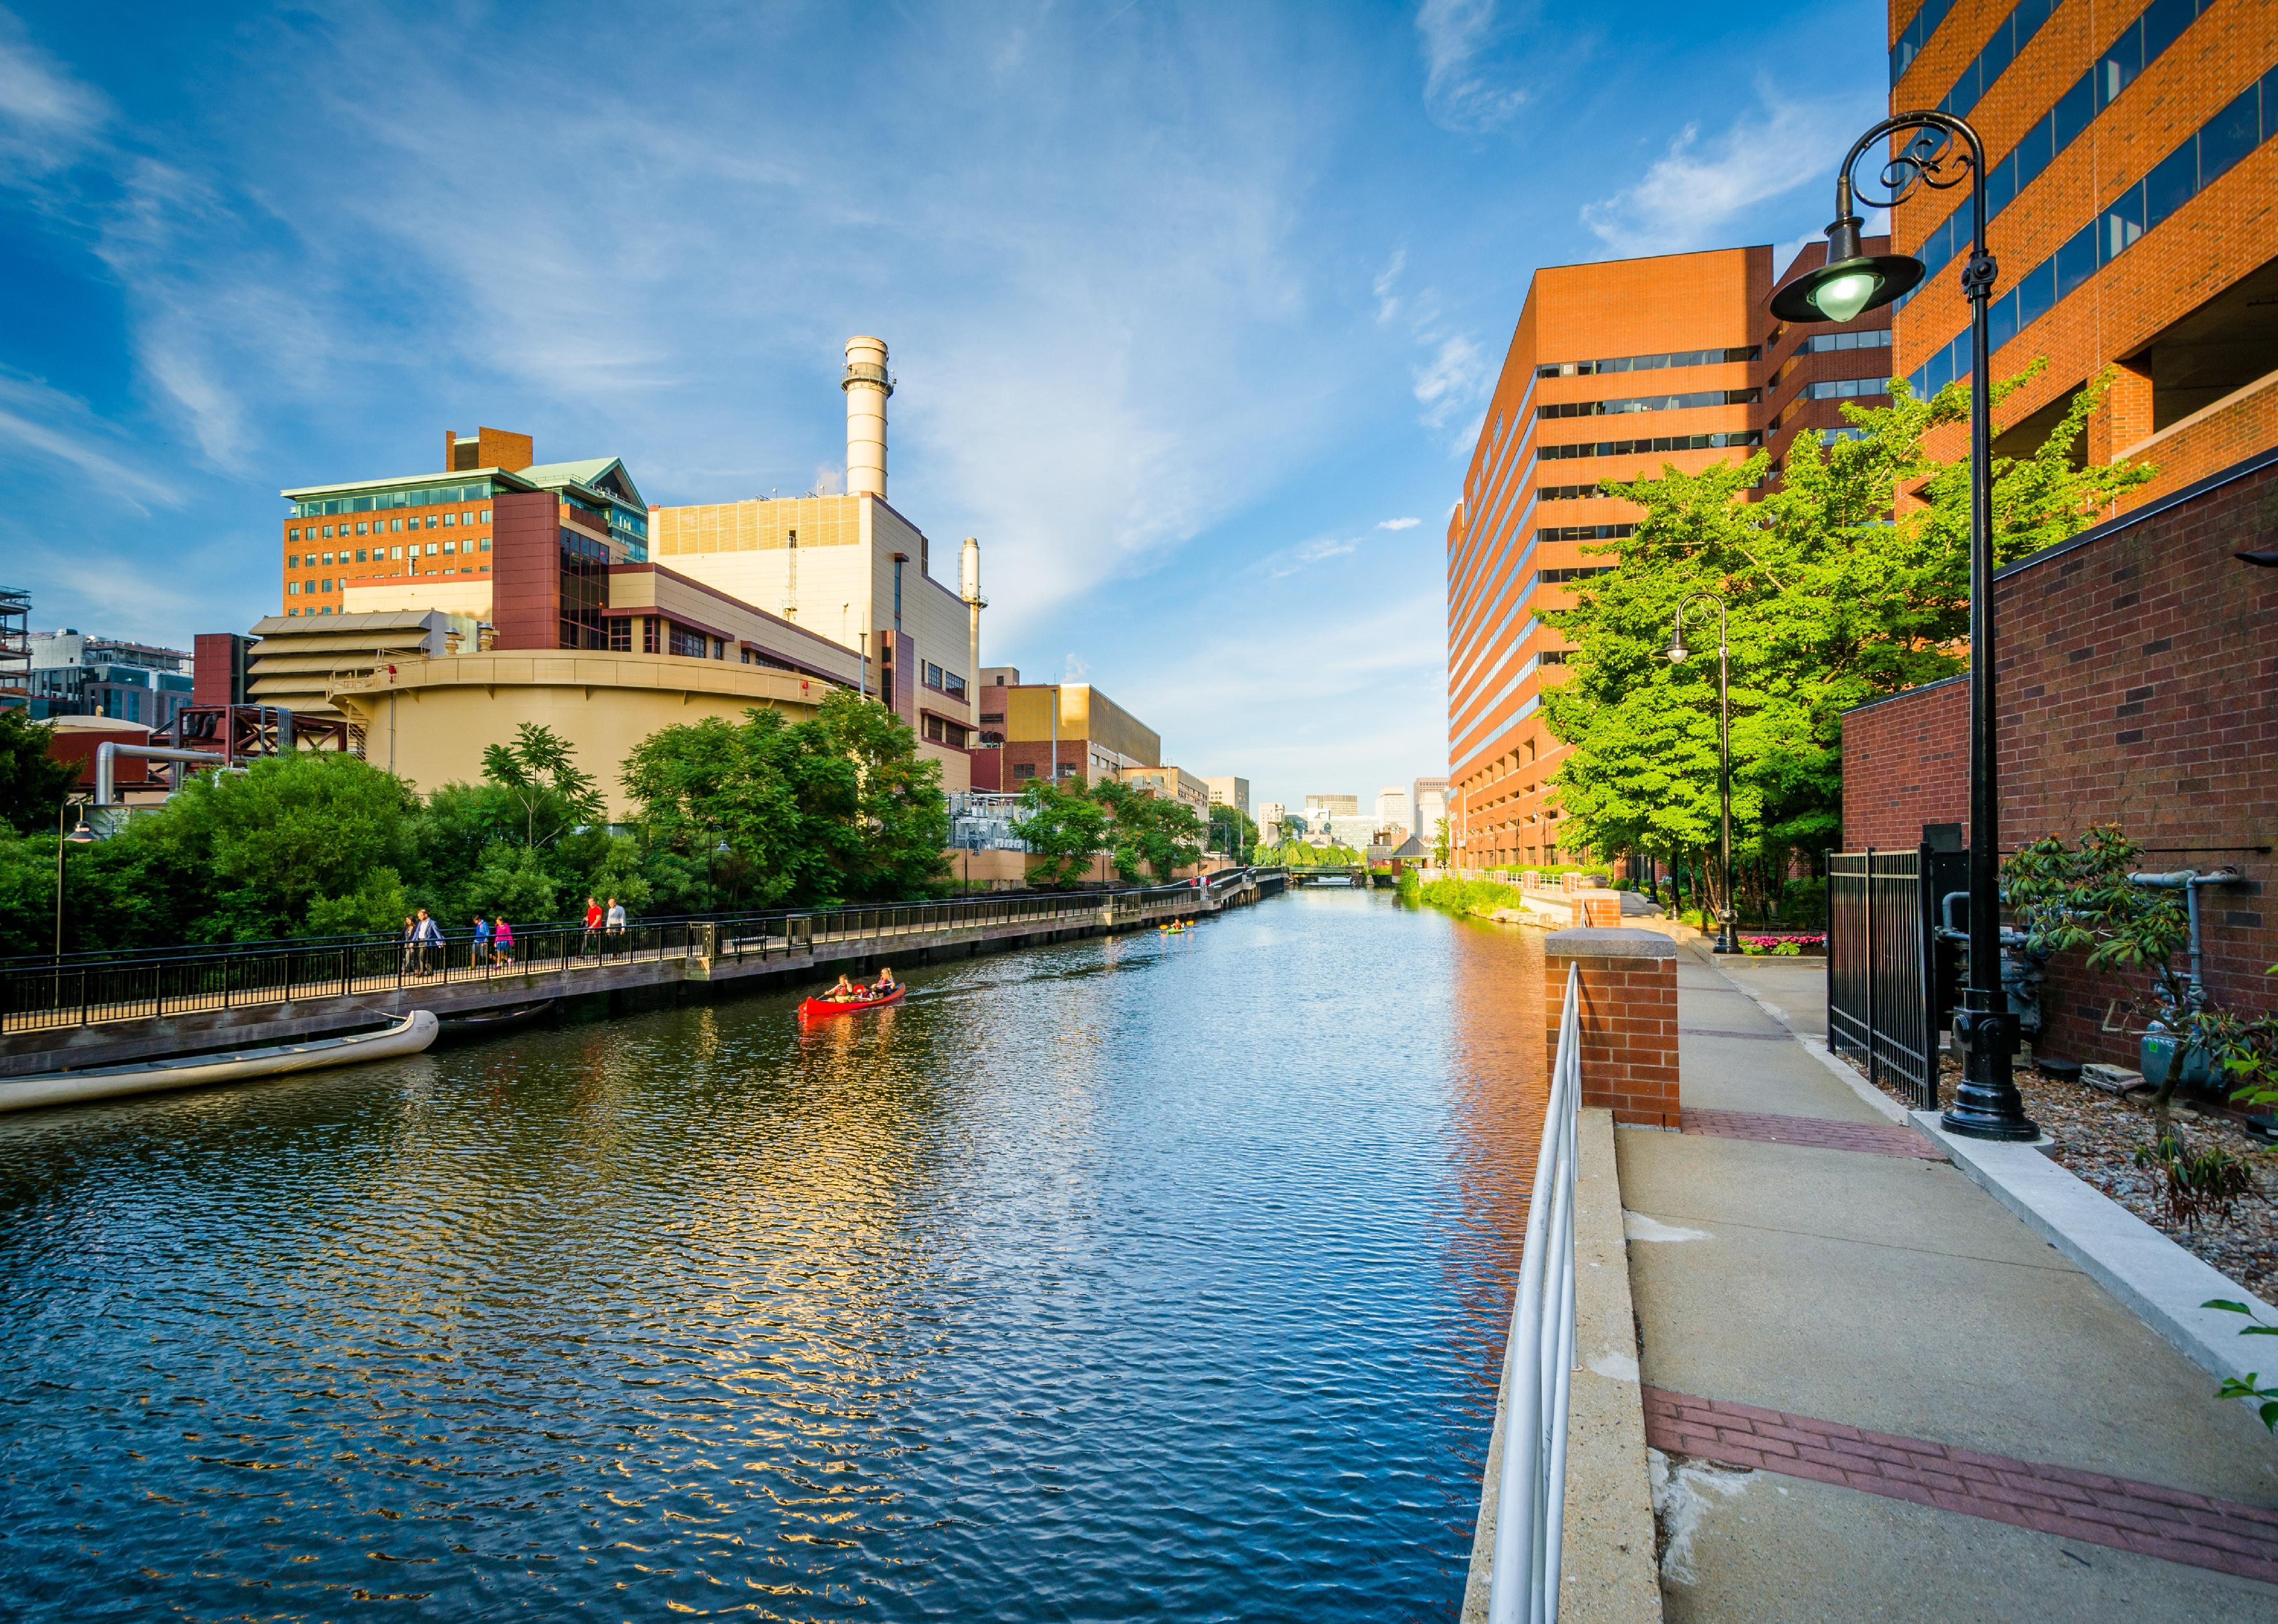
Jon Bilous // Shutterstock
#38. Cambridge, Massachusetts
The Broad Canal in Cambridge, Massachusetts
– Population: 117,822
– Median household income: $107,490
– Median home value: $843,100
– Median rent: $2,293
– Percent of people who own a home: 35%
– Area feel: Urban
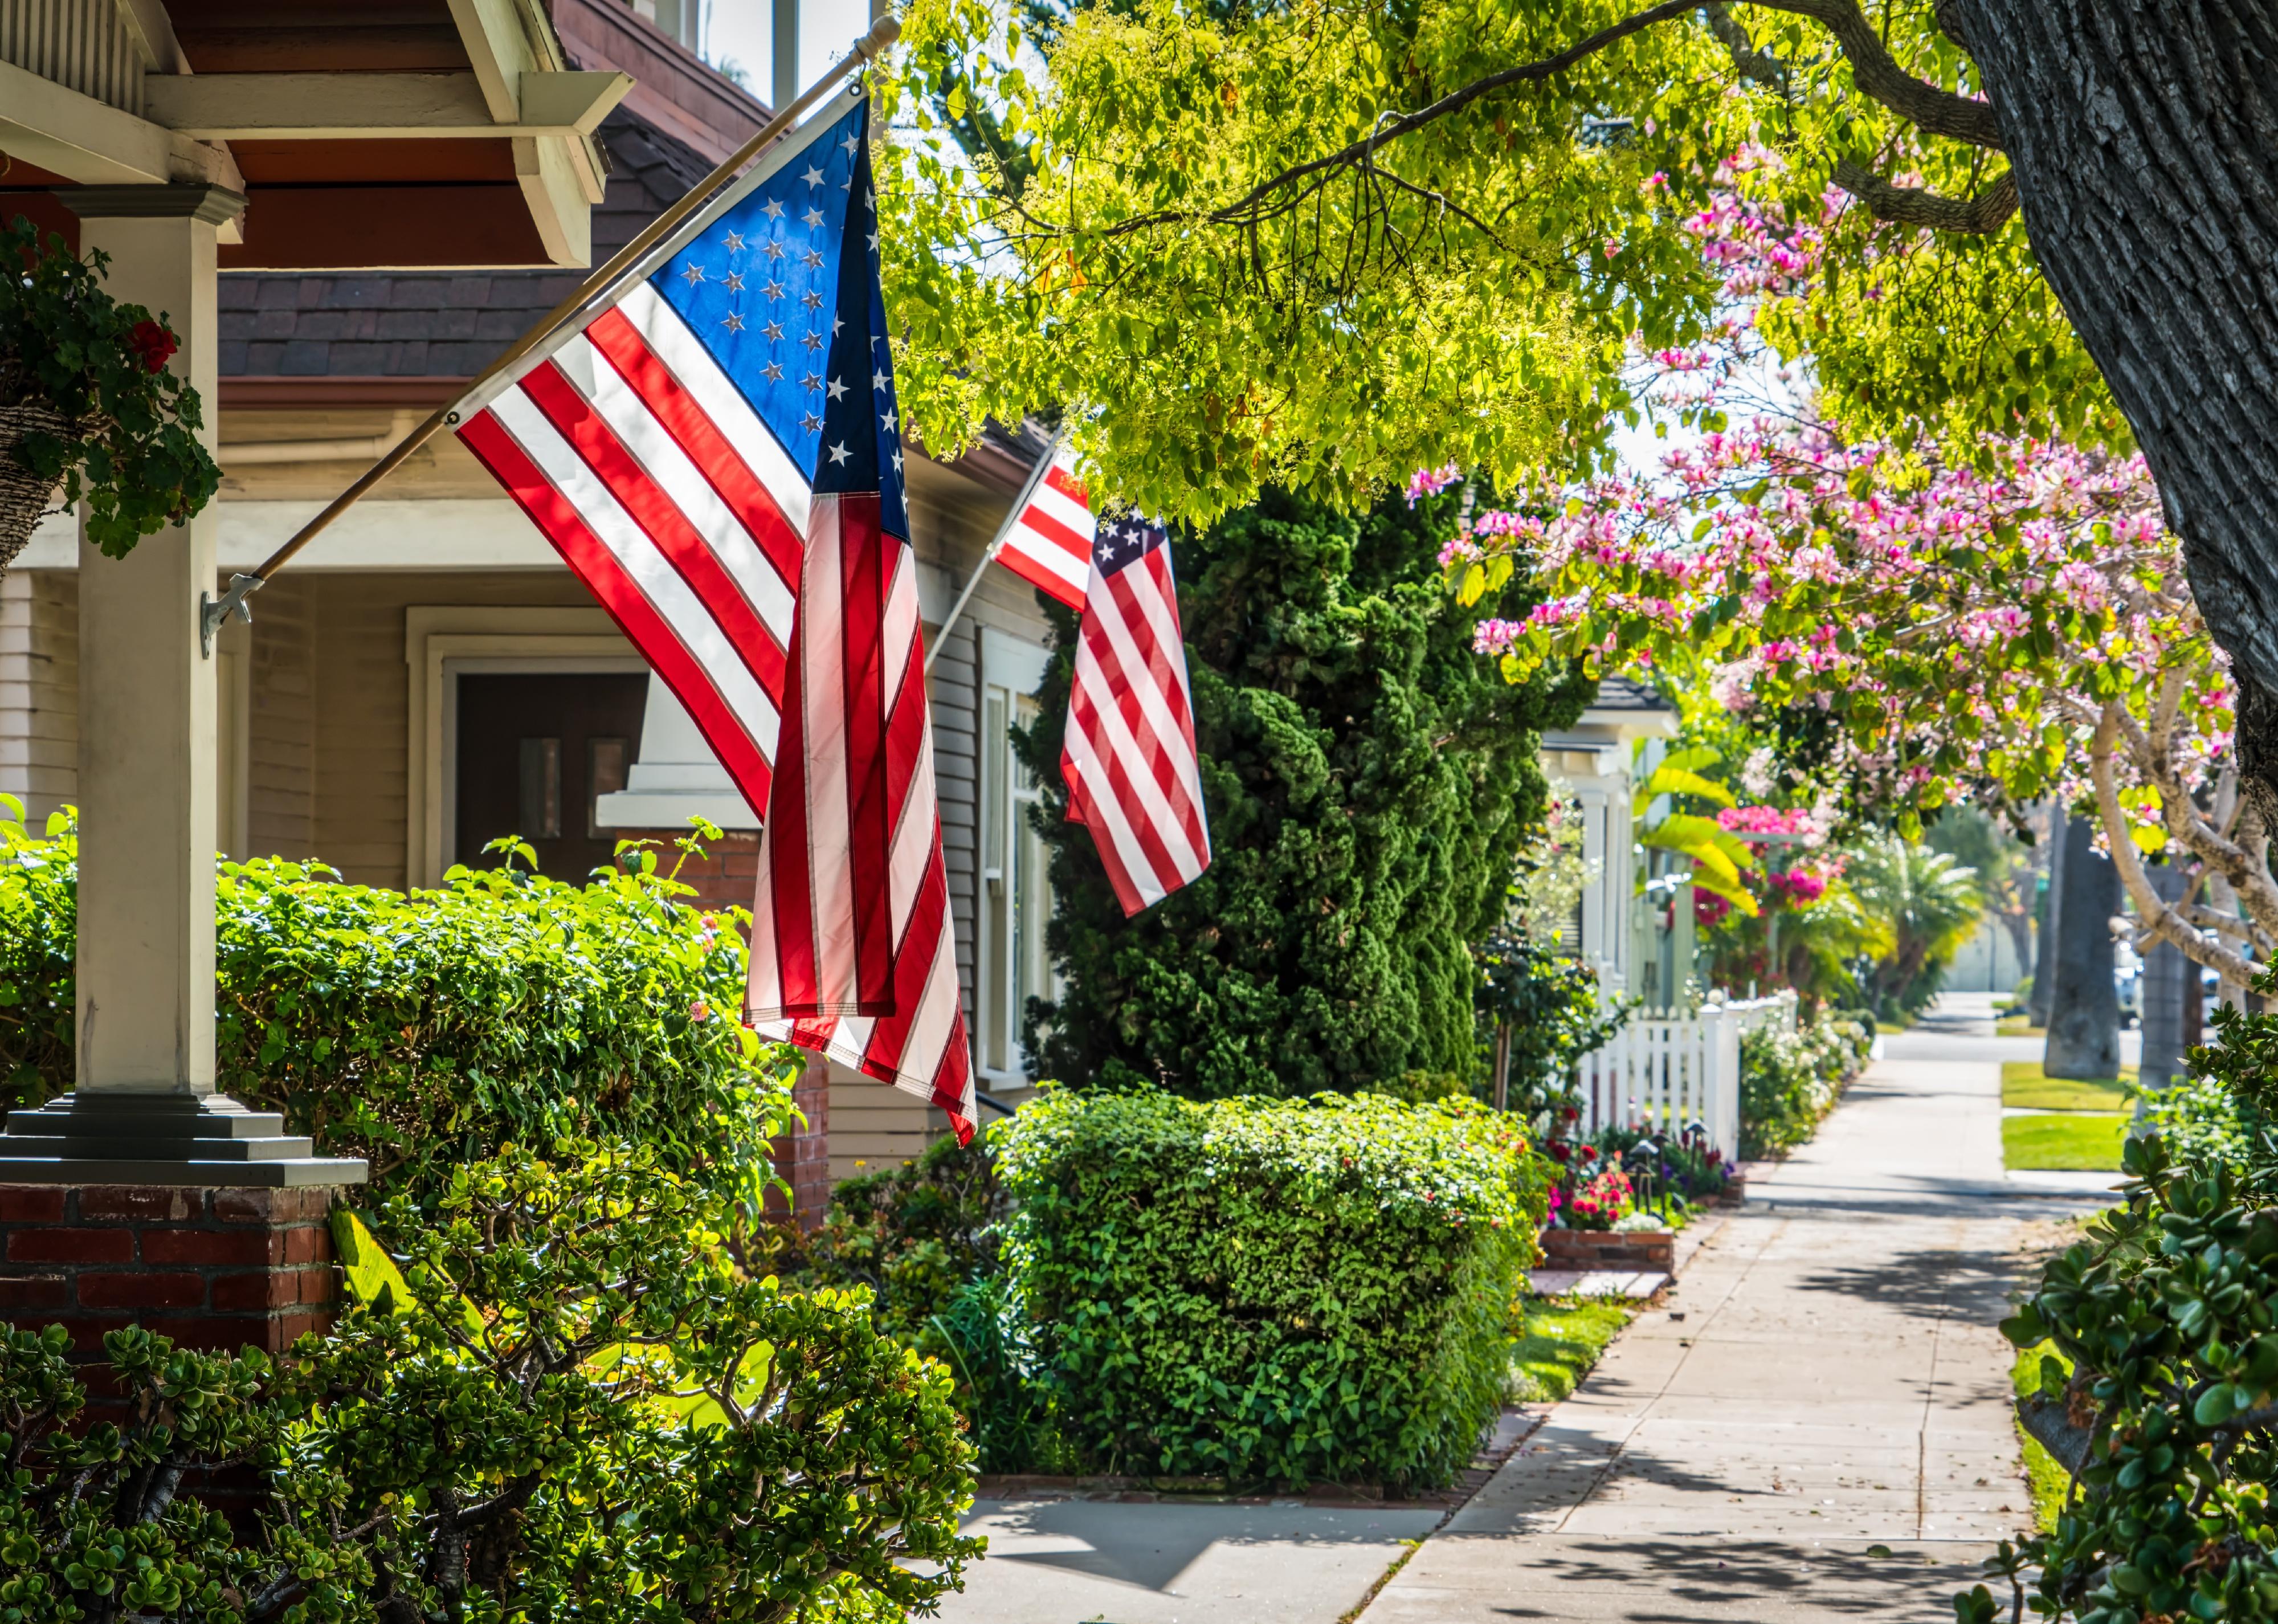
Bill Chizek // Shutterstock
#37. Midtown, California
Flags on a southern California street
– Population: 10,581
– Median household income: $189,244
– Median home value: $1,998,327
– Median rent: $3,004
– Percent of people who own a home: 63%
– Area feel: Urban suburban mix
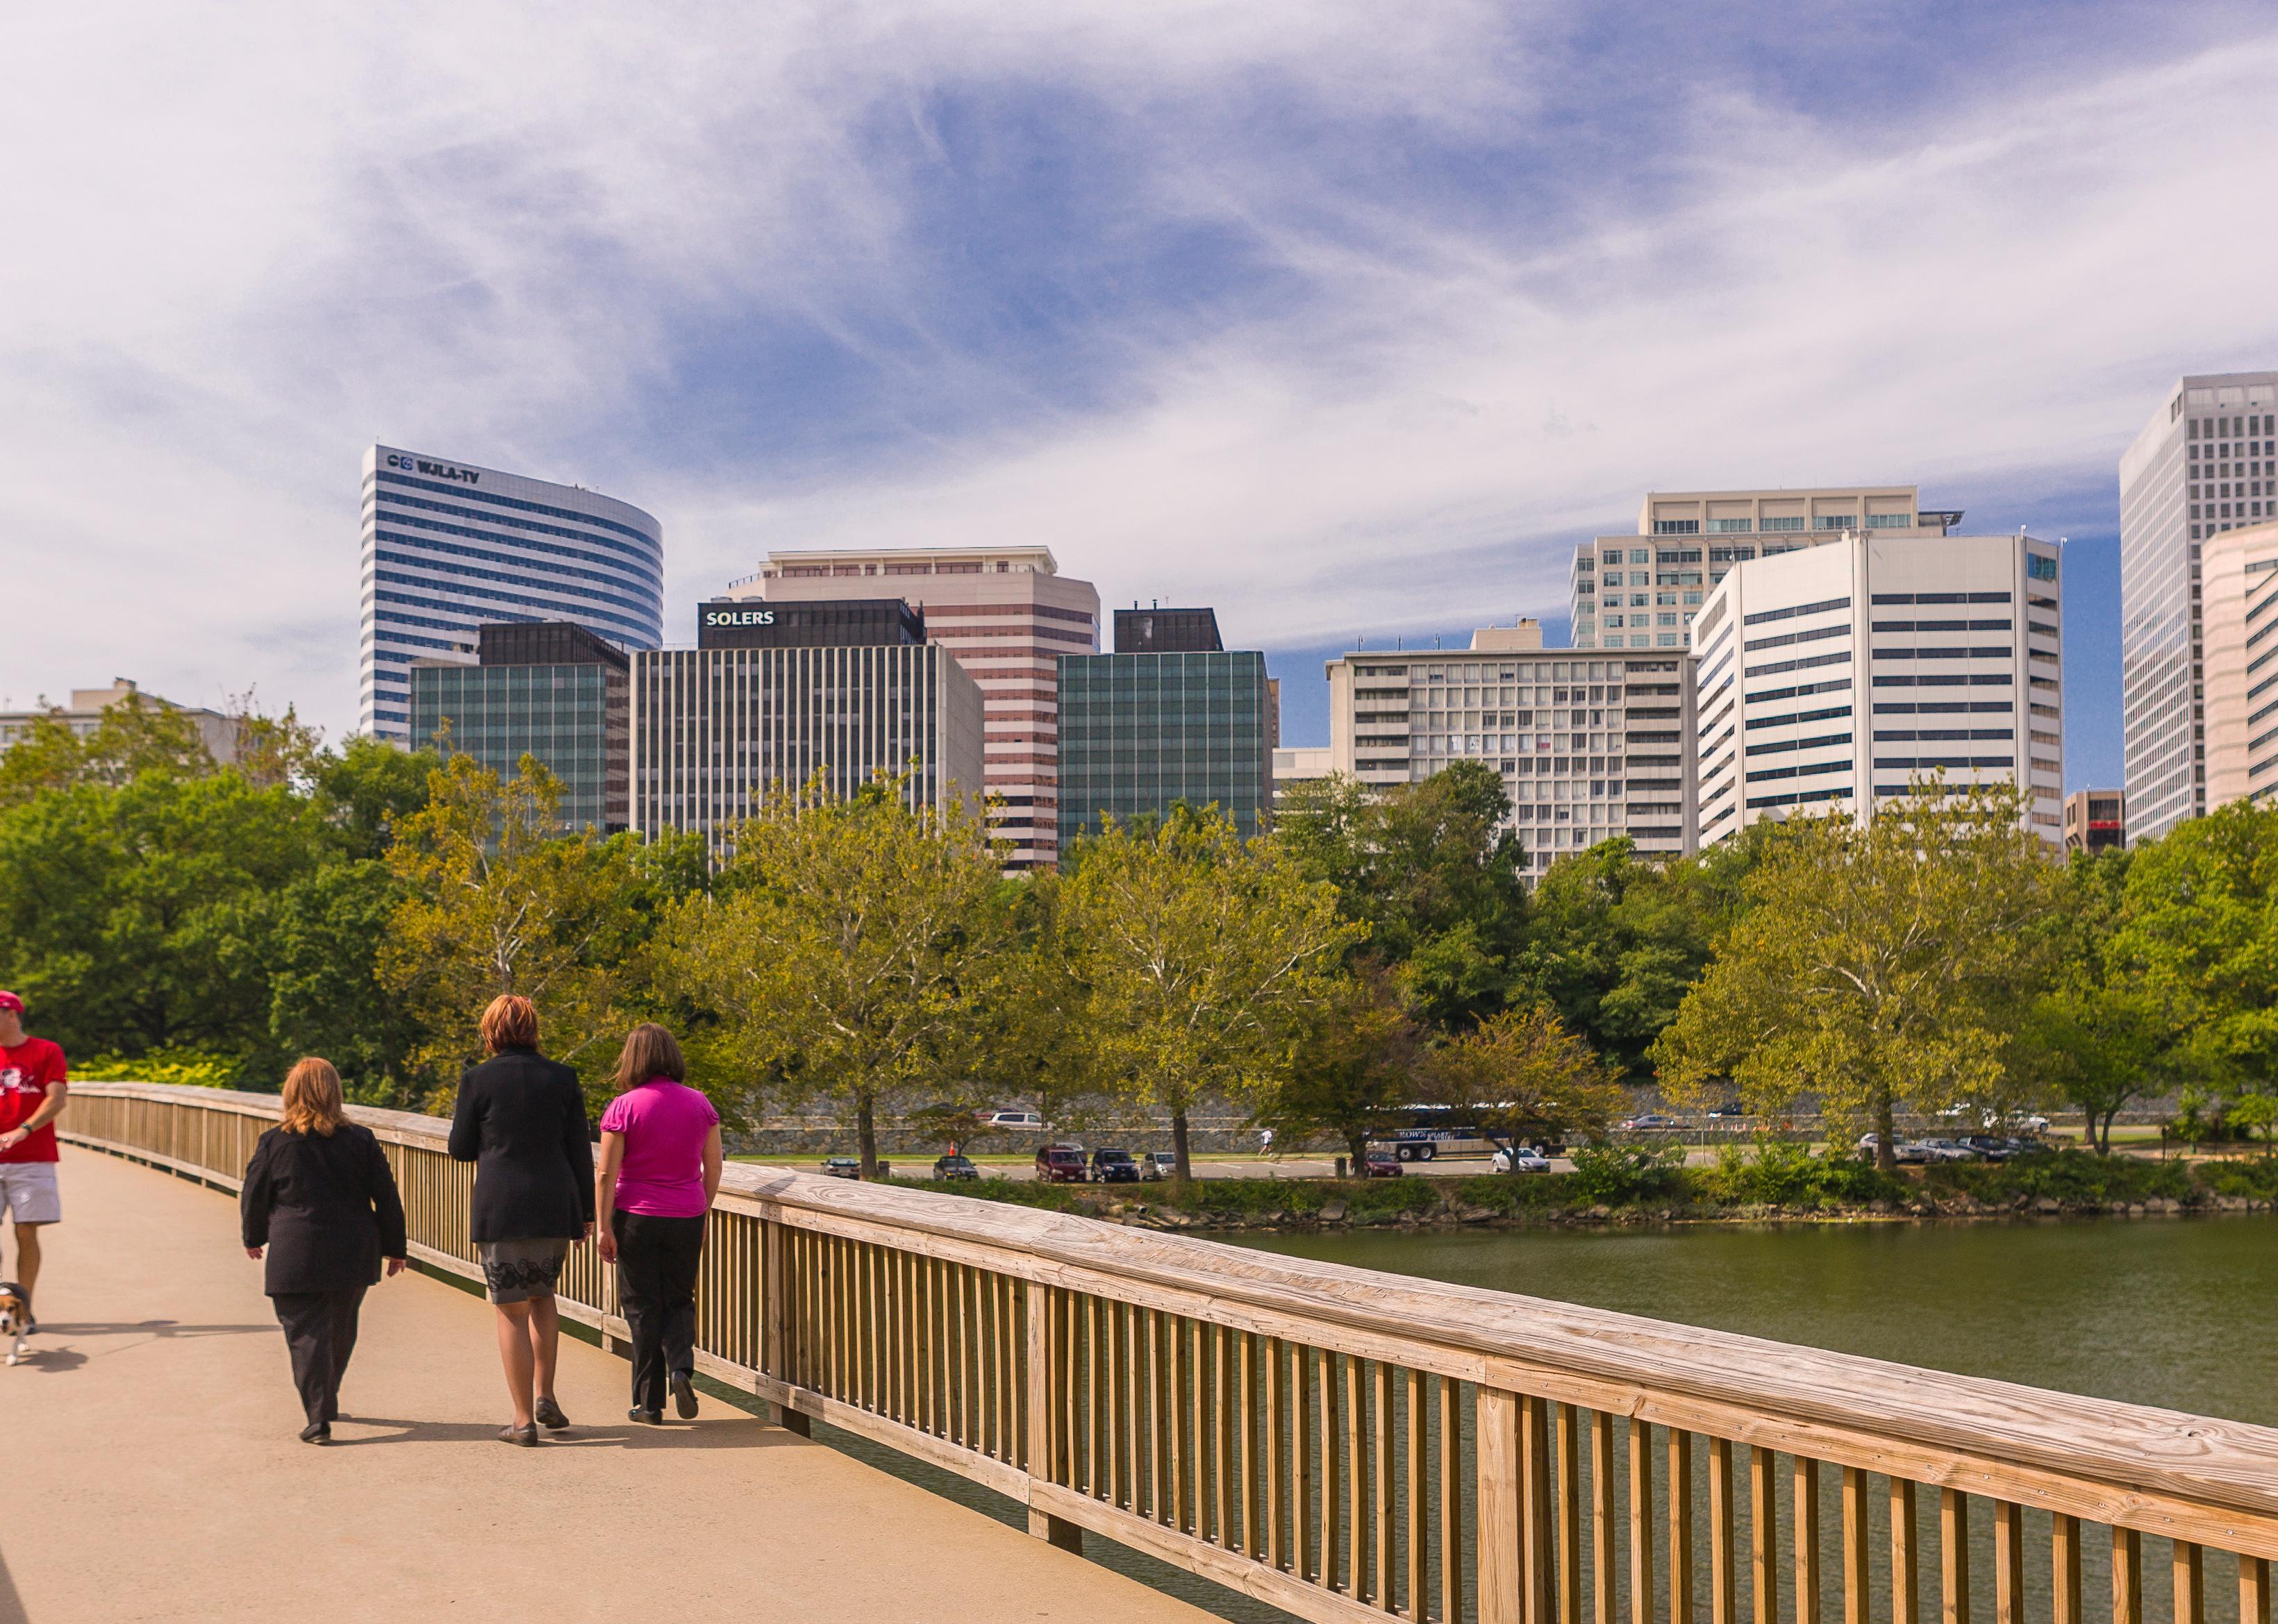
Rob Crandall // Shutterstock
#36. North Rosslyn, Virginia
Pedestrian bridge over Potomac River
– Population: 3,135
– Median household income: $150,454
– Median home value: $935,740
– Median rent: $2,493
– Percent of people who own a home: 45%
– Area feel: null
You may also like: Interior design trends from the 1920s to today
Farragutful // Wikimedia Commons
#35. Arlington Forest, Virginia
A house in the Arlington Forest Historic District
– Population: 2,811
– Median household income: $170,987
– Median home value: $758,498
– Median rent: $2,255
– Percent of people who own a home: 66%
– Area feel: null
Erickson Stock // Shutterstock
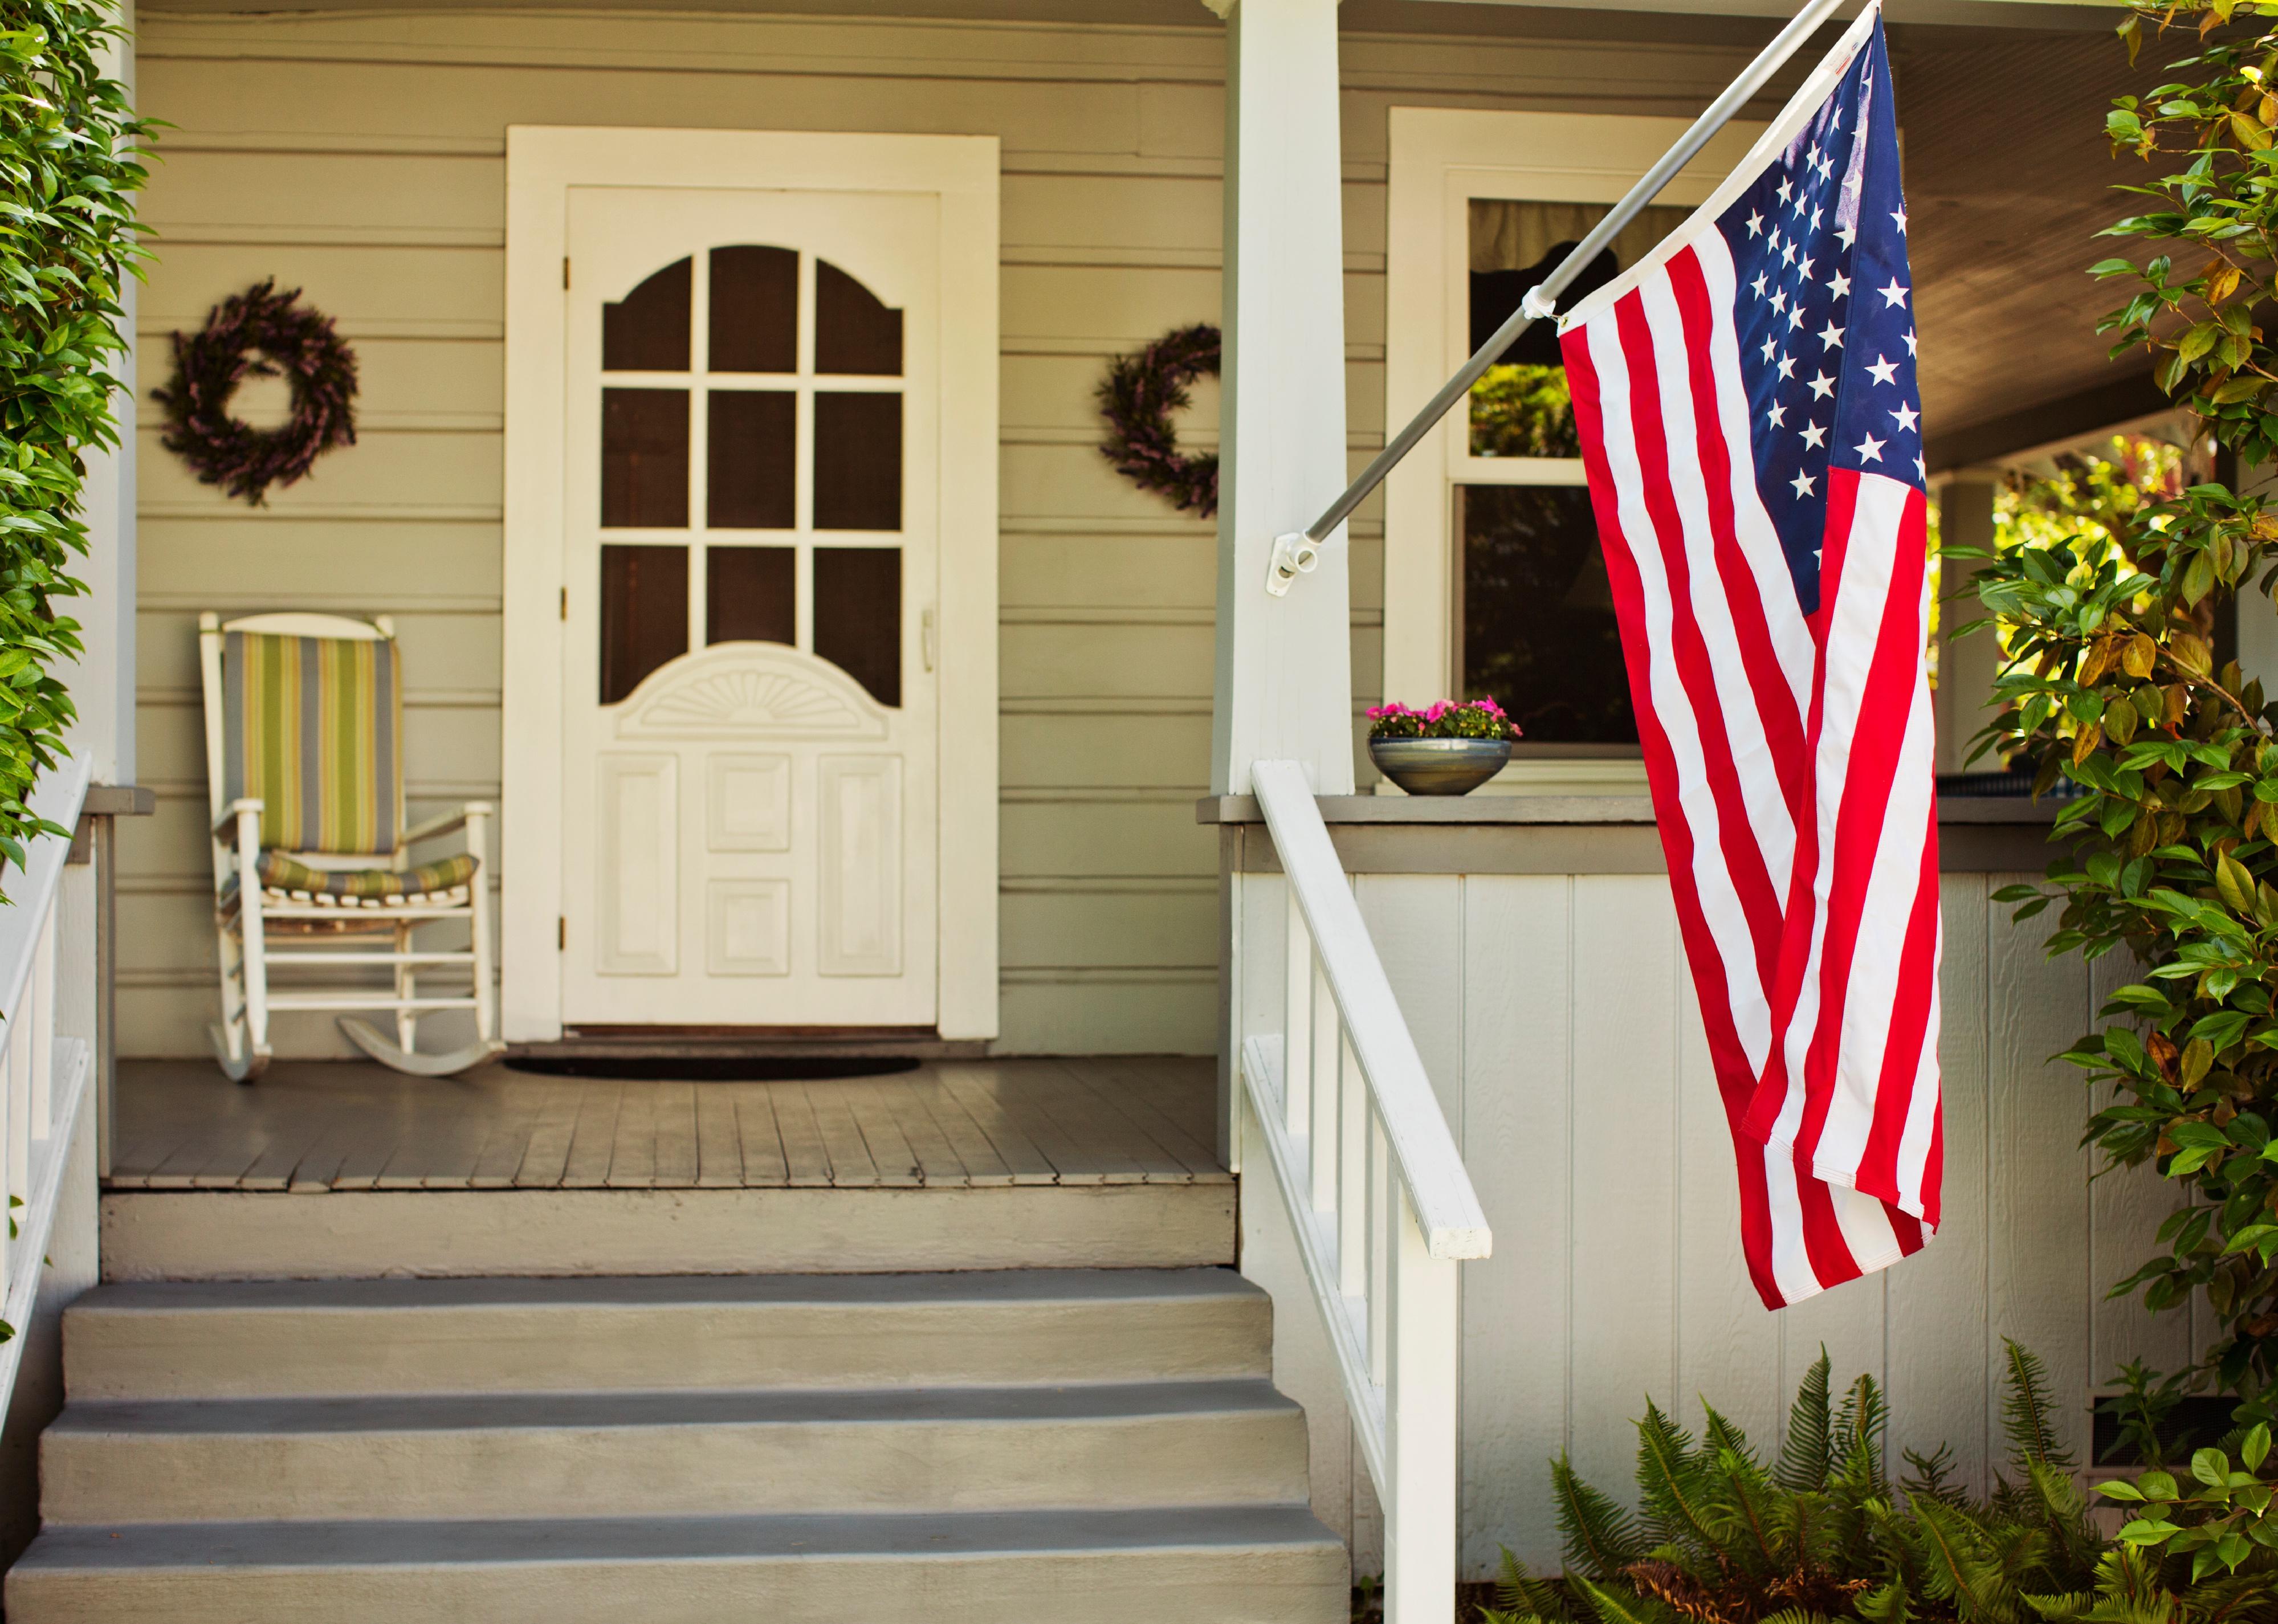
#34. Uptown, Florida
American flag hanging on the front porch of a suburban house
– Population: 1,627
– Median household income: $63,561
– Median home value: $182,197
– Median rent: $1,371
– Percent of people who own a home: 11%
– Area feel: Urban
Joseph Sohm // Shutterstock
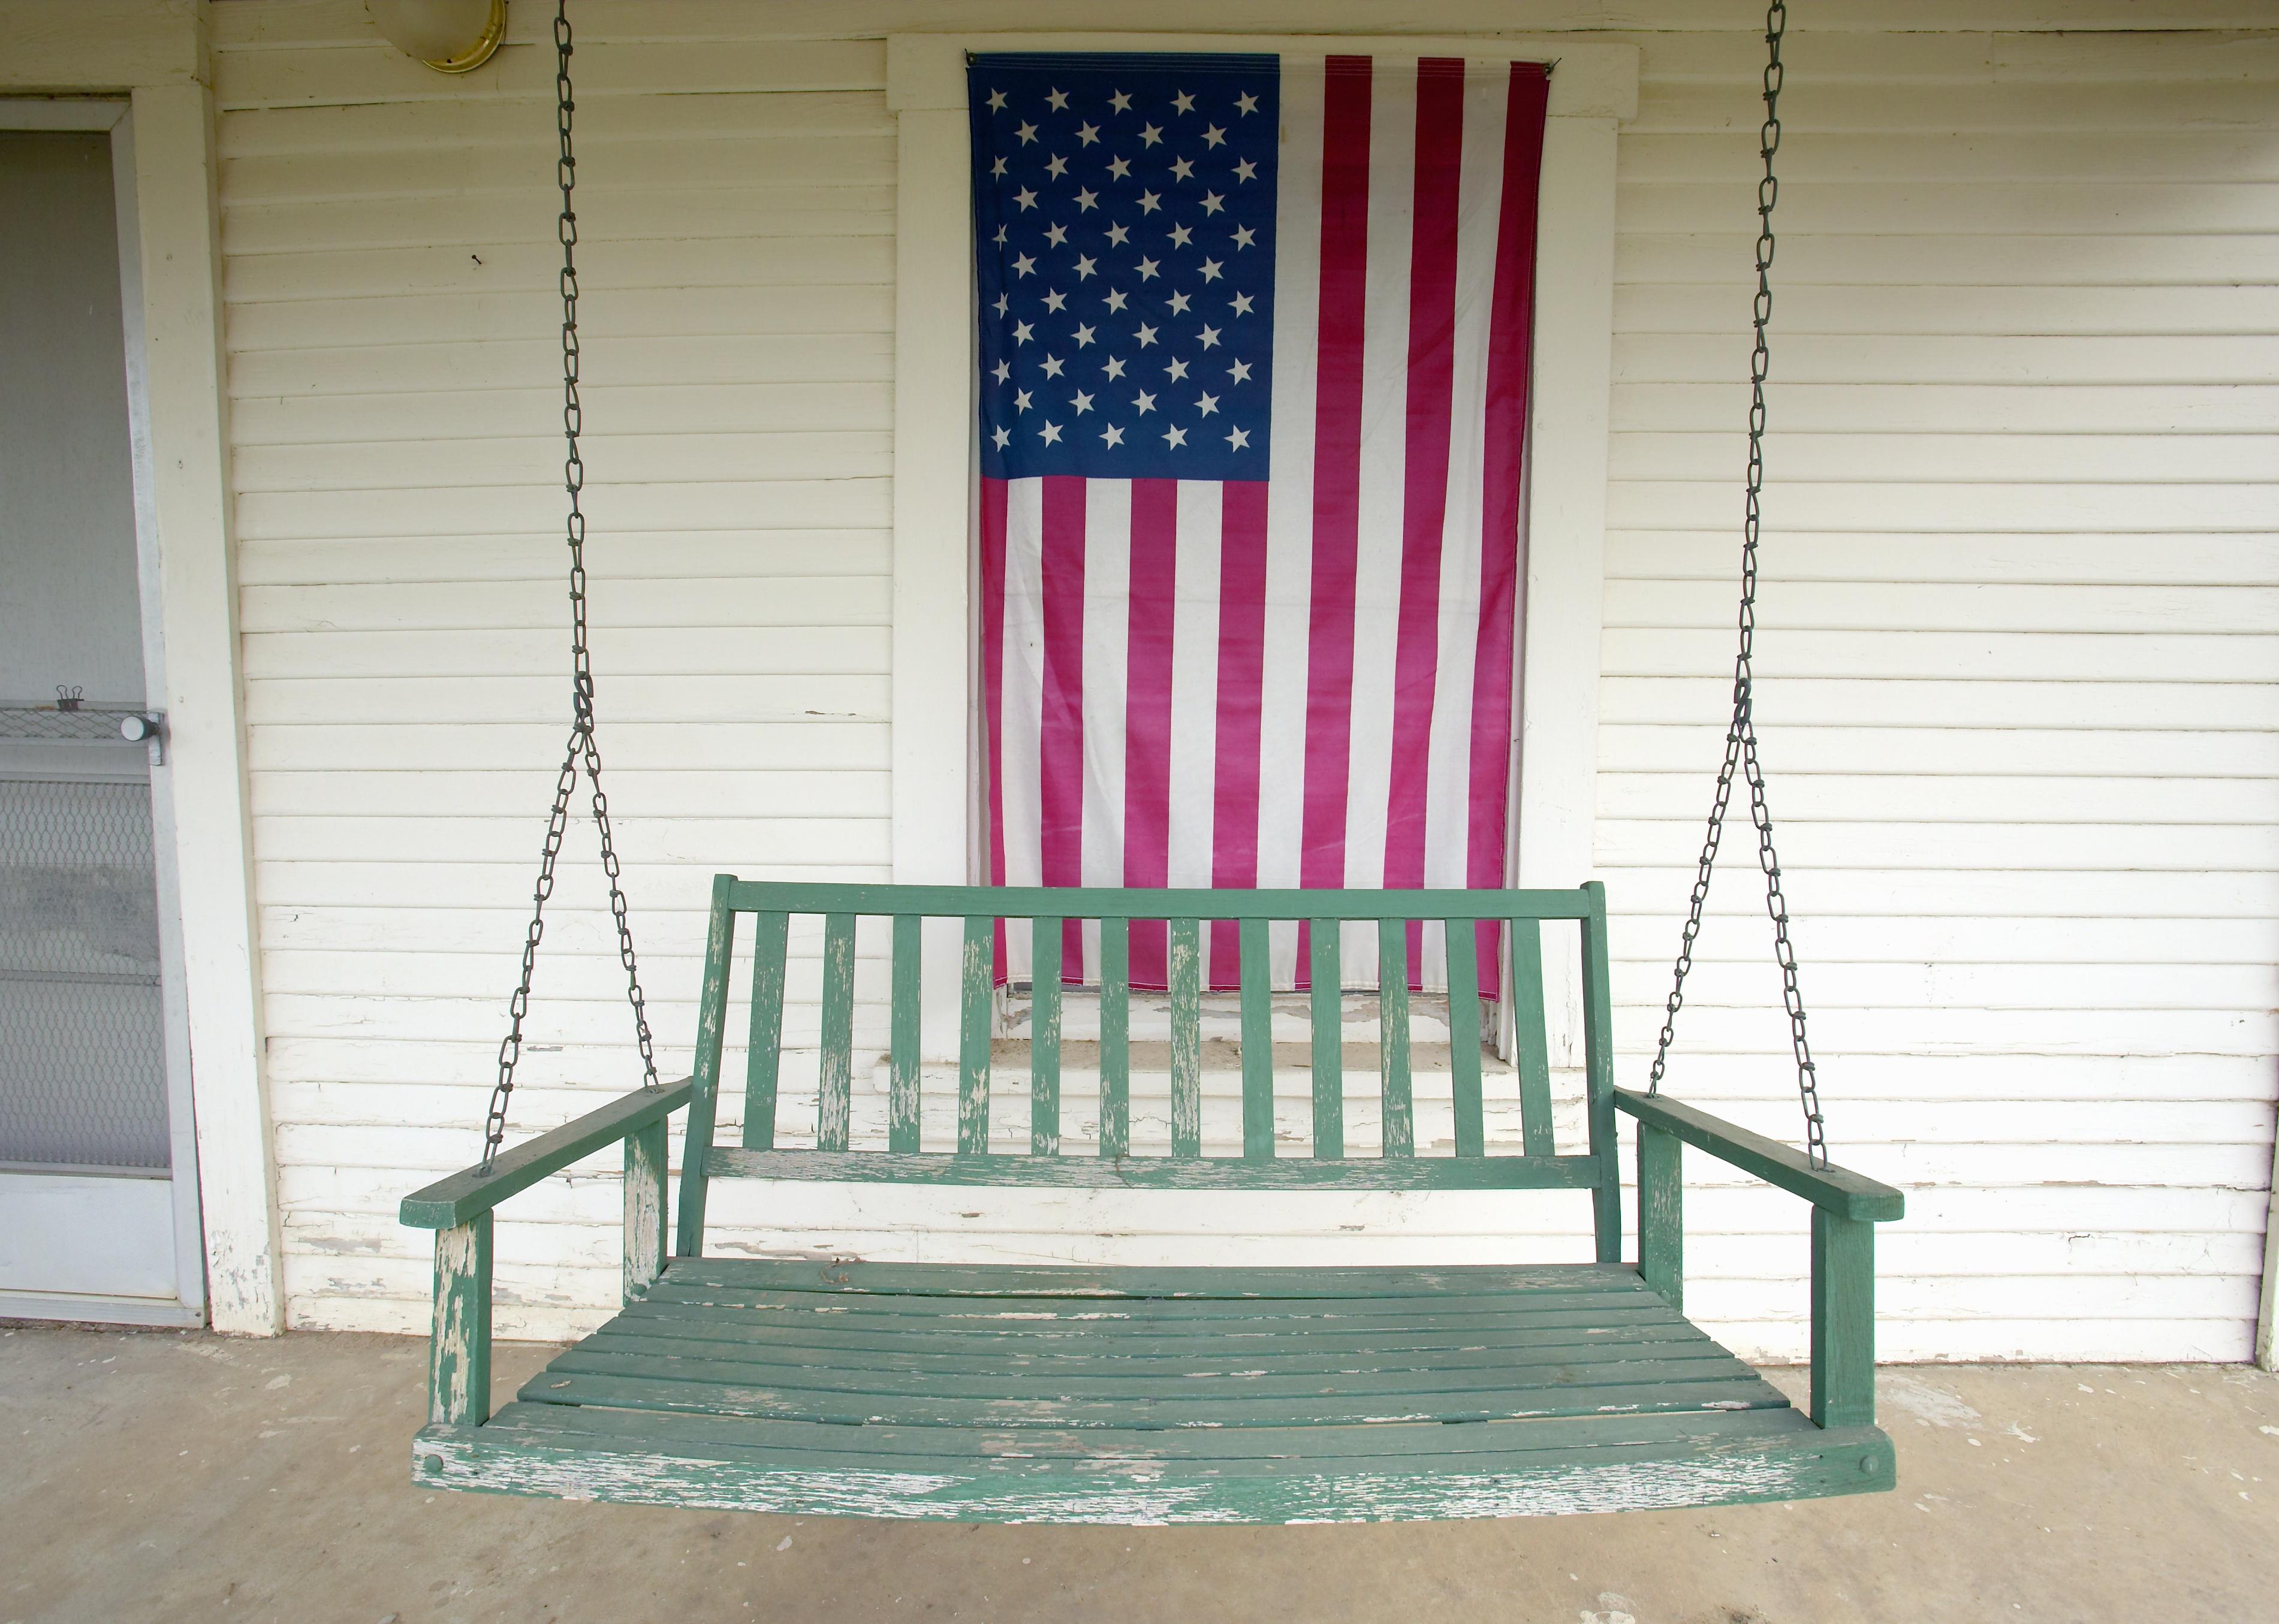
#33. Evergreen Park, California
Old swing on porch displaying an American flag
– Population: 1,269
– Median household income: $134,423
– Median home value: $1,528,175
– Median rent: $2,426
– Percent of people who own a home: 43%
– Area feel: Urban
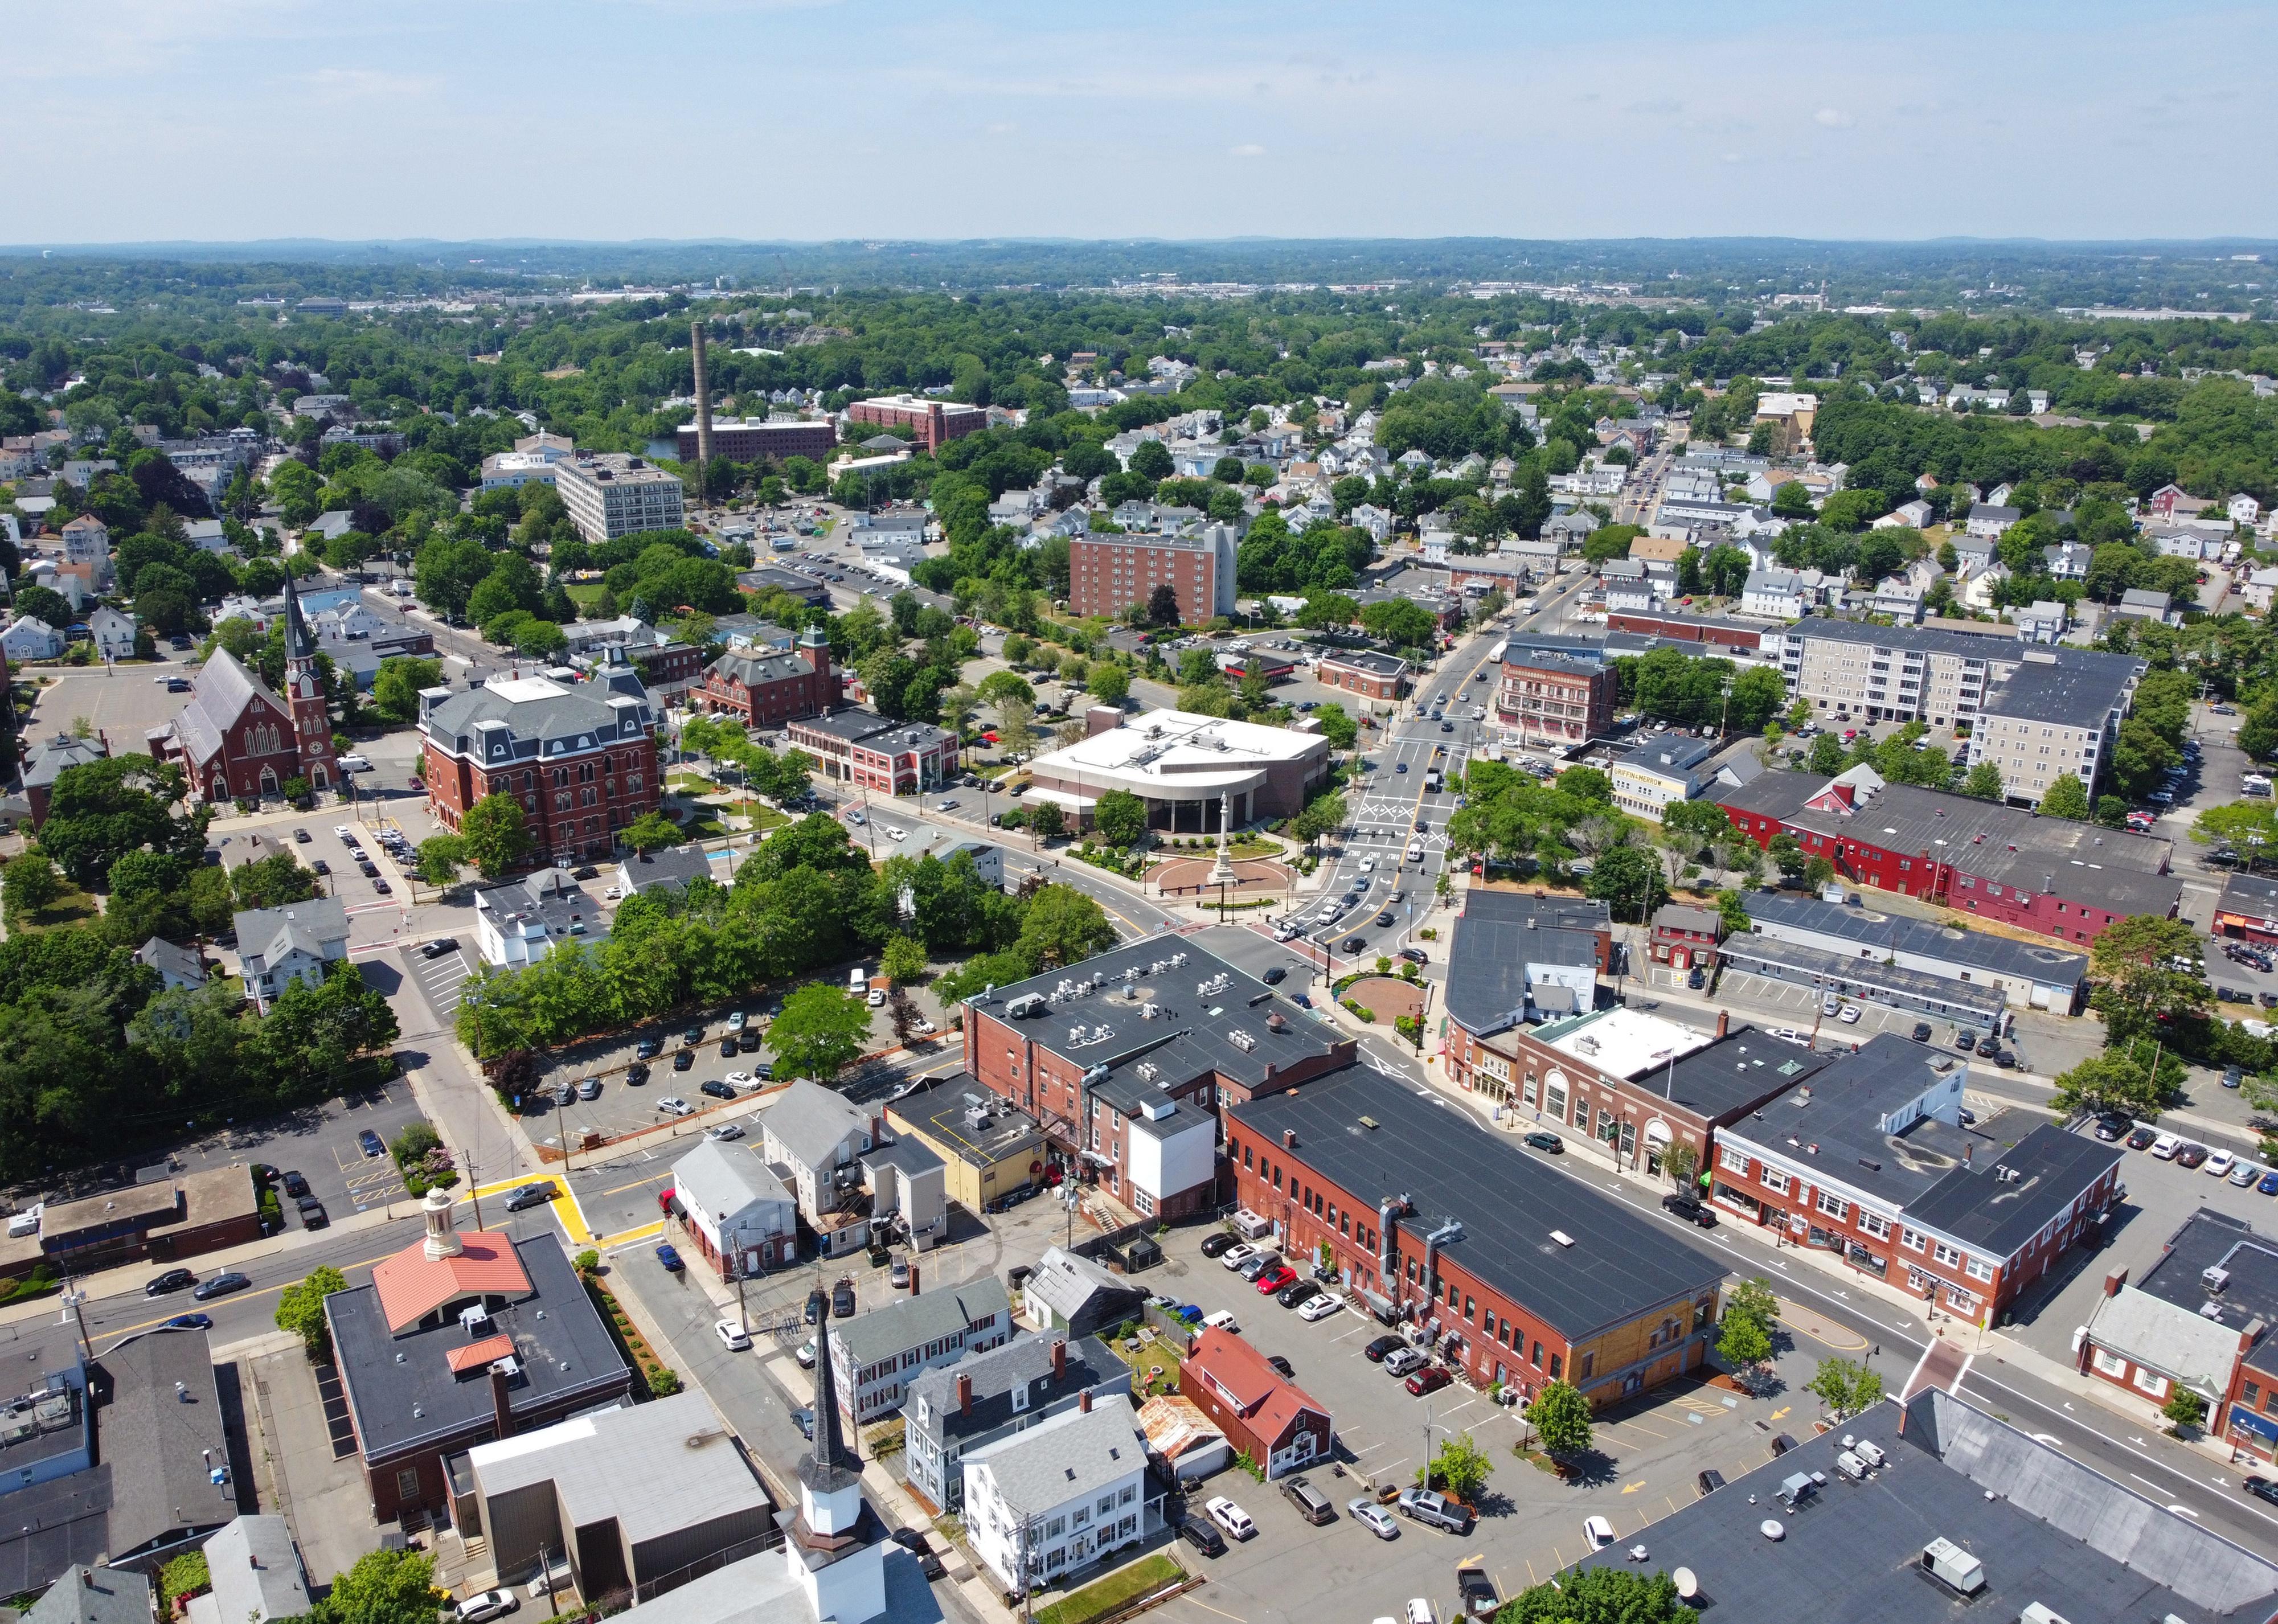
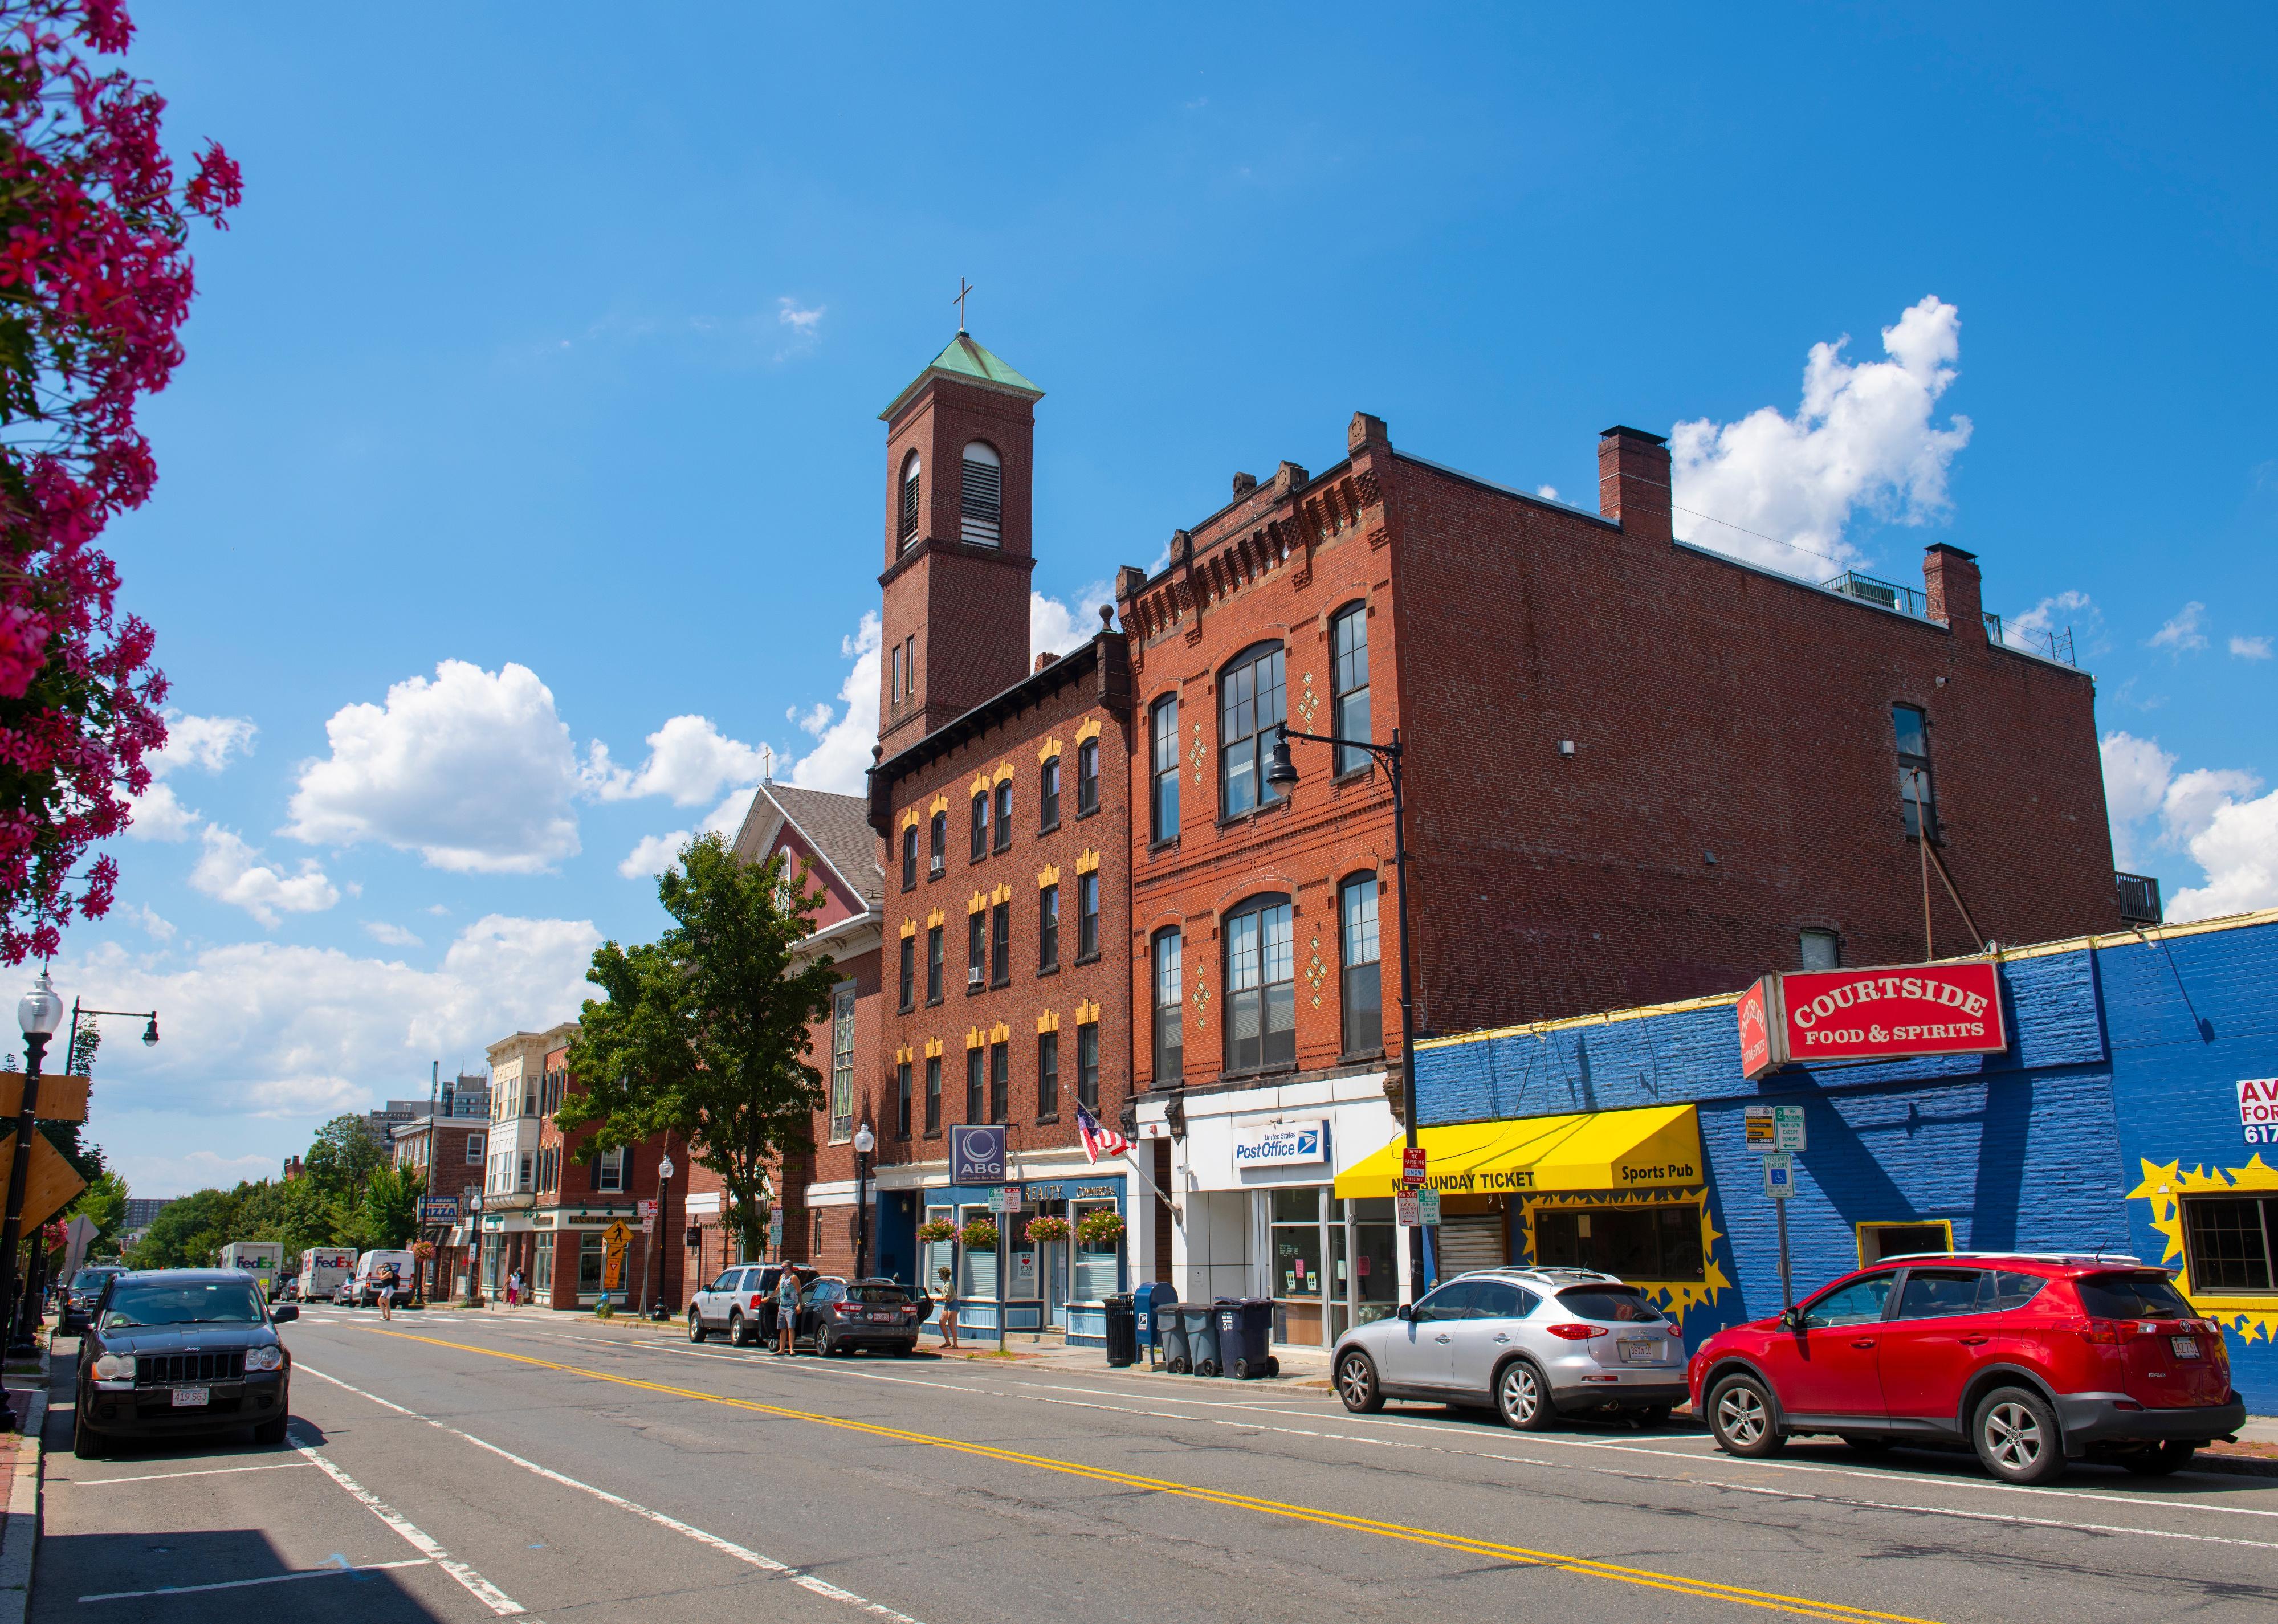
Wangkun Jia // Shutterstock
#32. Peabody, Massachusetts
Aerial view of historic commercial buildings on Main Street in downtown Peabody
– Population: 12,719
– Median household income: $126,795
– Median home value: $934,453
– Median rent: $2,429
– Percent of people who own a home: 42%
– Area feel: Dense urban
Natcounts // Wikimedia Commons
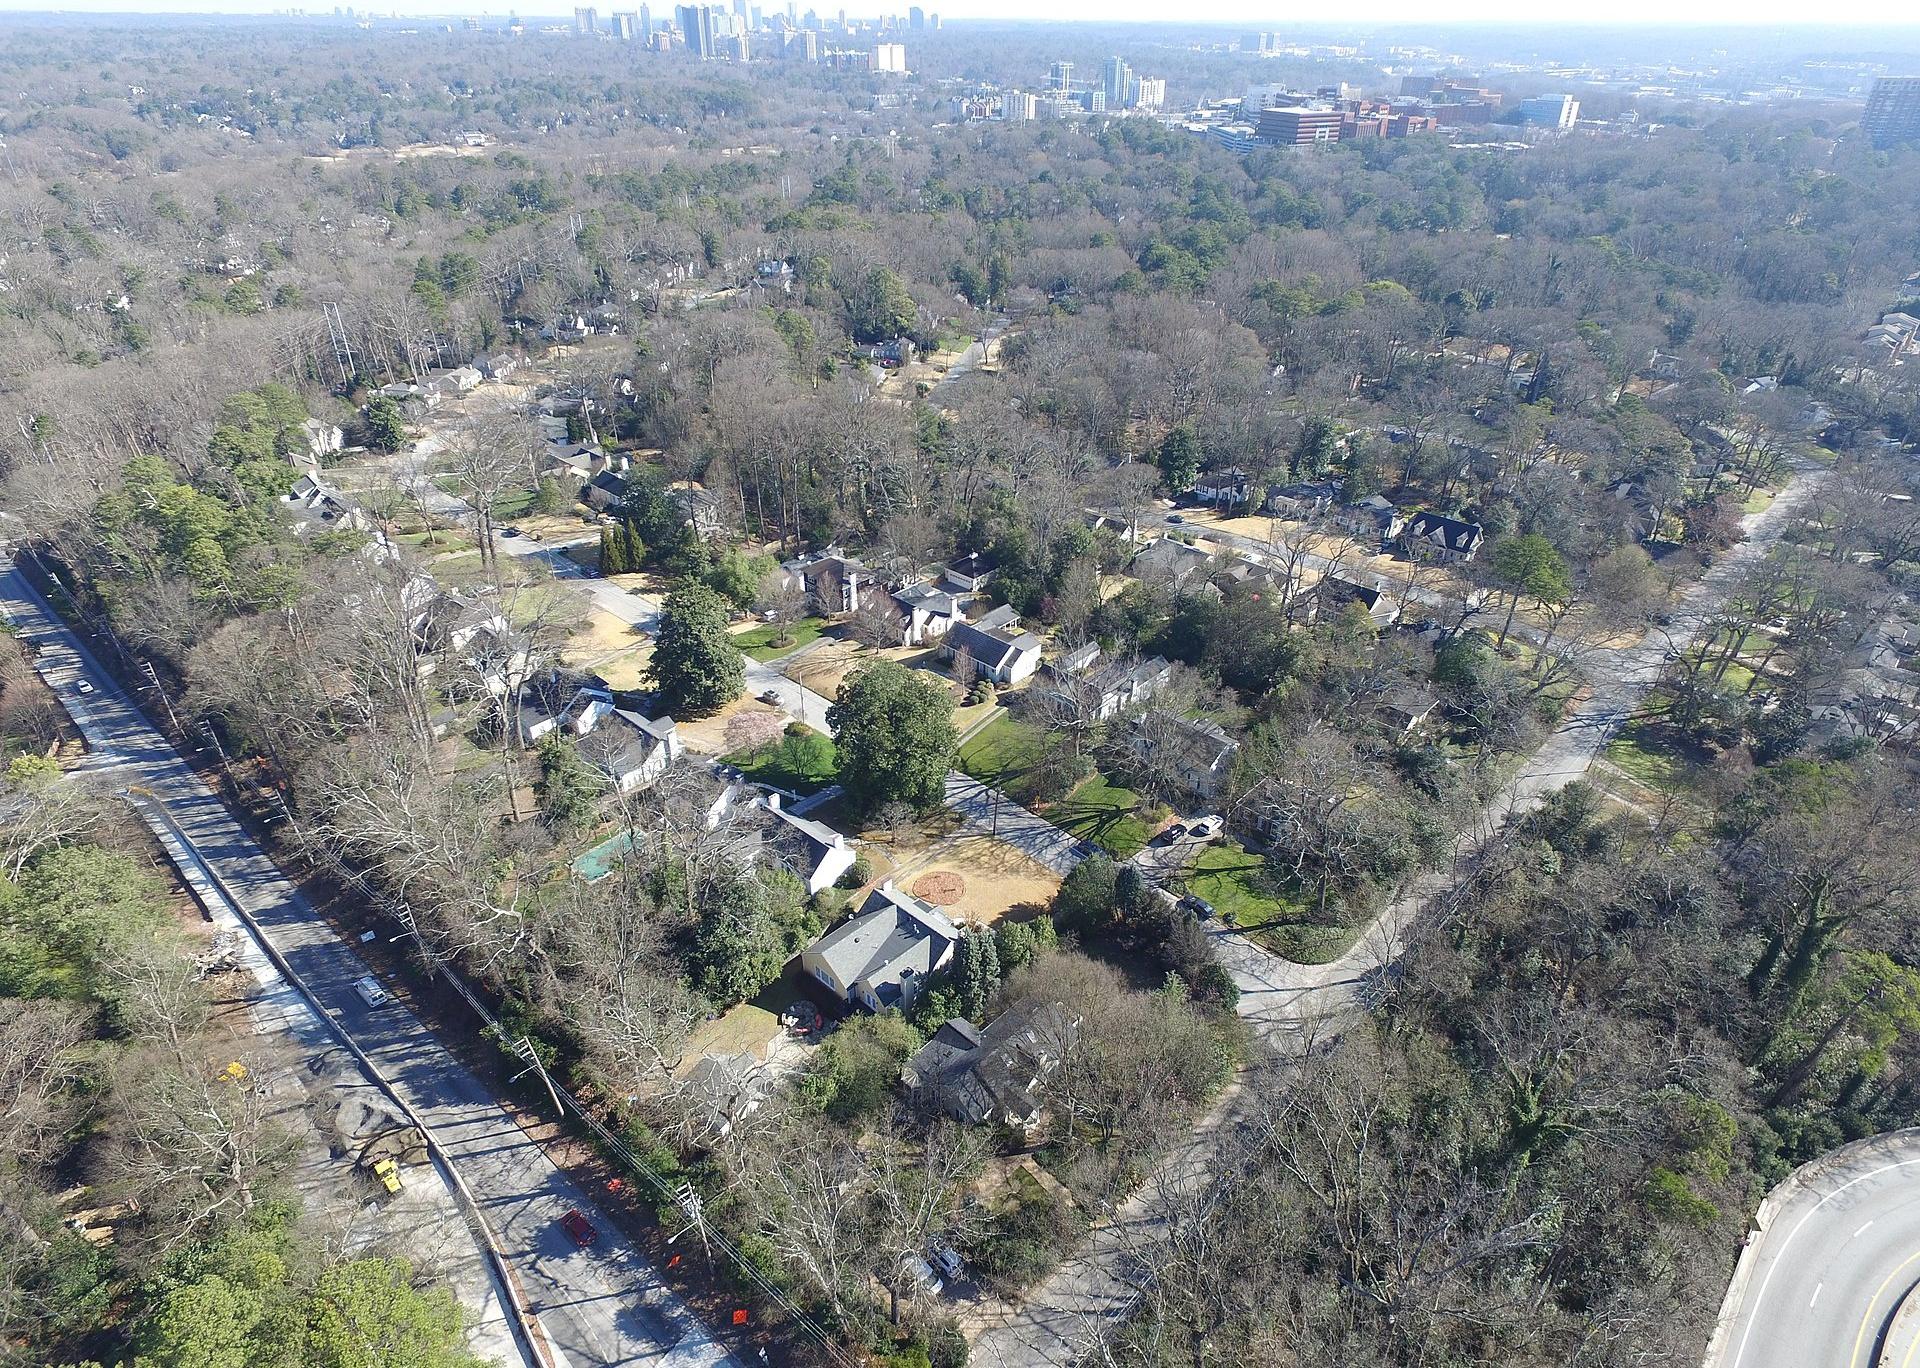
#31. Collier Hills North, Georgia
Collier Hills from Northside Drive / Echota intersection looking towards Buckhead
– Population: 576
– Median household income: $77,984
– Median home value: $334,135
– Median rent: $1,711
– Percent of people who own a home: 32%
– Area feel: Dense urban
You may also like: Can you guess these famous skylines?
romakoma // Shutterstock
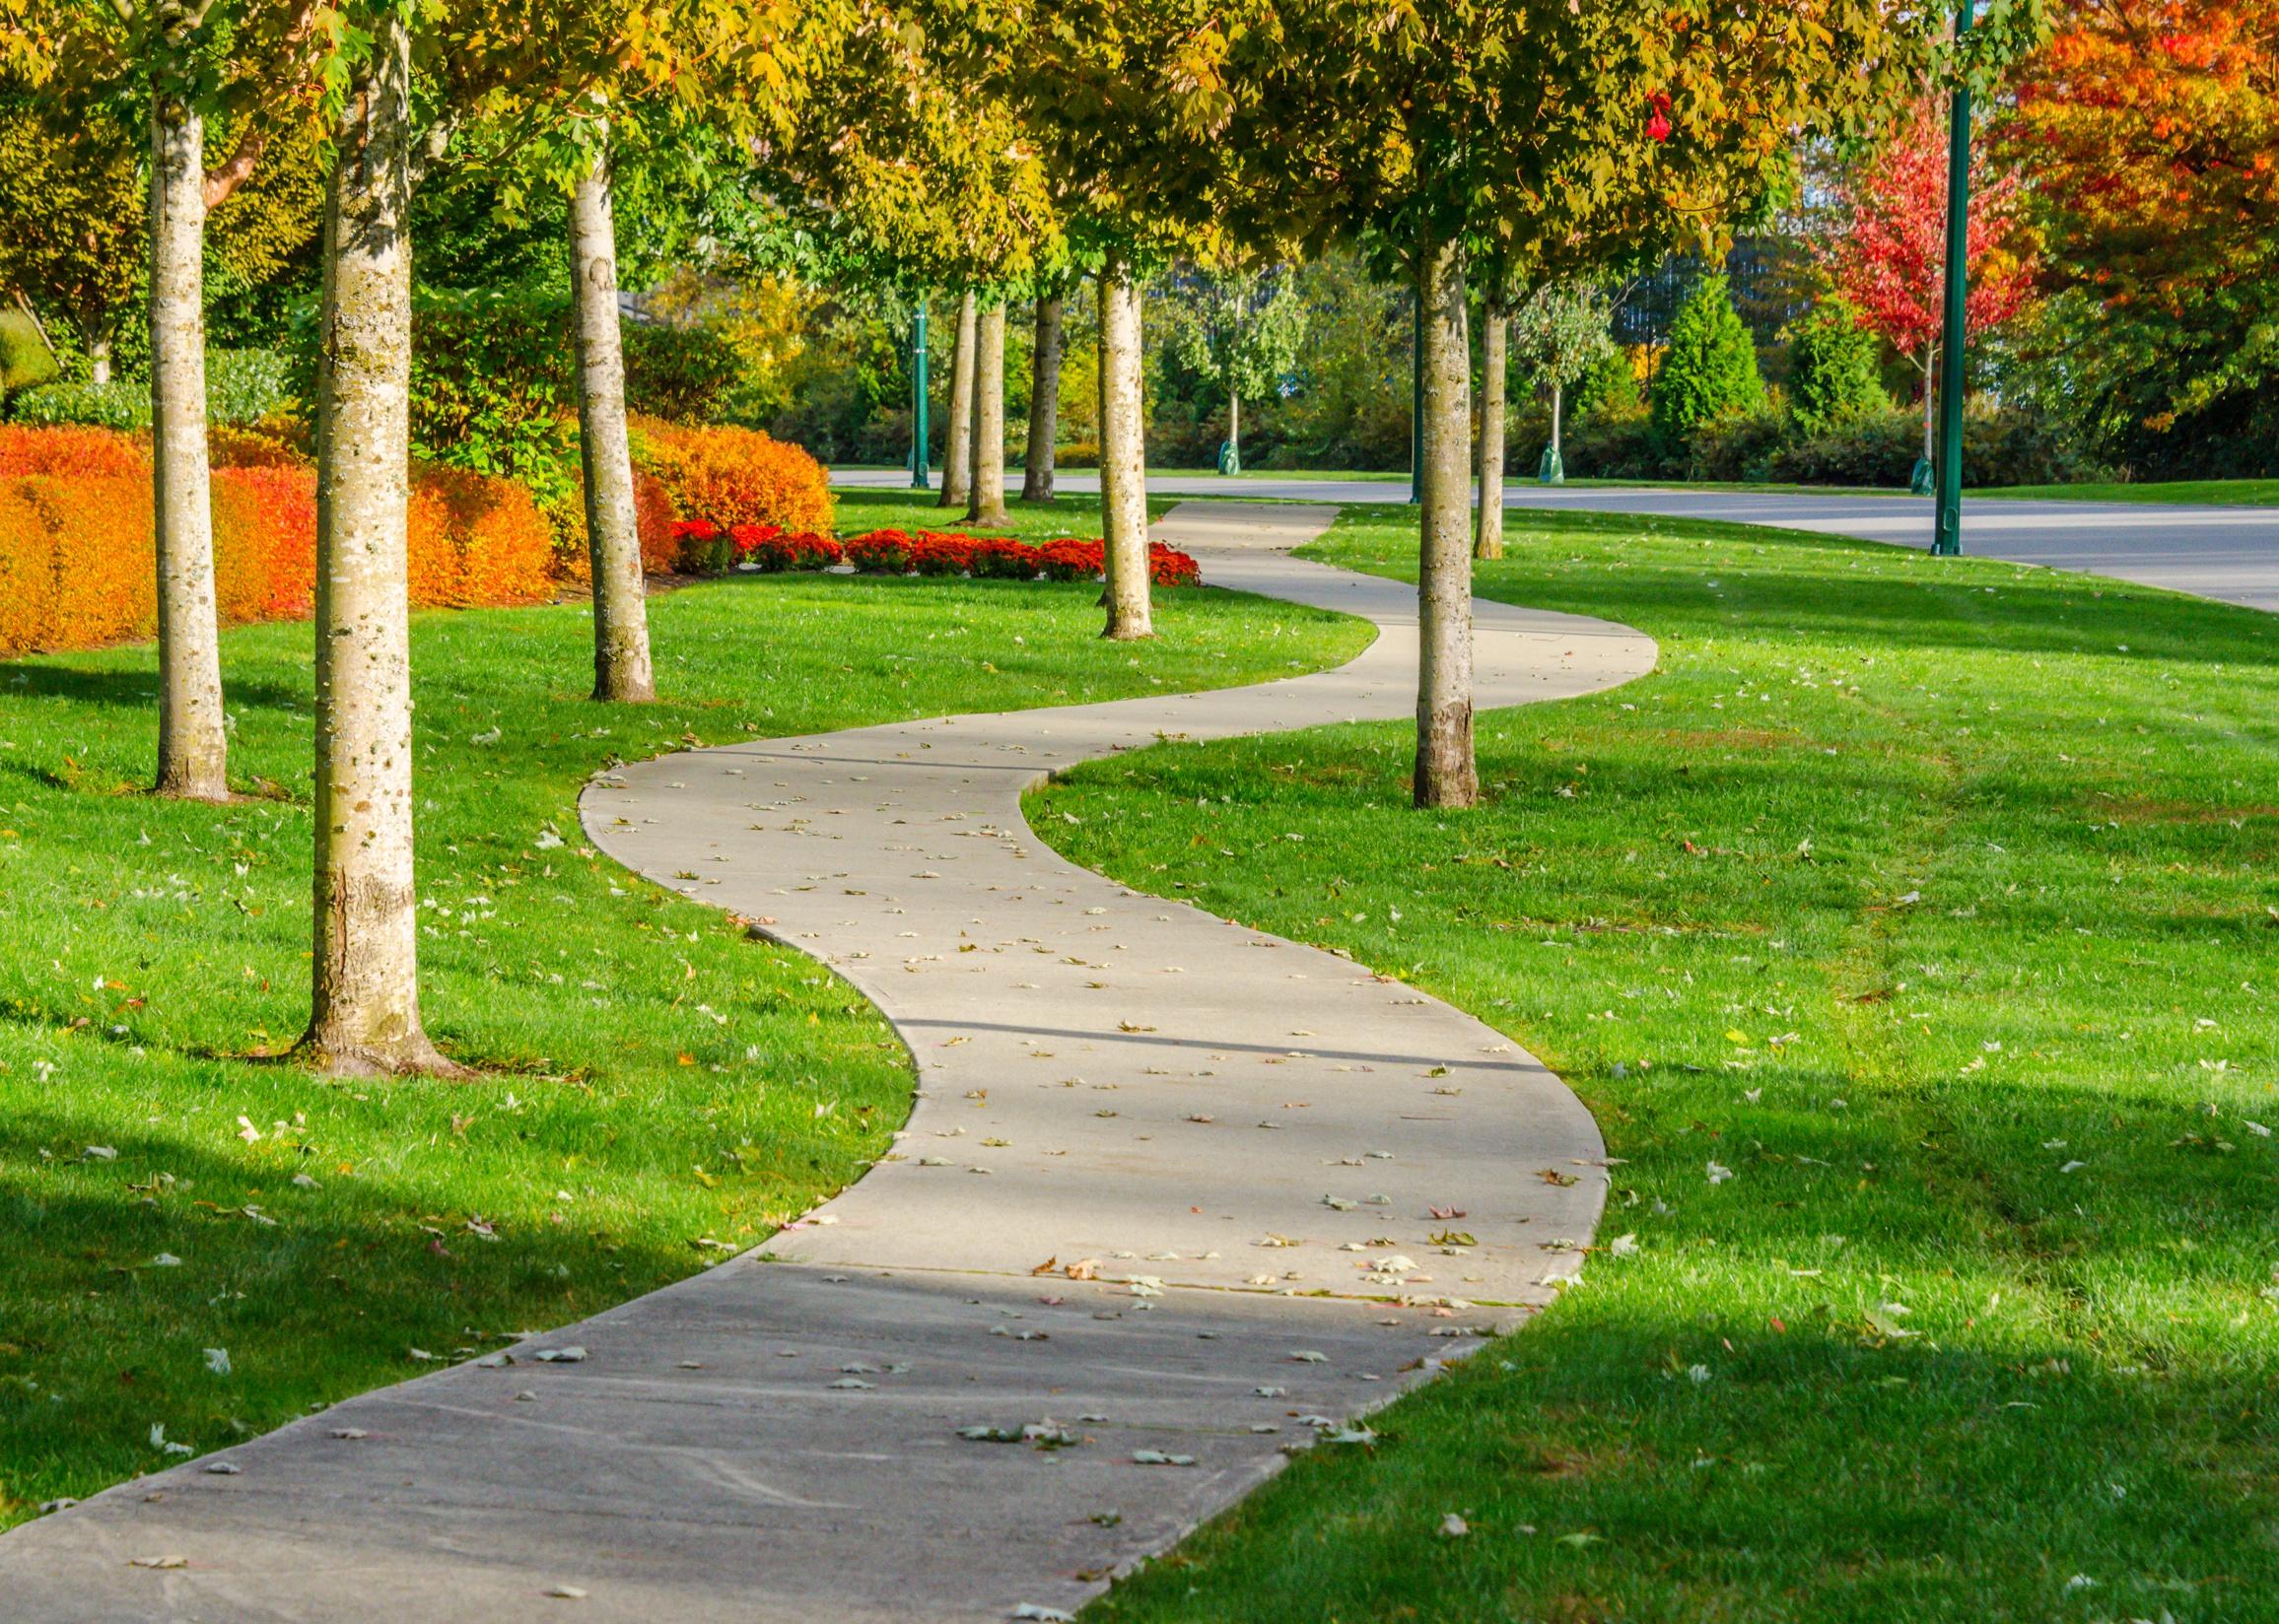
#30. Crescent Park, California
Curved sidewalk, path, trail at the empty street
– Population: 4,018
– Median household income: $232,524
– Median home value: $1,992,024
– Median rent: $3,109
– Percent of people who own a home: 73%
– Area feel: Urban suburban mix
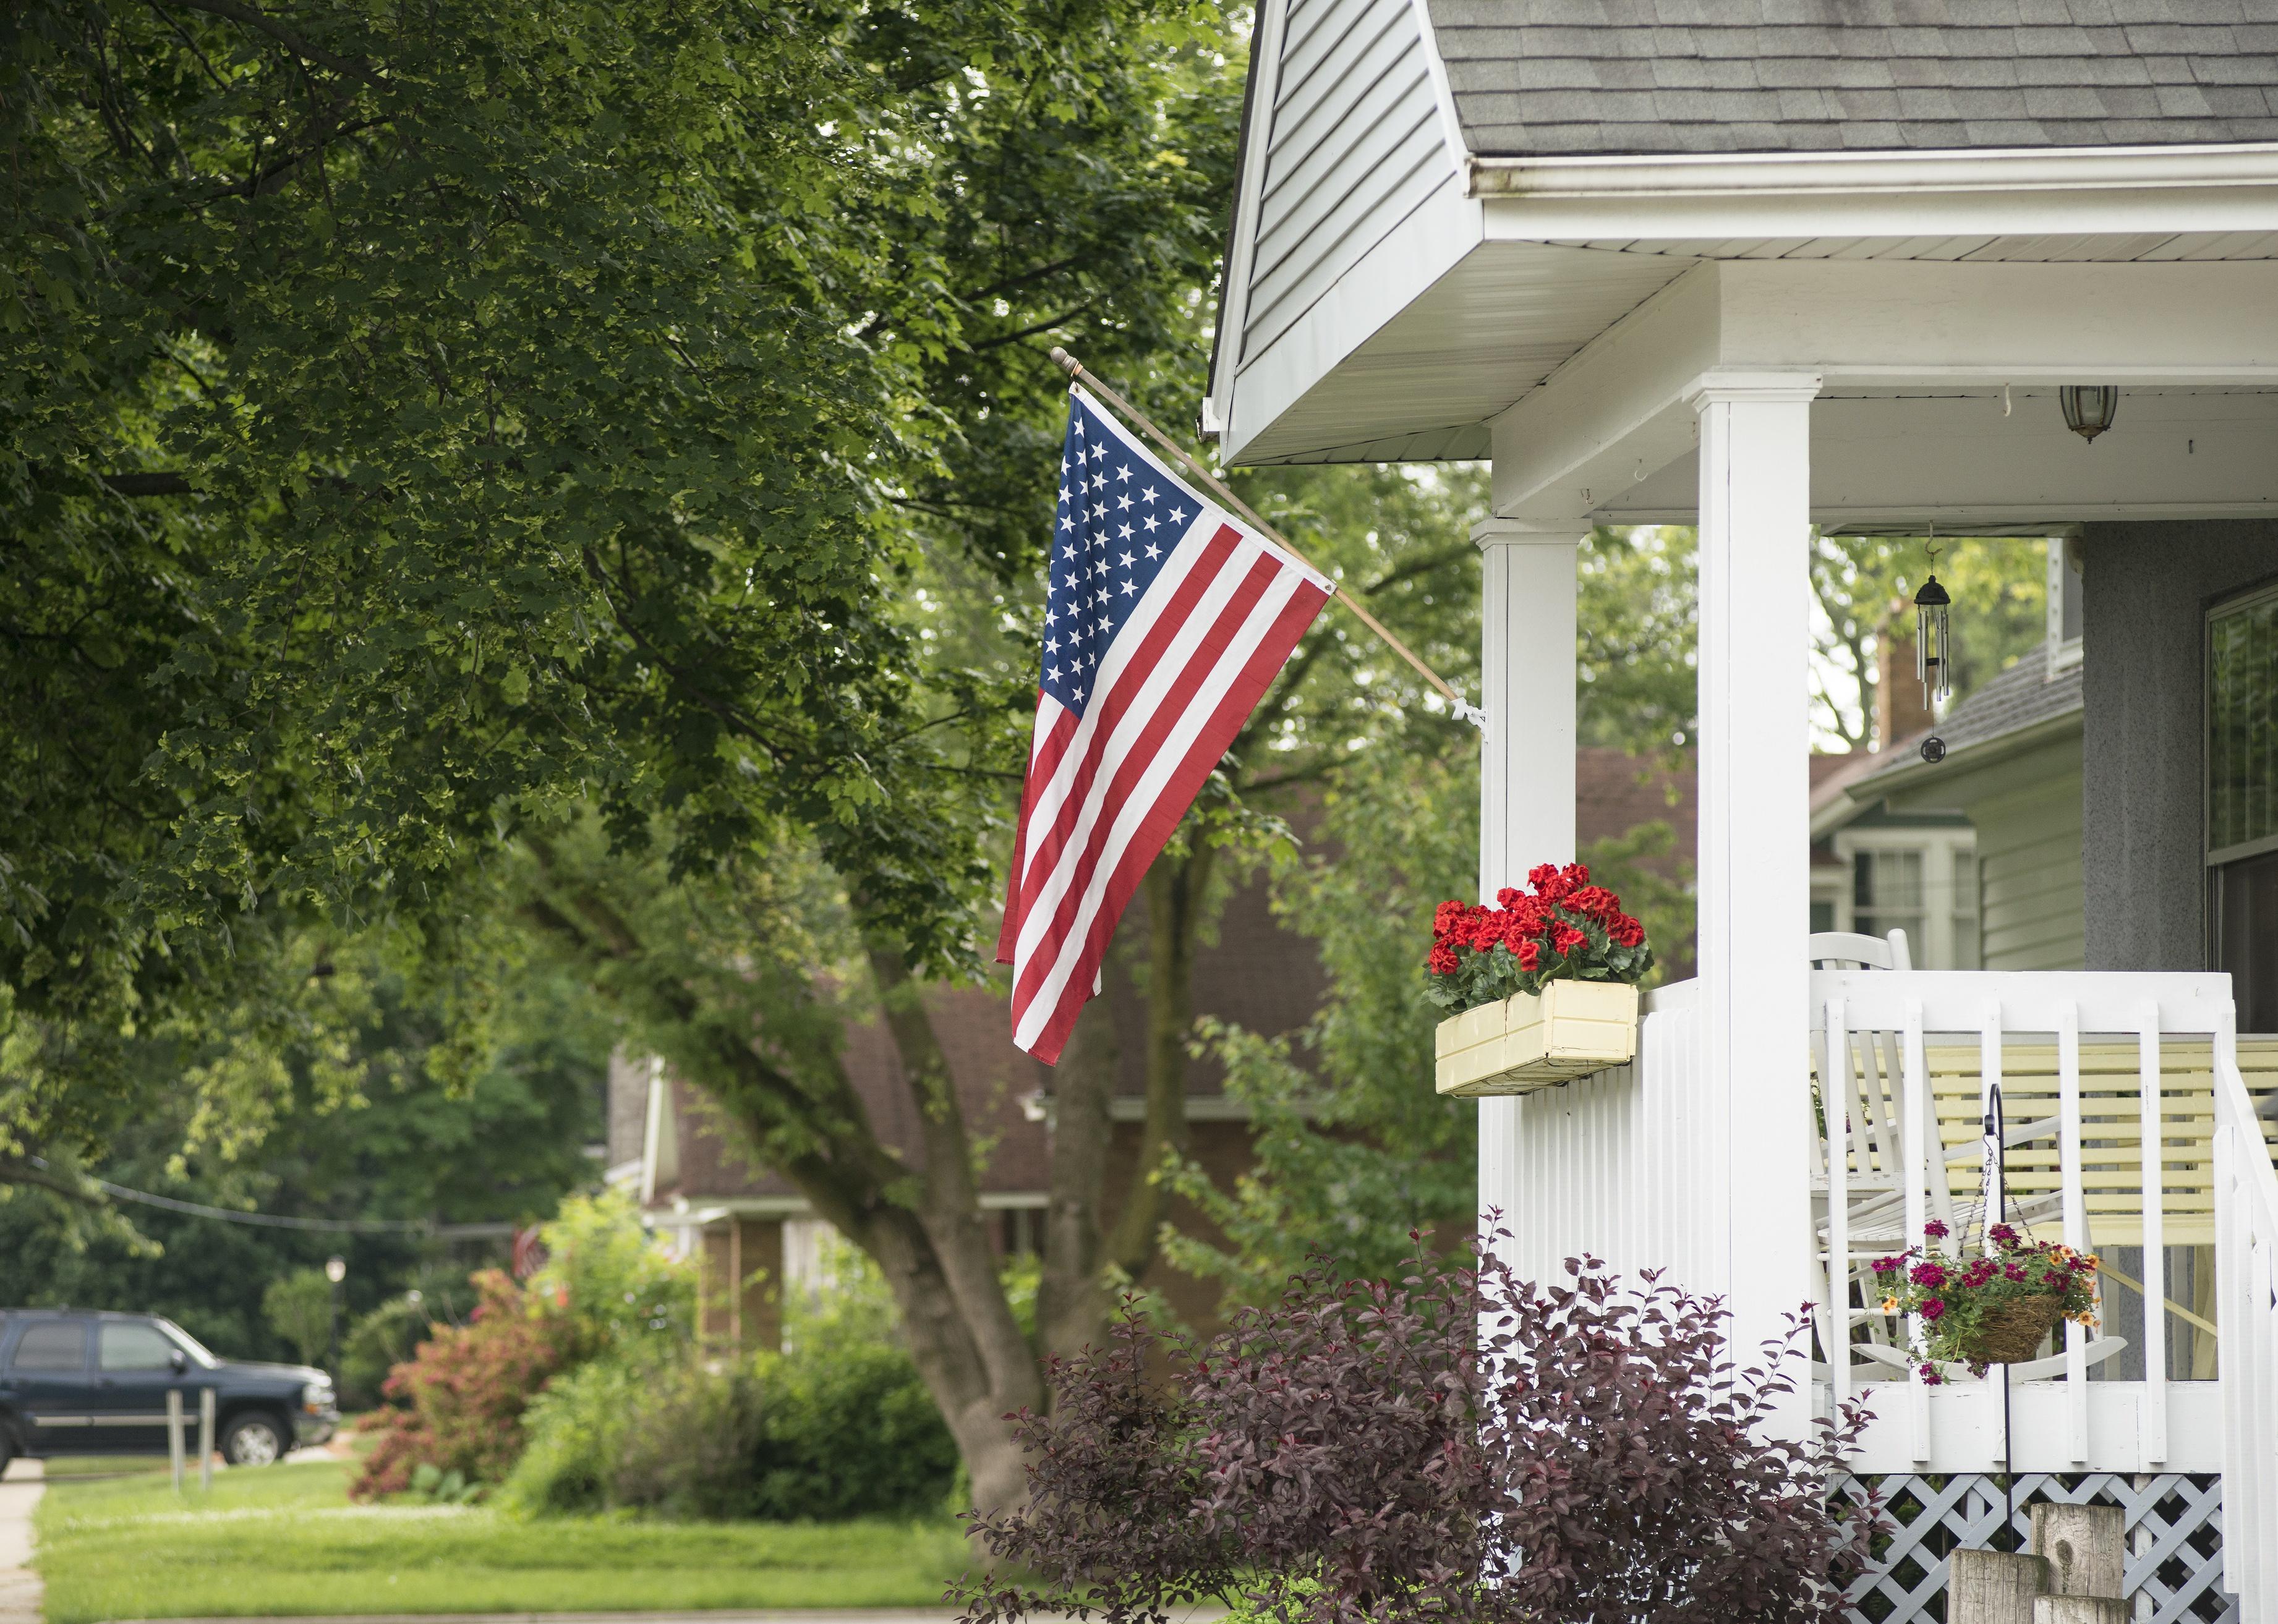
CC Photo Labs // Shutterstock
#29. Duveneck/St. Francis, California
Residential home with an American flag on it
– Population: 3,085
– Median household income: $231,908
– Median home value: $1,957,201
– Median rent: $3,082
– Percent of people who own a home: 84%
– Area feel: Urban suburban mix
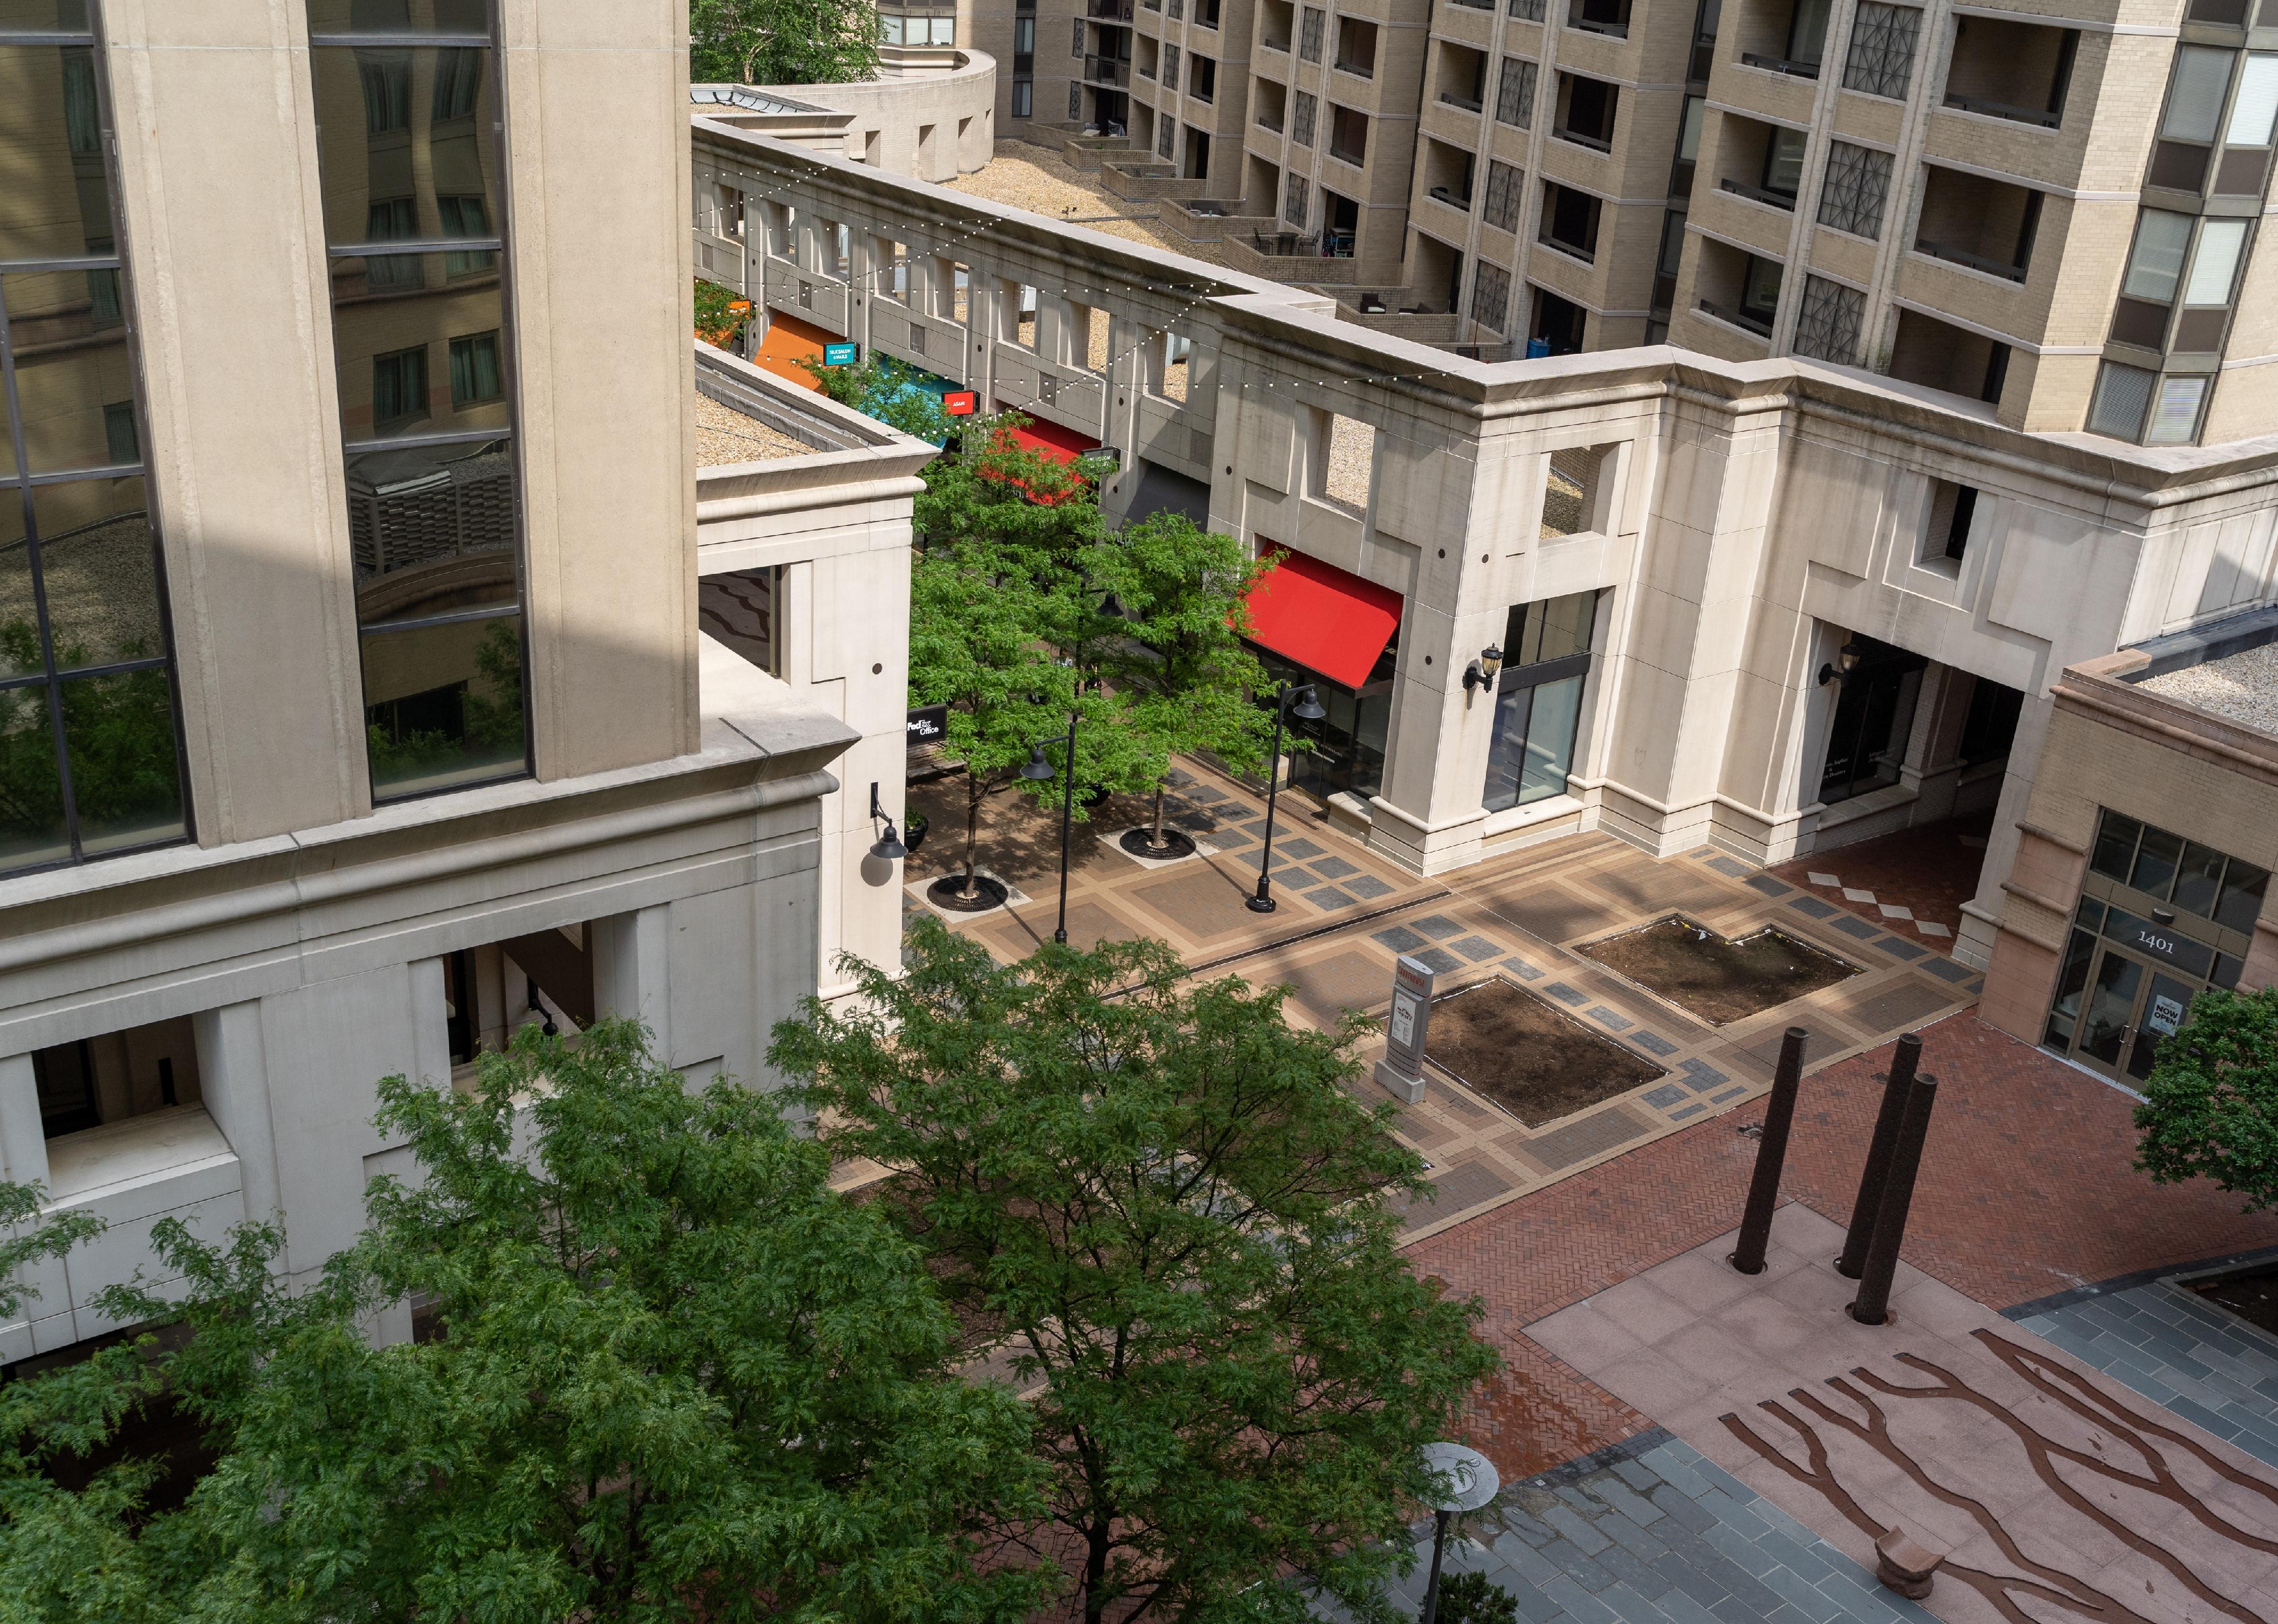
melissamn // Shutterstock
#28. Clarendon/Courthouse, Virginia
Aerial view of the Courthouse Plaza
– Population: 9,877
– Median household income: $125,792
– Median home value: $664,532
– Median rent: $2,321
– Percent of people who own a home: 22%
– Area feel: null
Mark and Anna Photography // Shutterstock
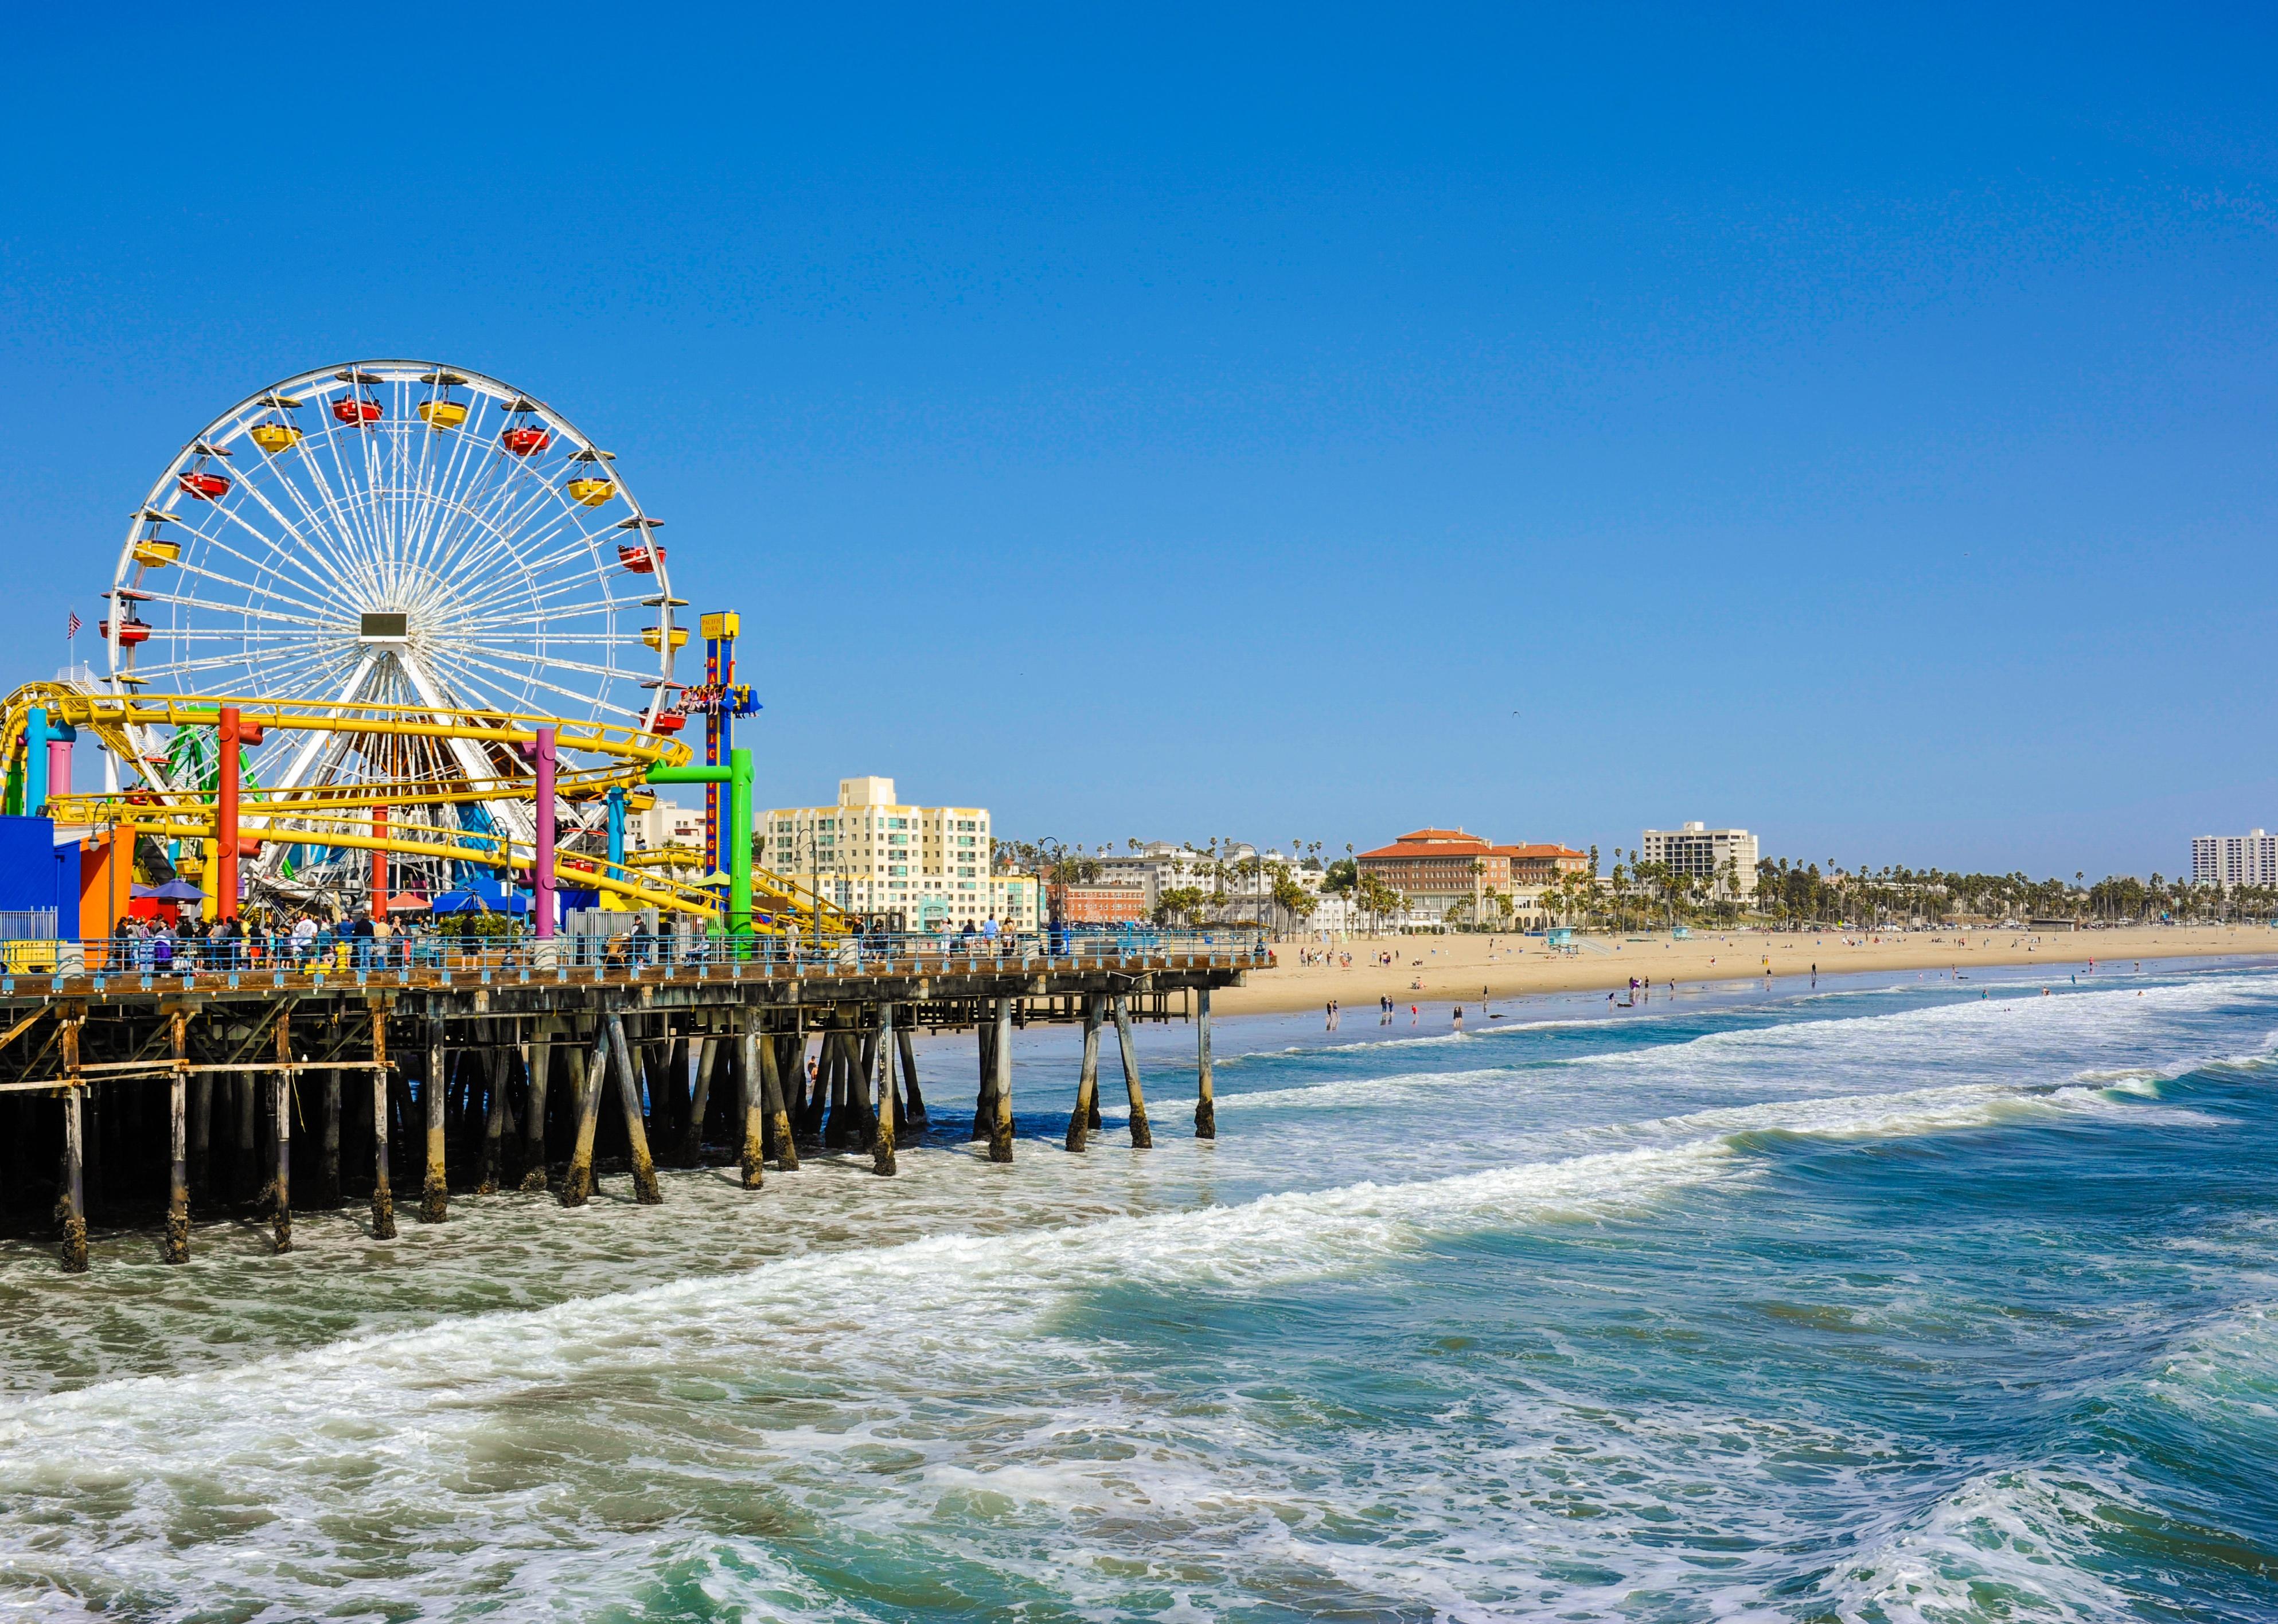
#27. Santa Monica, California
Santa Monica Pier
– Population: 91,600
– Median household income: $98,300
– Median home value: $1,452,100
– Median rent: $1,900
– Percent of people who own a home: 28%
– Area feel: Urban
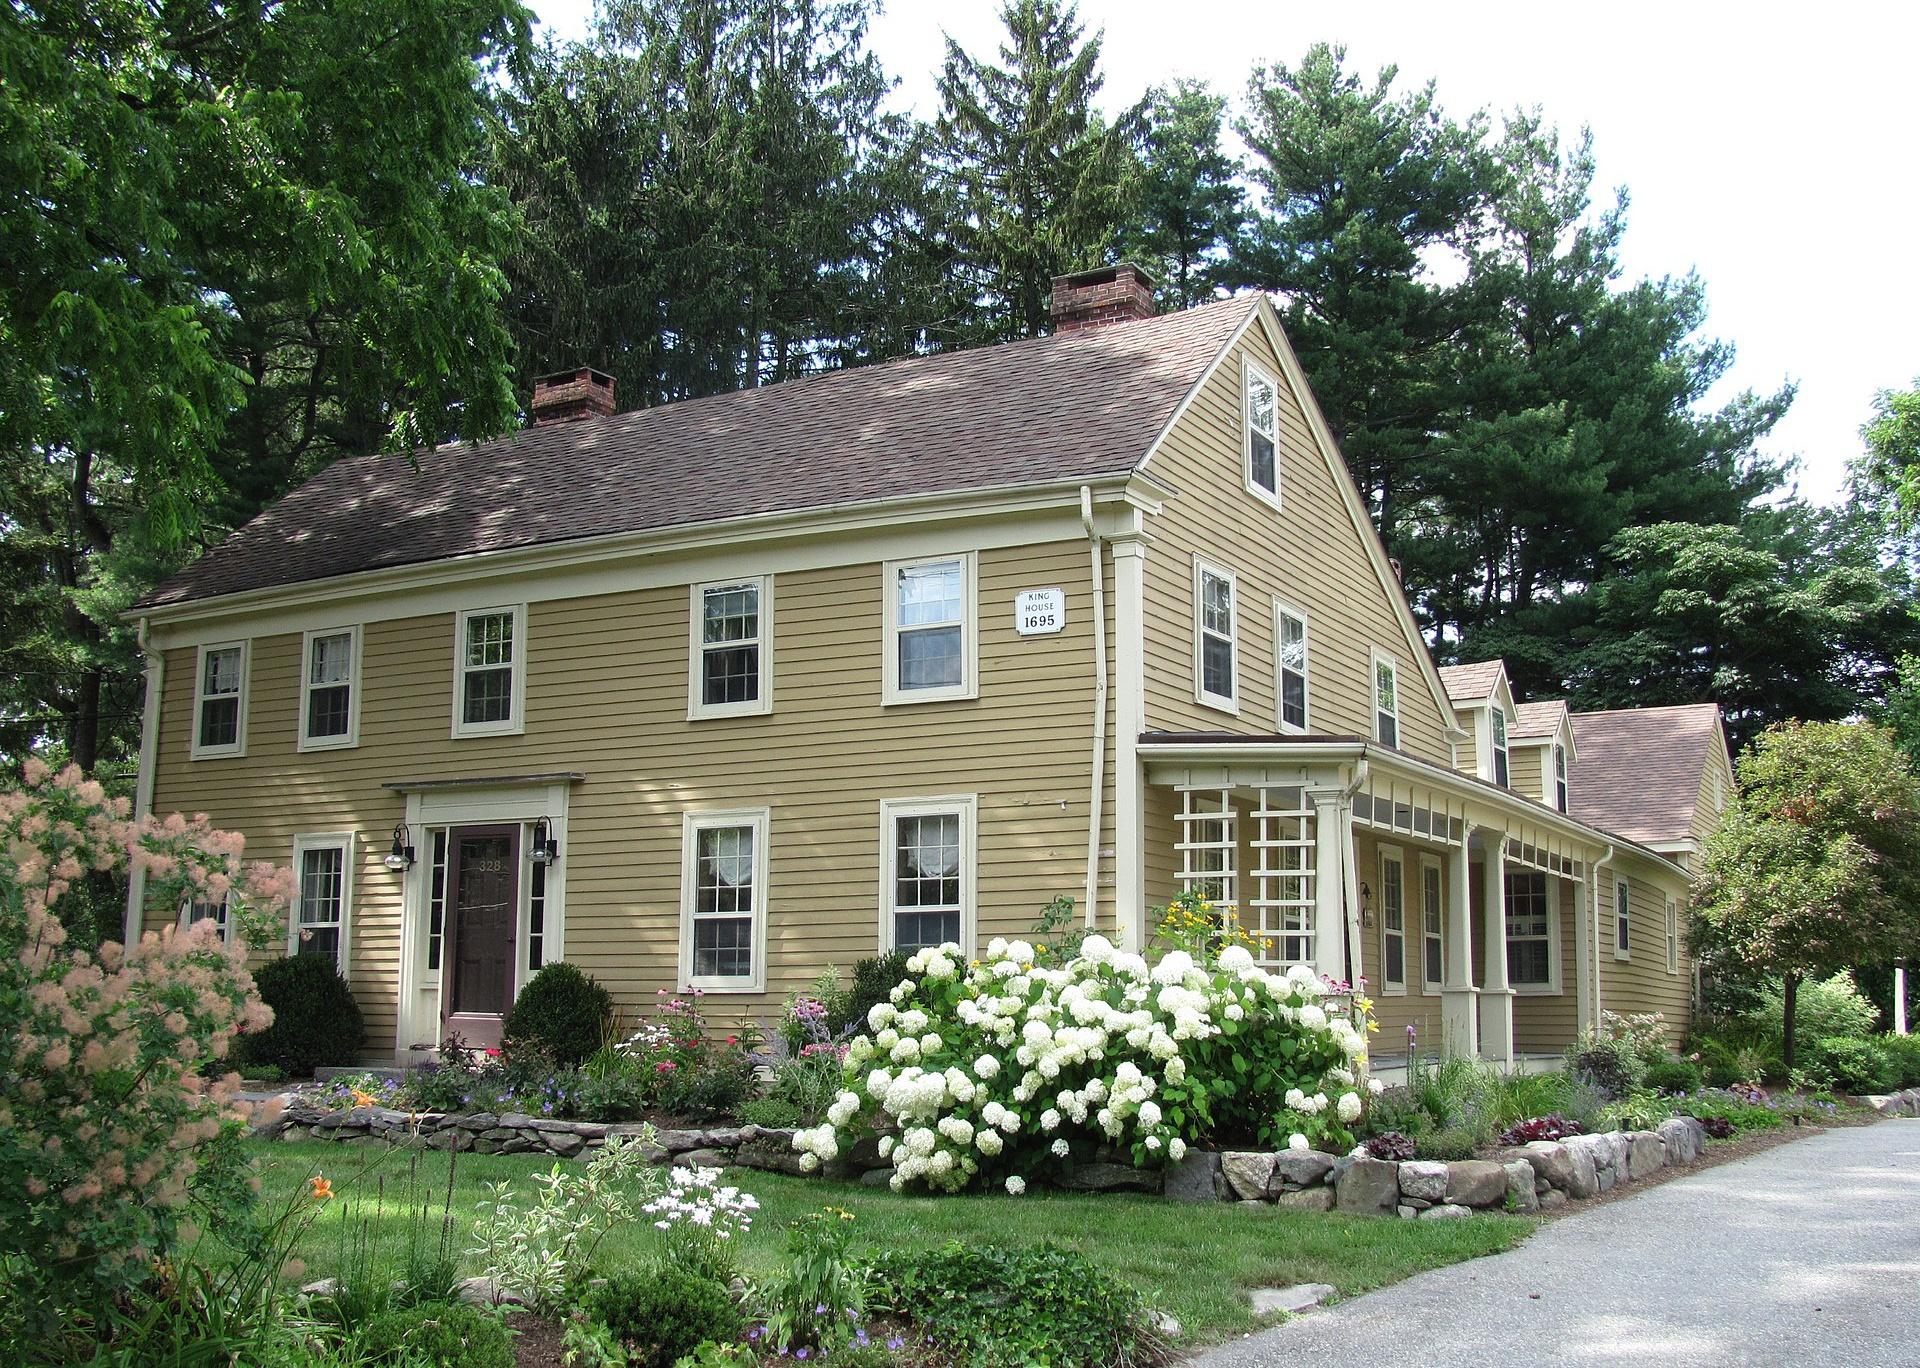
John Phelan // Wikimedia Commons
#26. Oak Hill Park, Massachusetts
The King House, a building on the National Register of Historic Places
– Population: 1,593
– Median household income: $182,402
– Median home value: $822,109
– Median rent: $294
– Percent of people who own a home: 98%
– Area feel: Urban suburban mix
You may also like: Best big cities to live in America
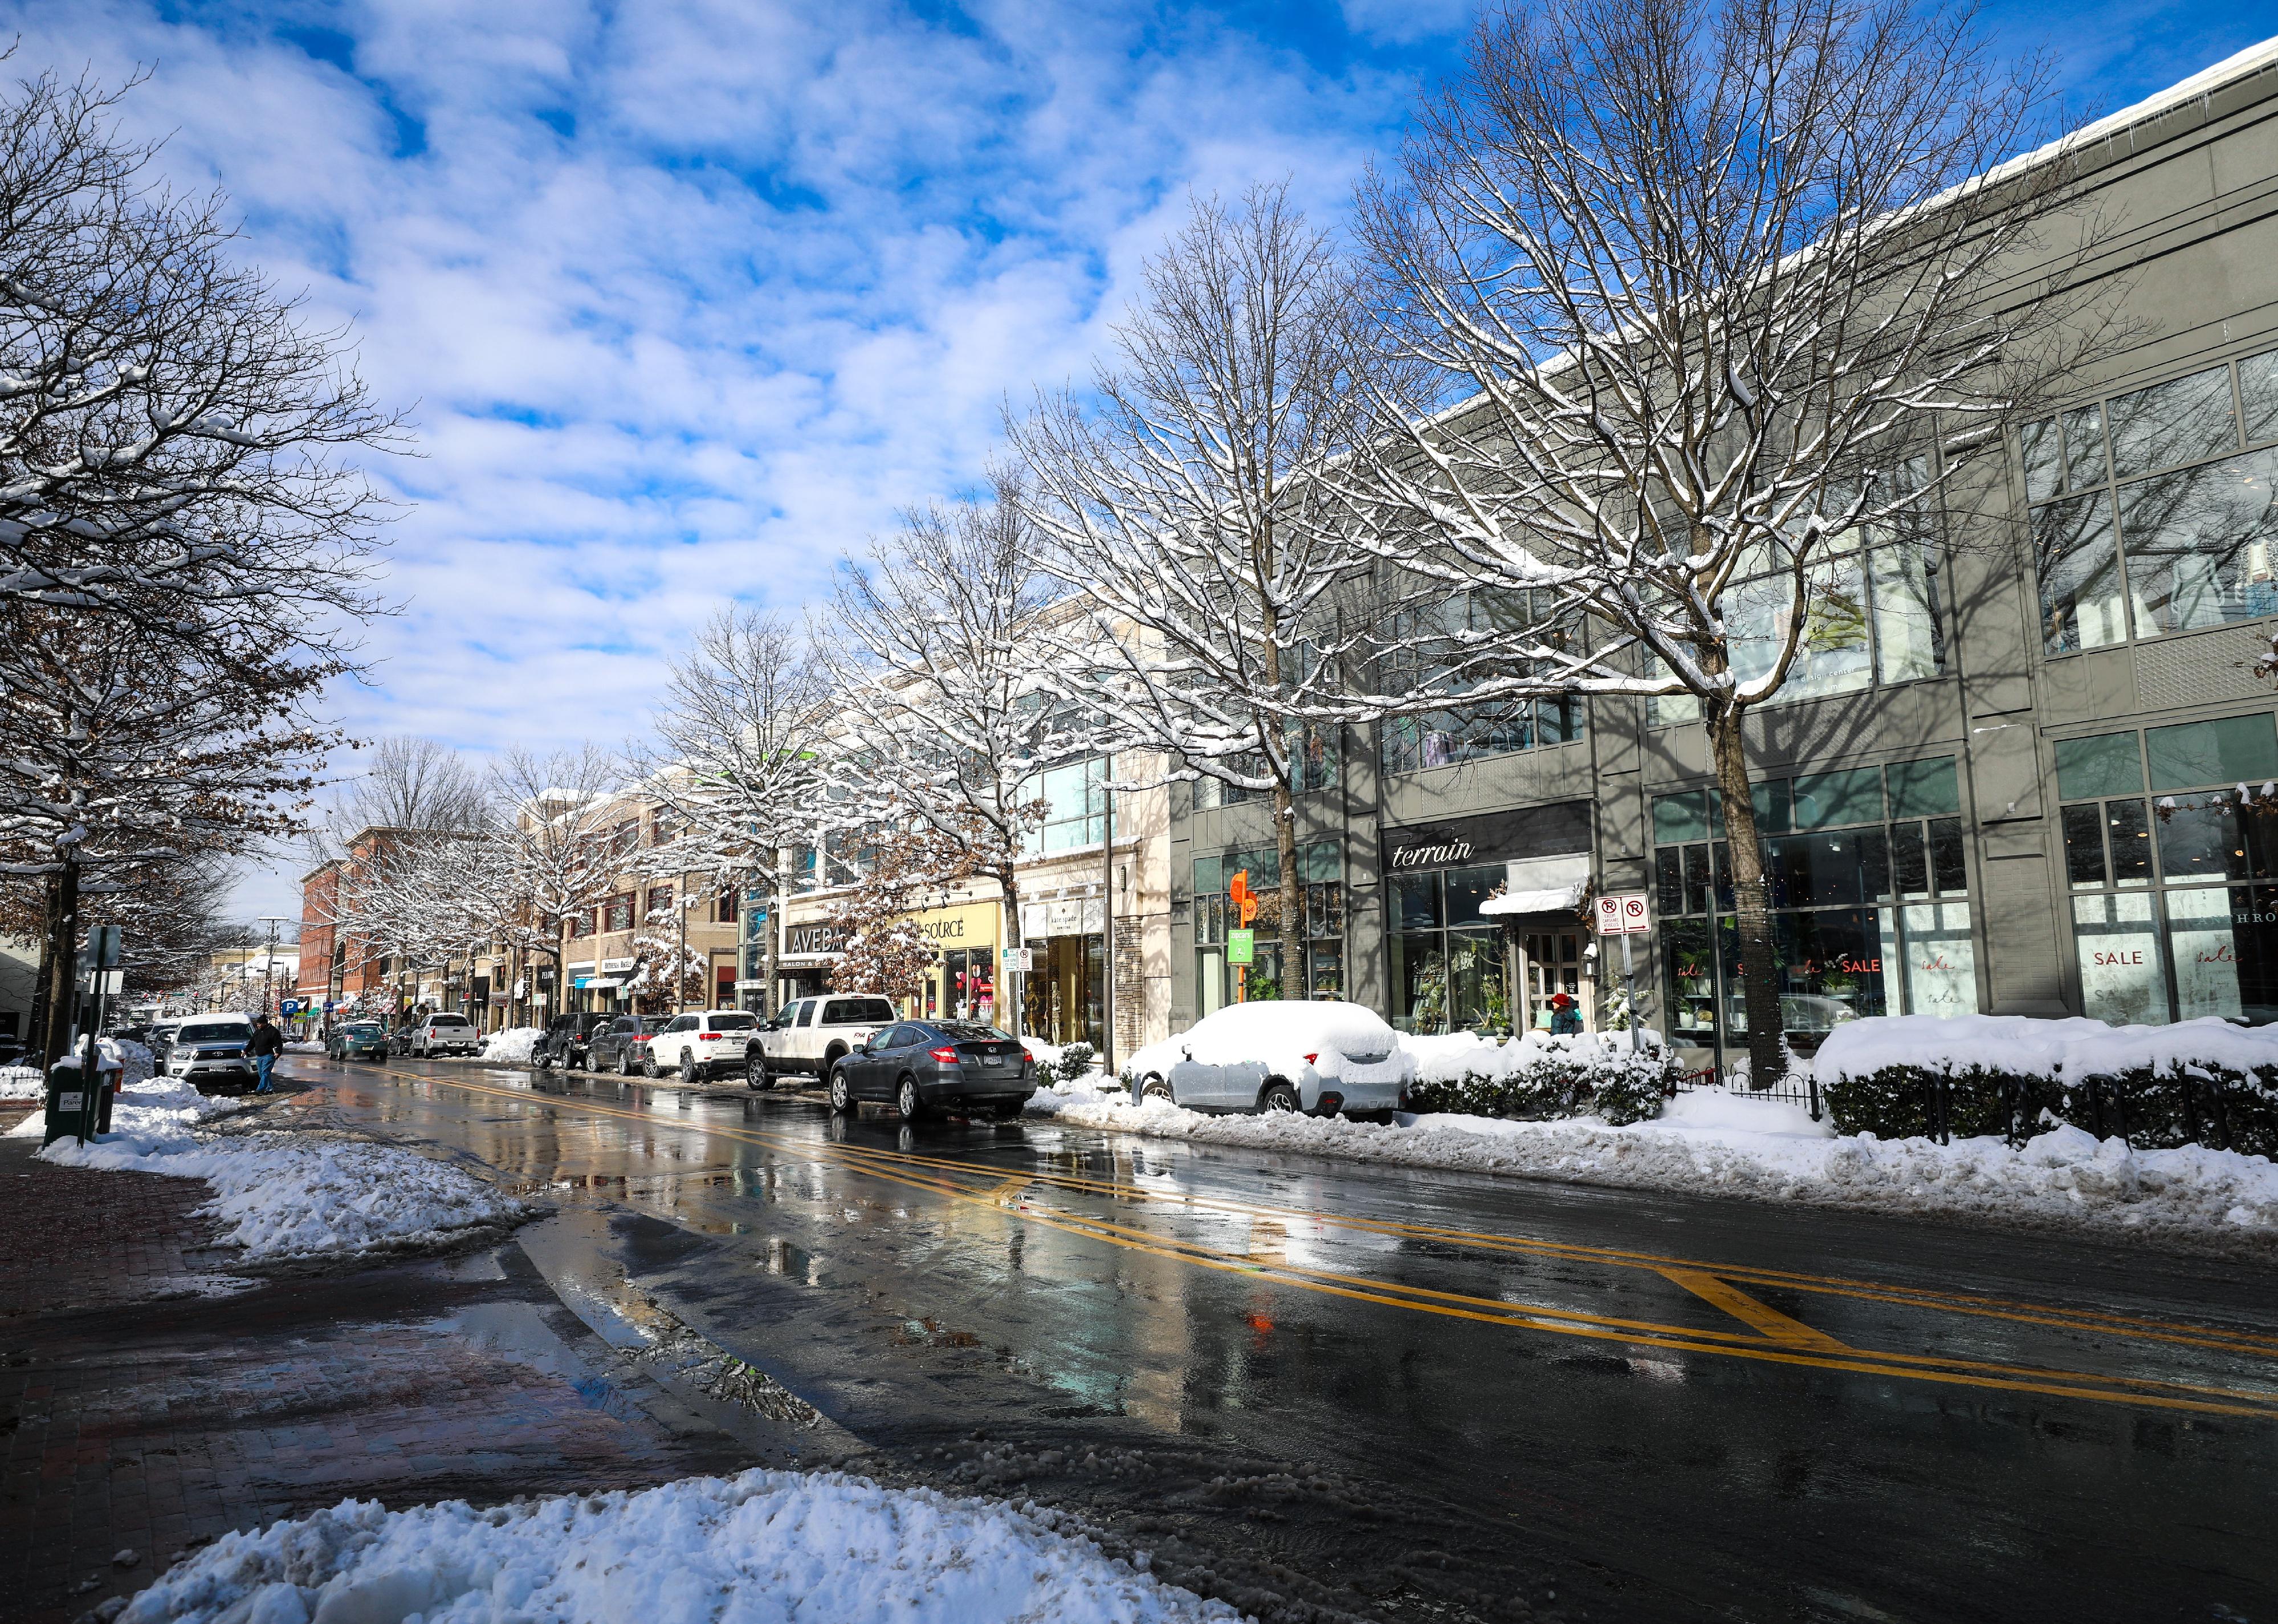
Nicole Glass Photography // Shutterstock
#25. North Bethesda, Maryland
Snow blankets downtown Bethesda
– Population: 49,719
– Median household income: $111,694
– Median home value: $594,100
– Median rent: $1,941
– Percent of people who own a home: 48%
– Area feel: Urban
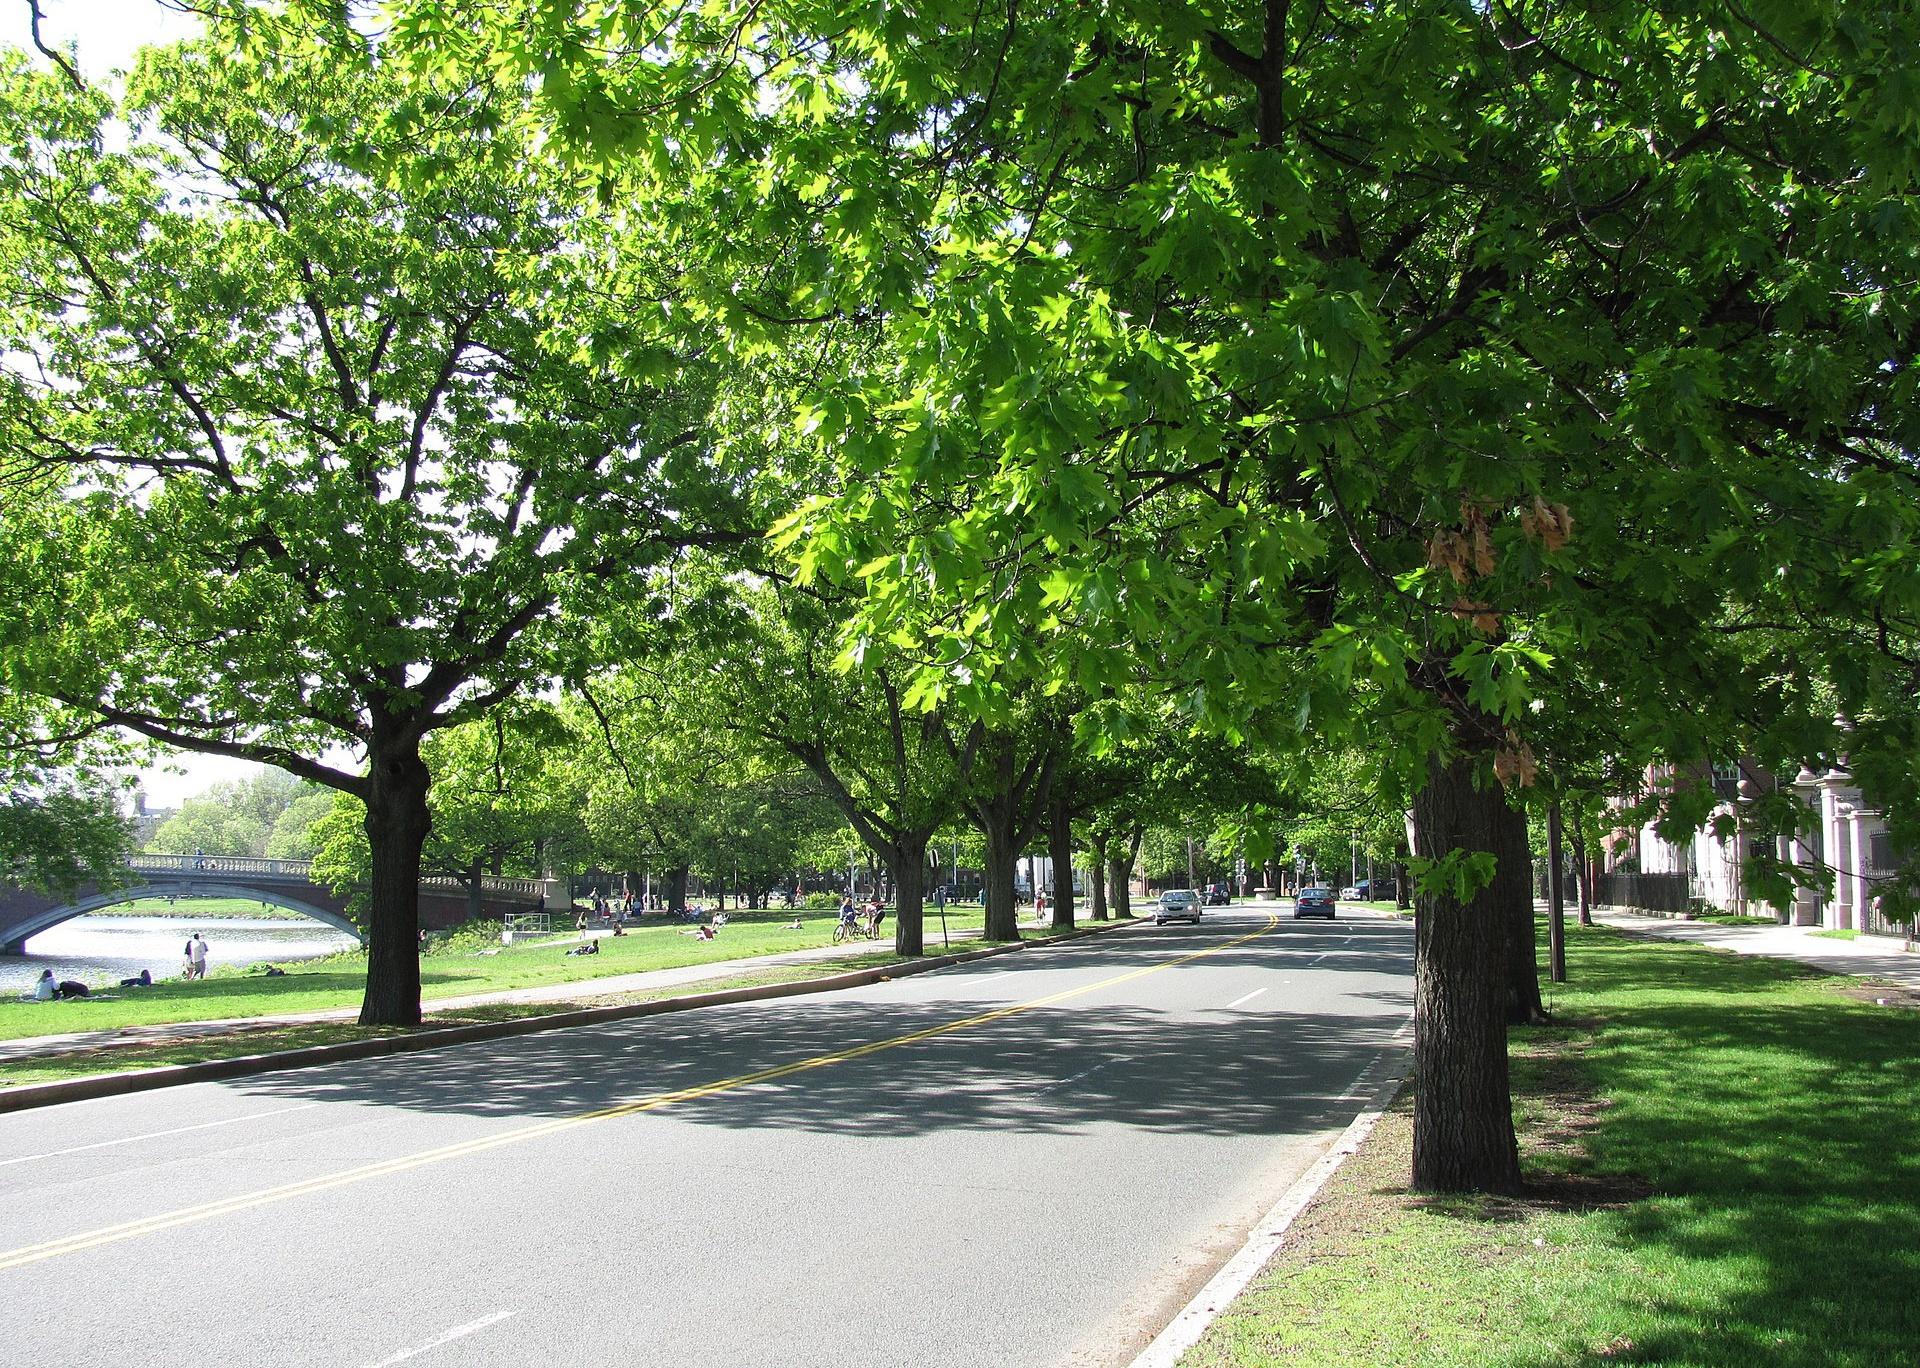
John Phelan // Wikimedia Commons
#24. Riverside, Massachusetts
Memorial Drive, Riverside, Cambridge, MA
– Population: 11,912
– Median household income: $74,363
– Median home value: $1,067,010
– Median rent: $2,099
– Percent of people who own a home: 30%
– Area feel: Dense urban
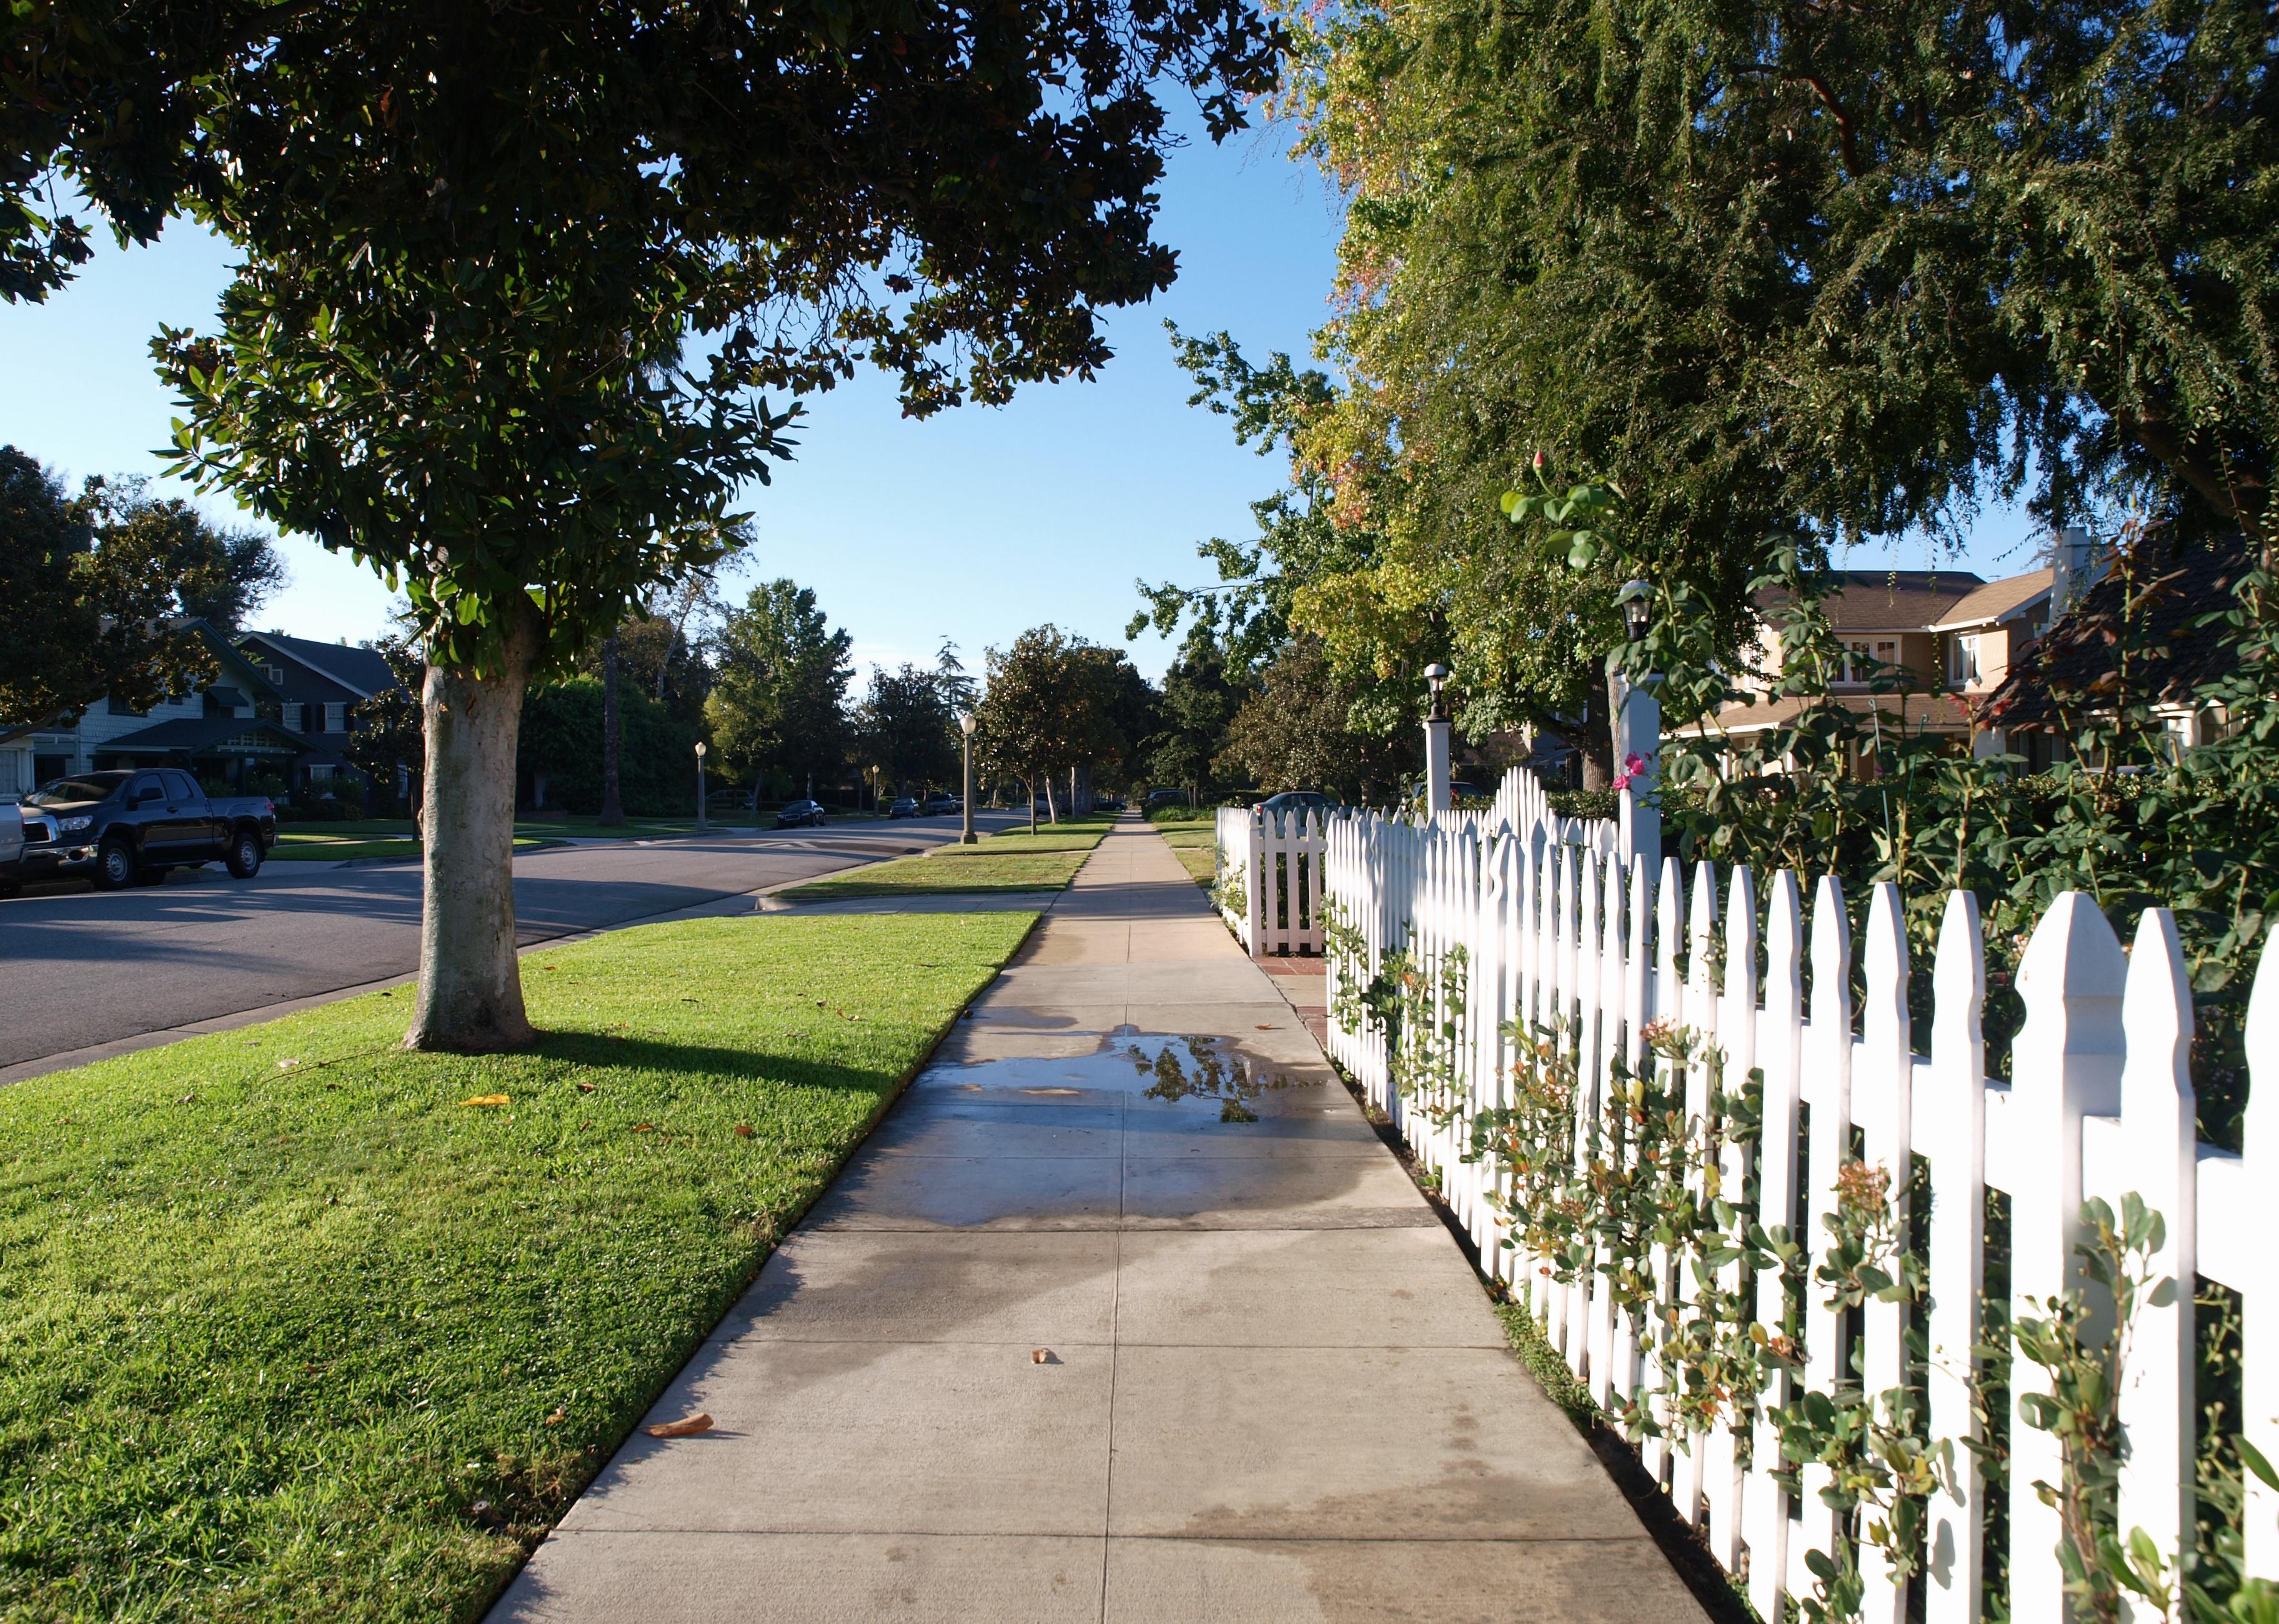
trekandshoot // Shutterstock
#23. College Terrace, California
Picket fence on a pretty residential street
– Population: 1,559
– Median household income: $130,770
– Median home value: $2,000,001
– Median rent: $2,539
– Percent of people who own a home: 45%
– Area feel: Urban suburban mix
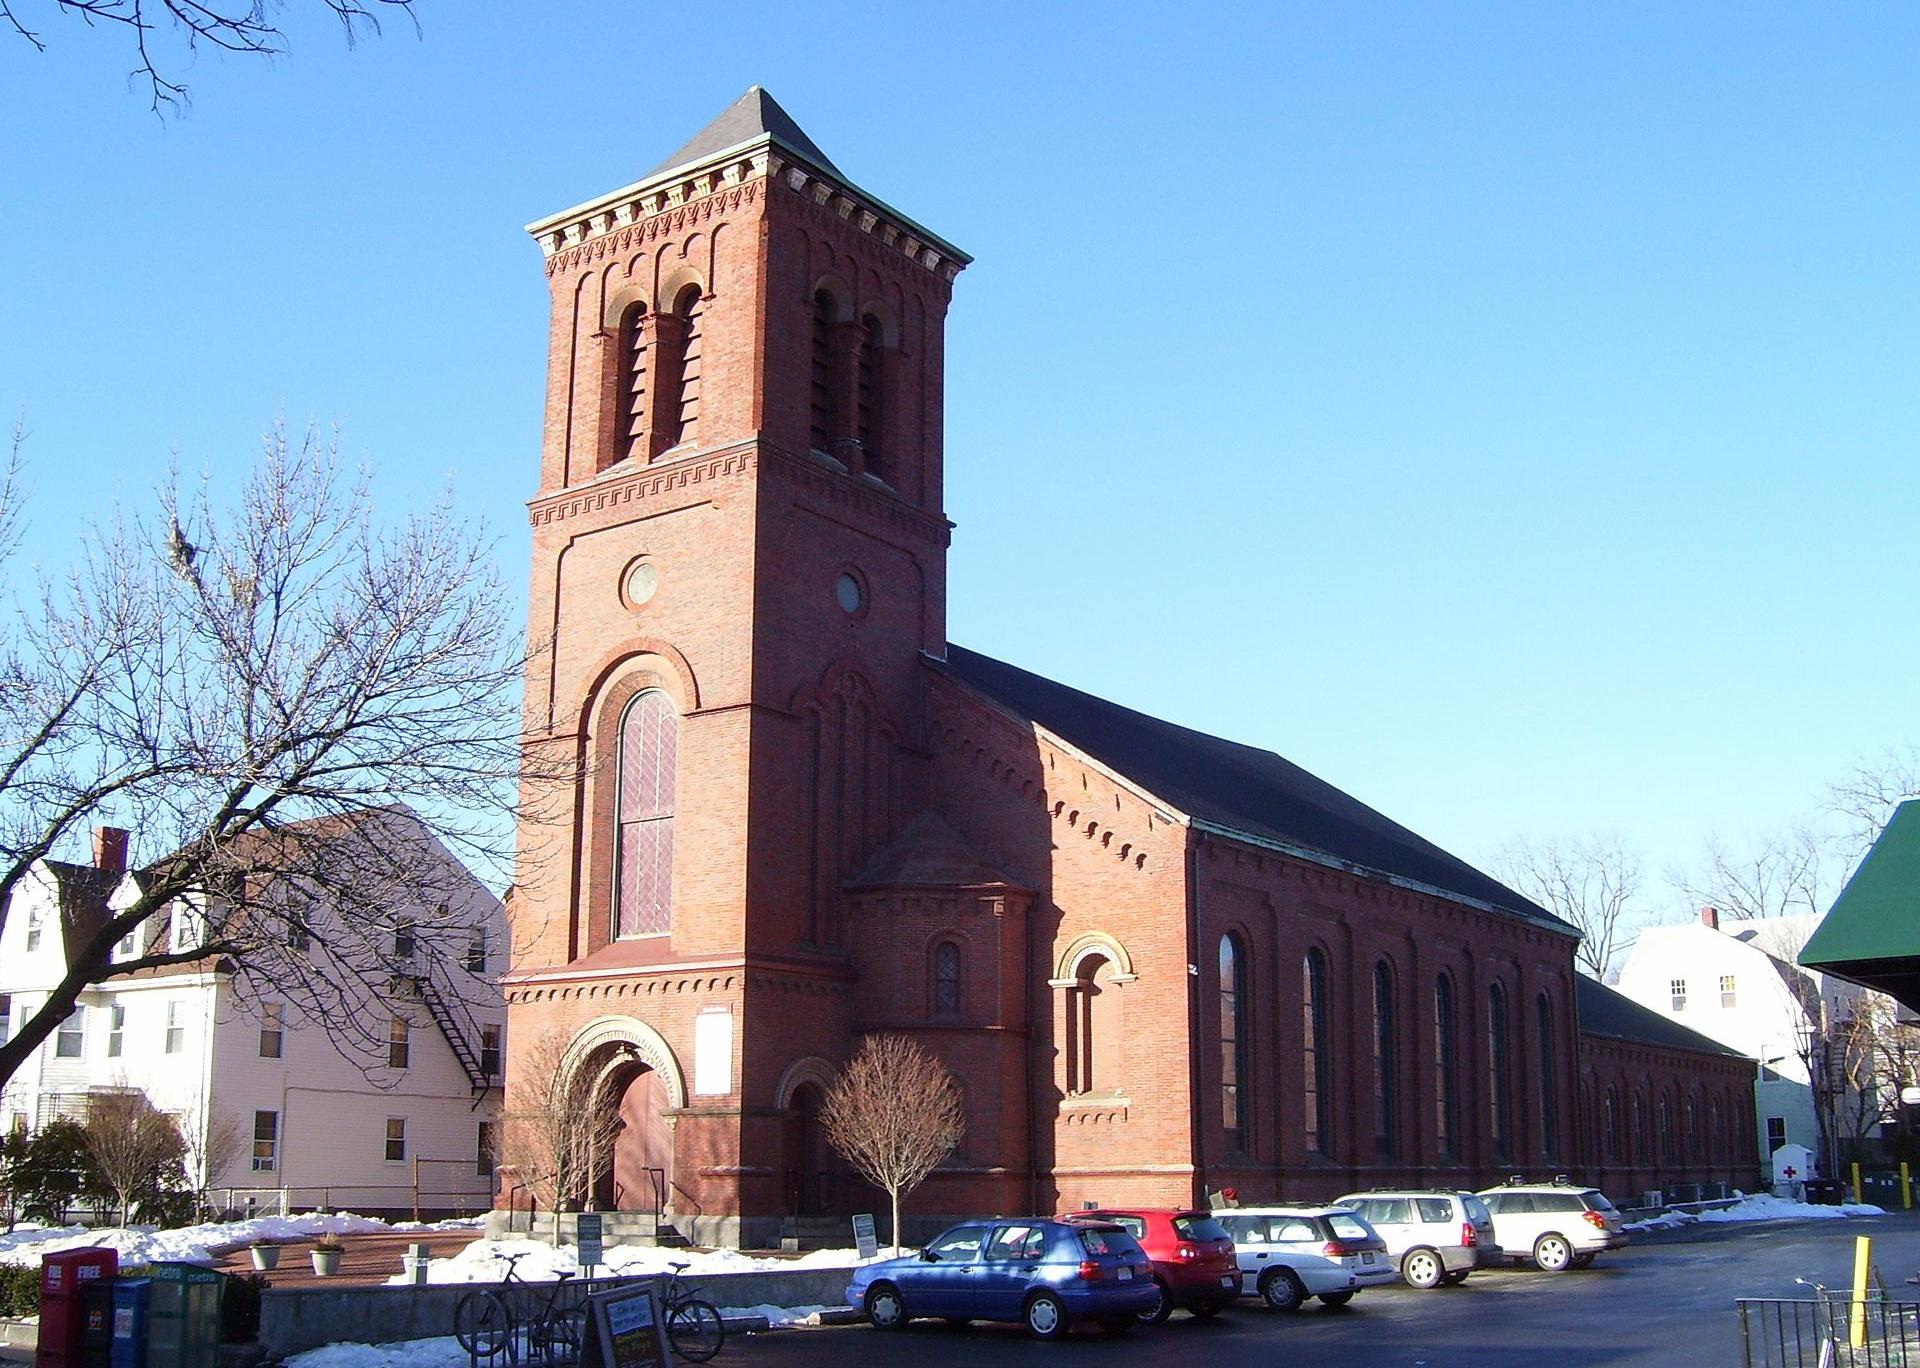
Wangkun Jia // Shutterstock
#22. East Cambridge, Massachusetts
St. Francis of Assisi Church in East Cambridge, Massachusetts
– Population: 11,554
– Median household income: $104,221
– Median home value: $800,979
– Median rent: $2,485
– Percent of people who own a home: 27%
– Area feel: Dense urban
Swampyank // Wikimedia Commons
#21. Mid-Cambridge, Massachusetts
Christ the King Presbyterian Church in Cambridge, Massachusetts
– Population: 14,088
– Median household income: $107,122
– Median home value: $854,840
– Median rent: $2,316
– Percent of people who own a home: 37%
– Area feel: Dense urban
You may also like: Best small towns to live in across America
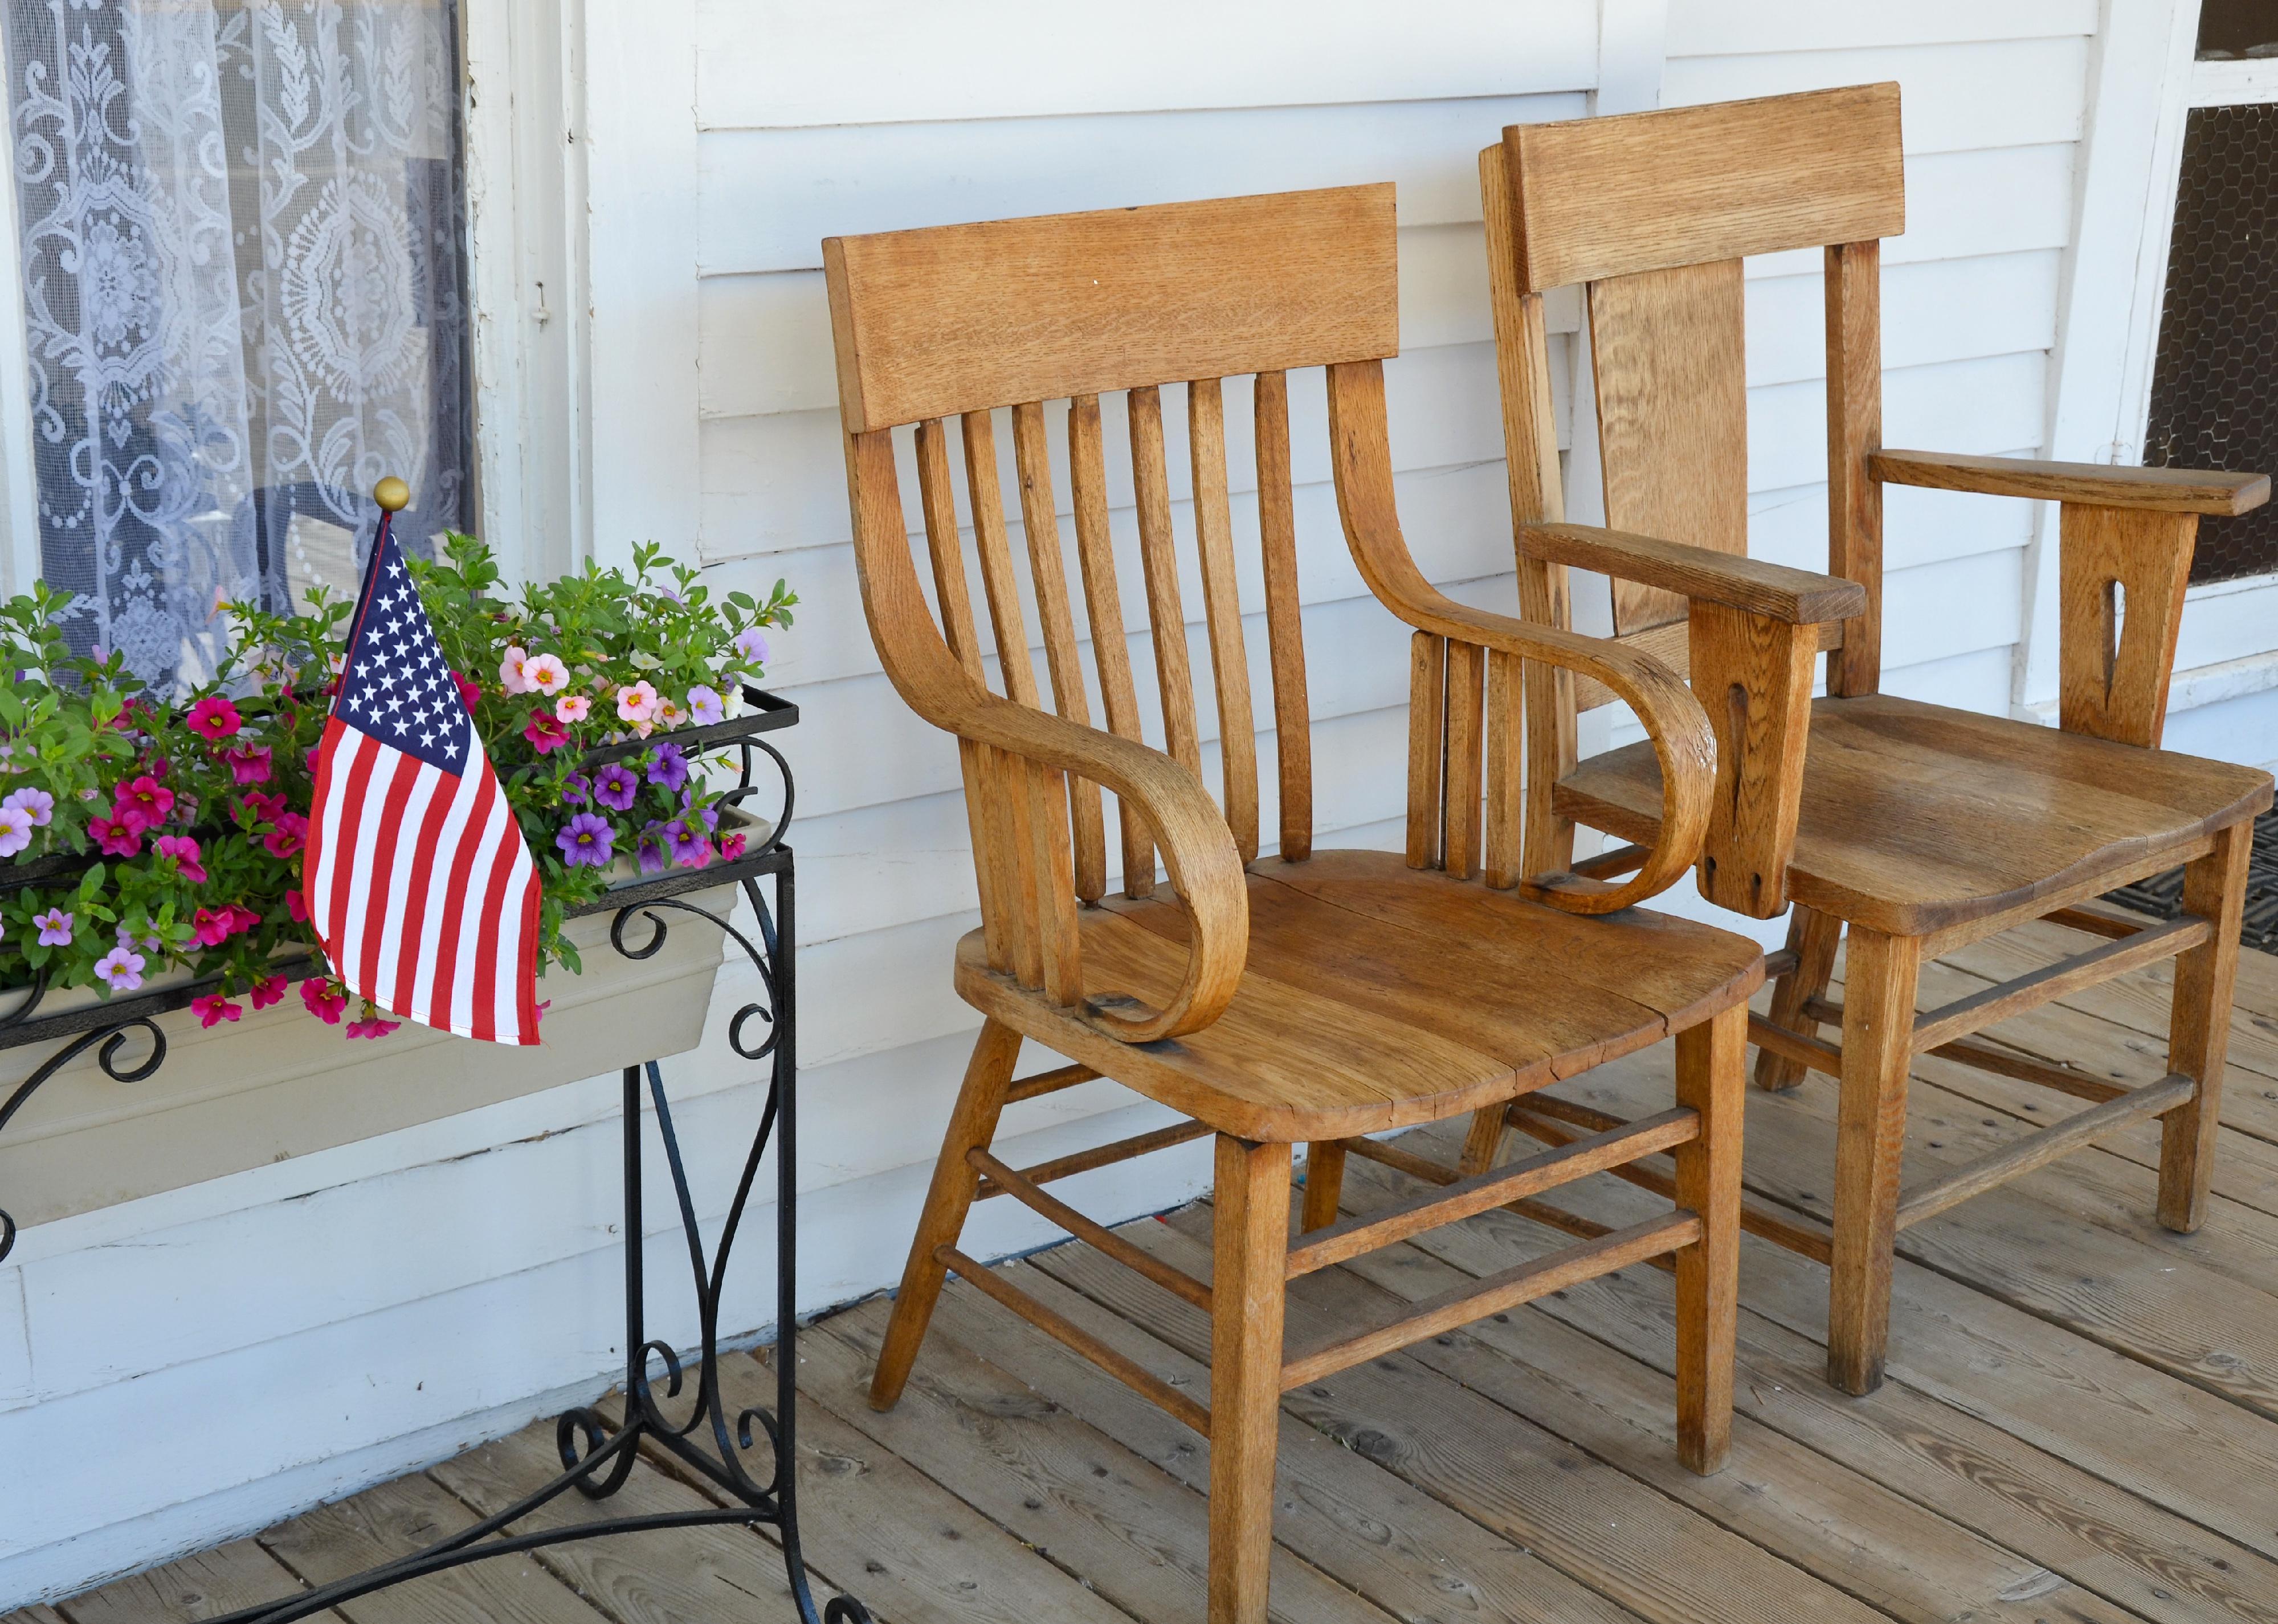
perlphoto // Shutterstock
#20. Ballston/Virginia Square, Virginia
Two wooden chairs on old front porch
– Population: 13,929
– Median household income: $129,532
– Median home value: $561,254
– Median rent: $2,290
– Percent of people who own a home: 28%
– Area feel: null
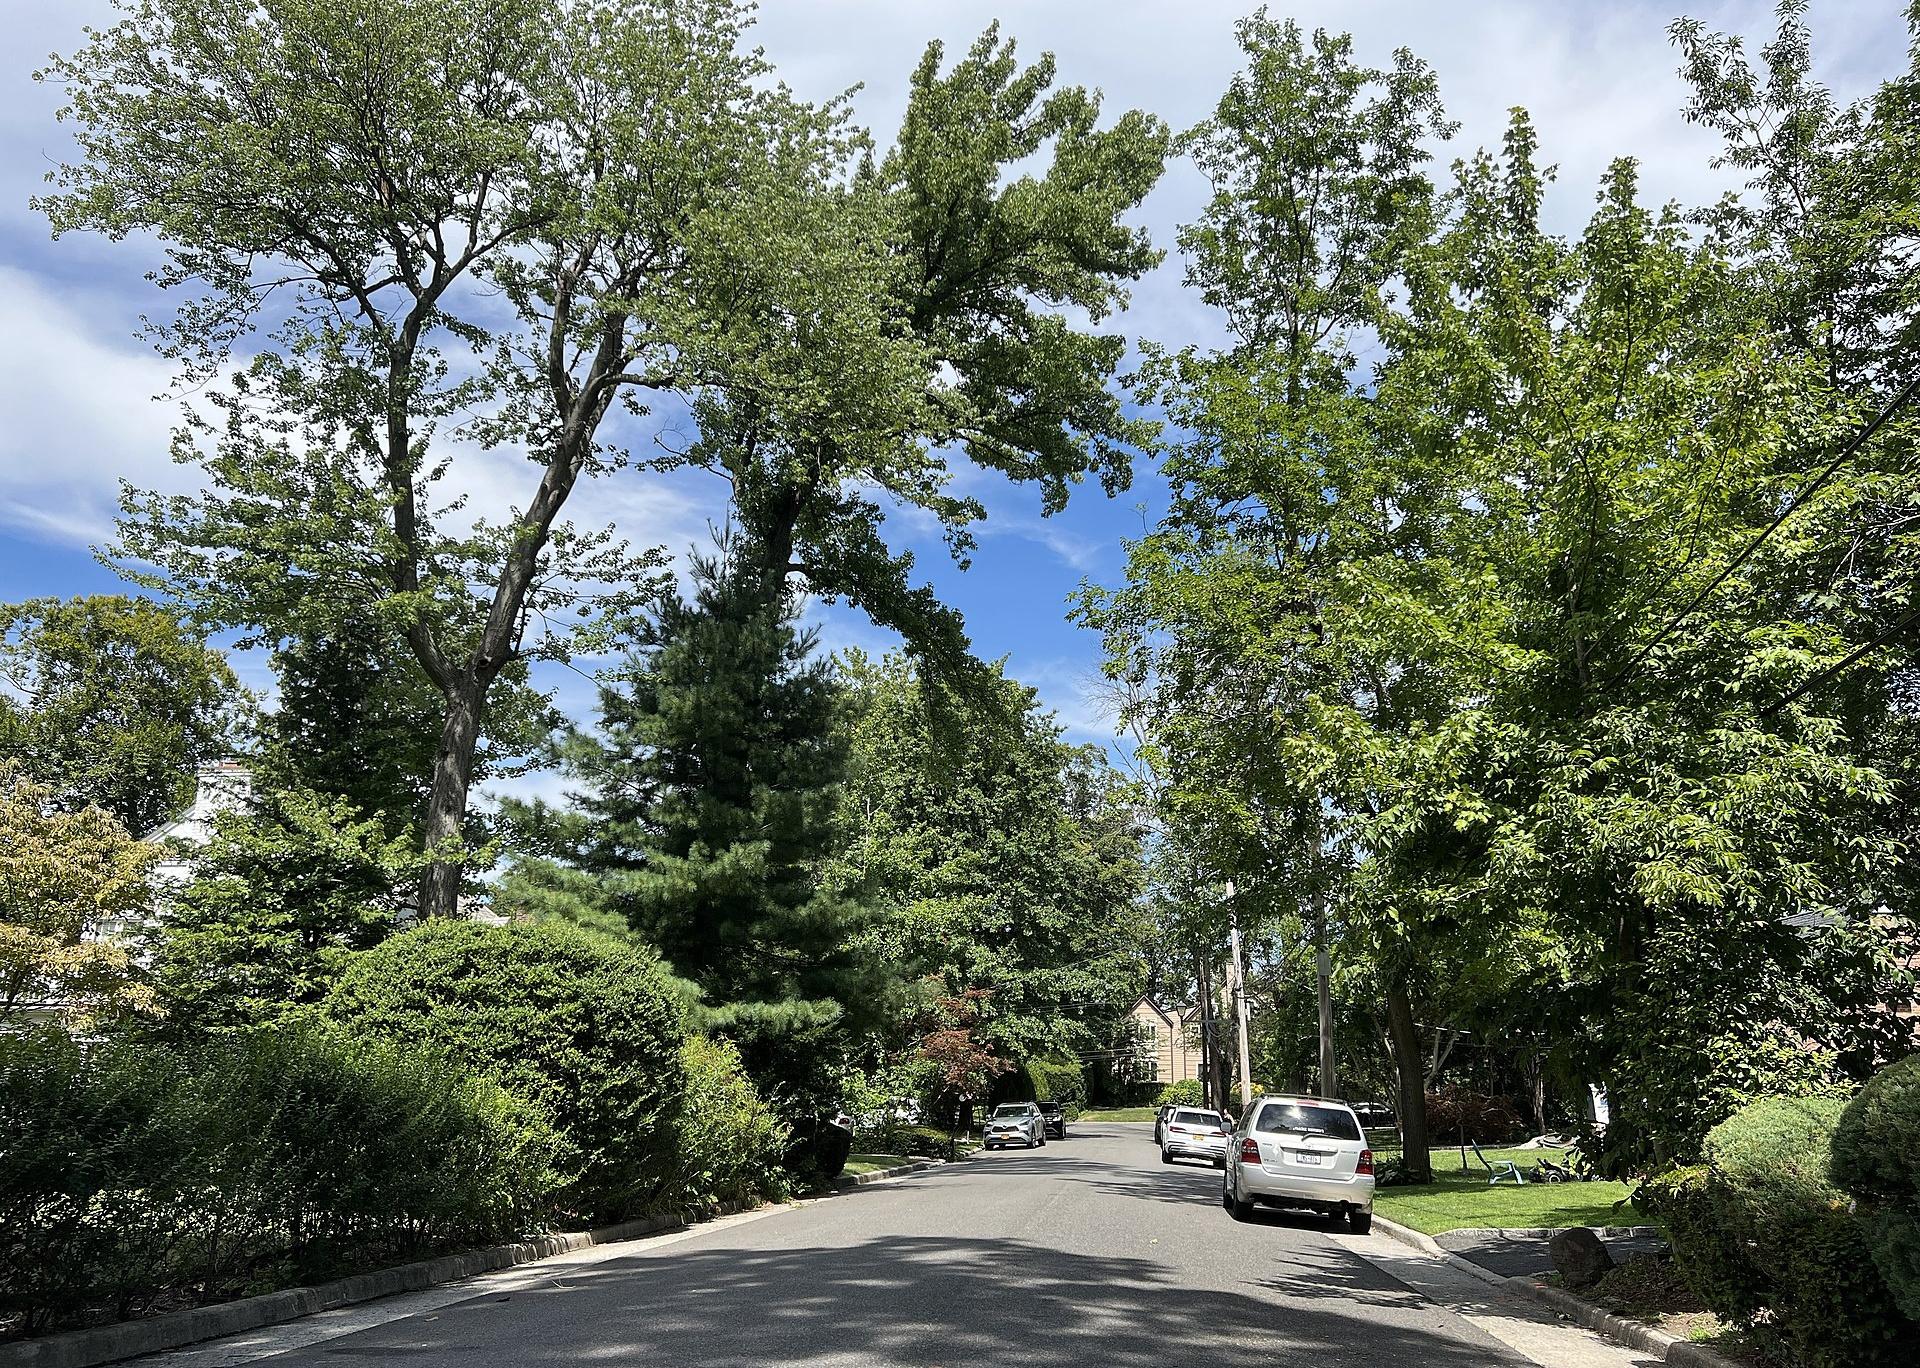
Sheila Fitzgerald // Shutterstock
#19. Macalester-Groveland, Minnesota
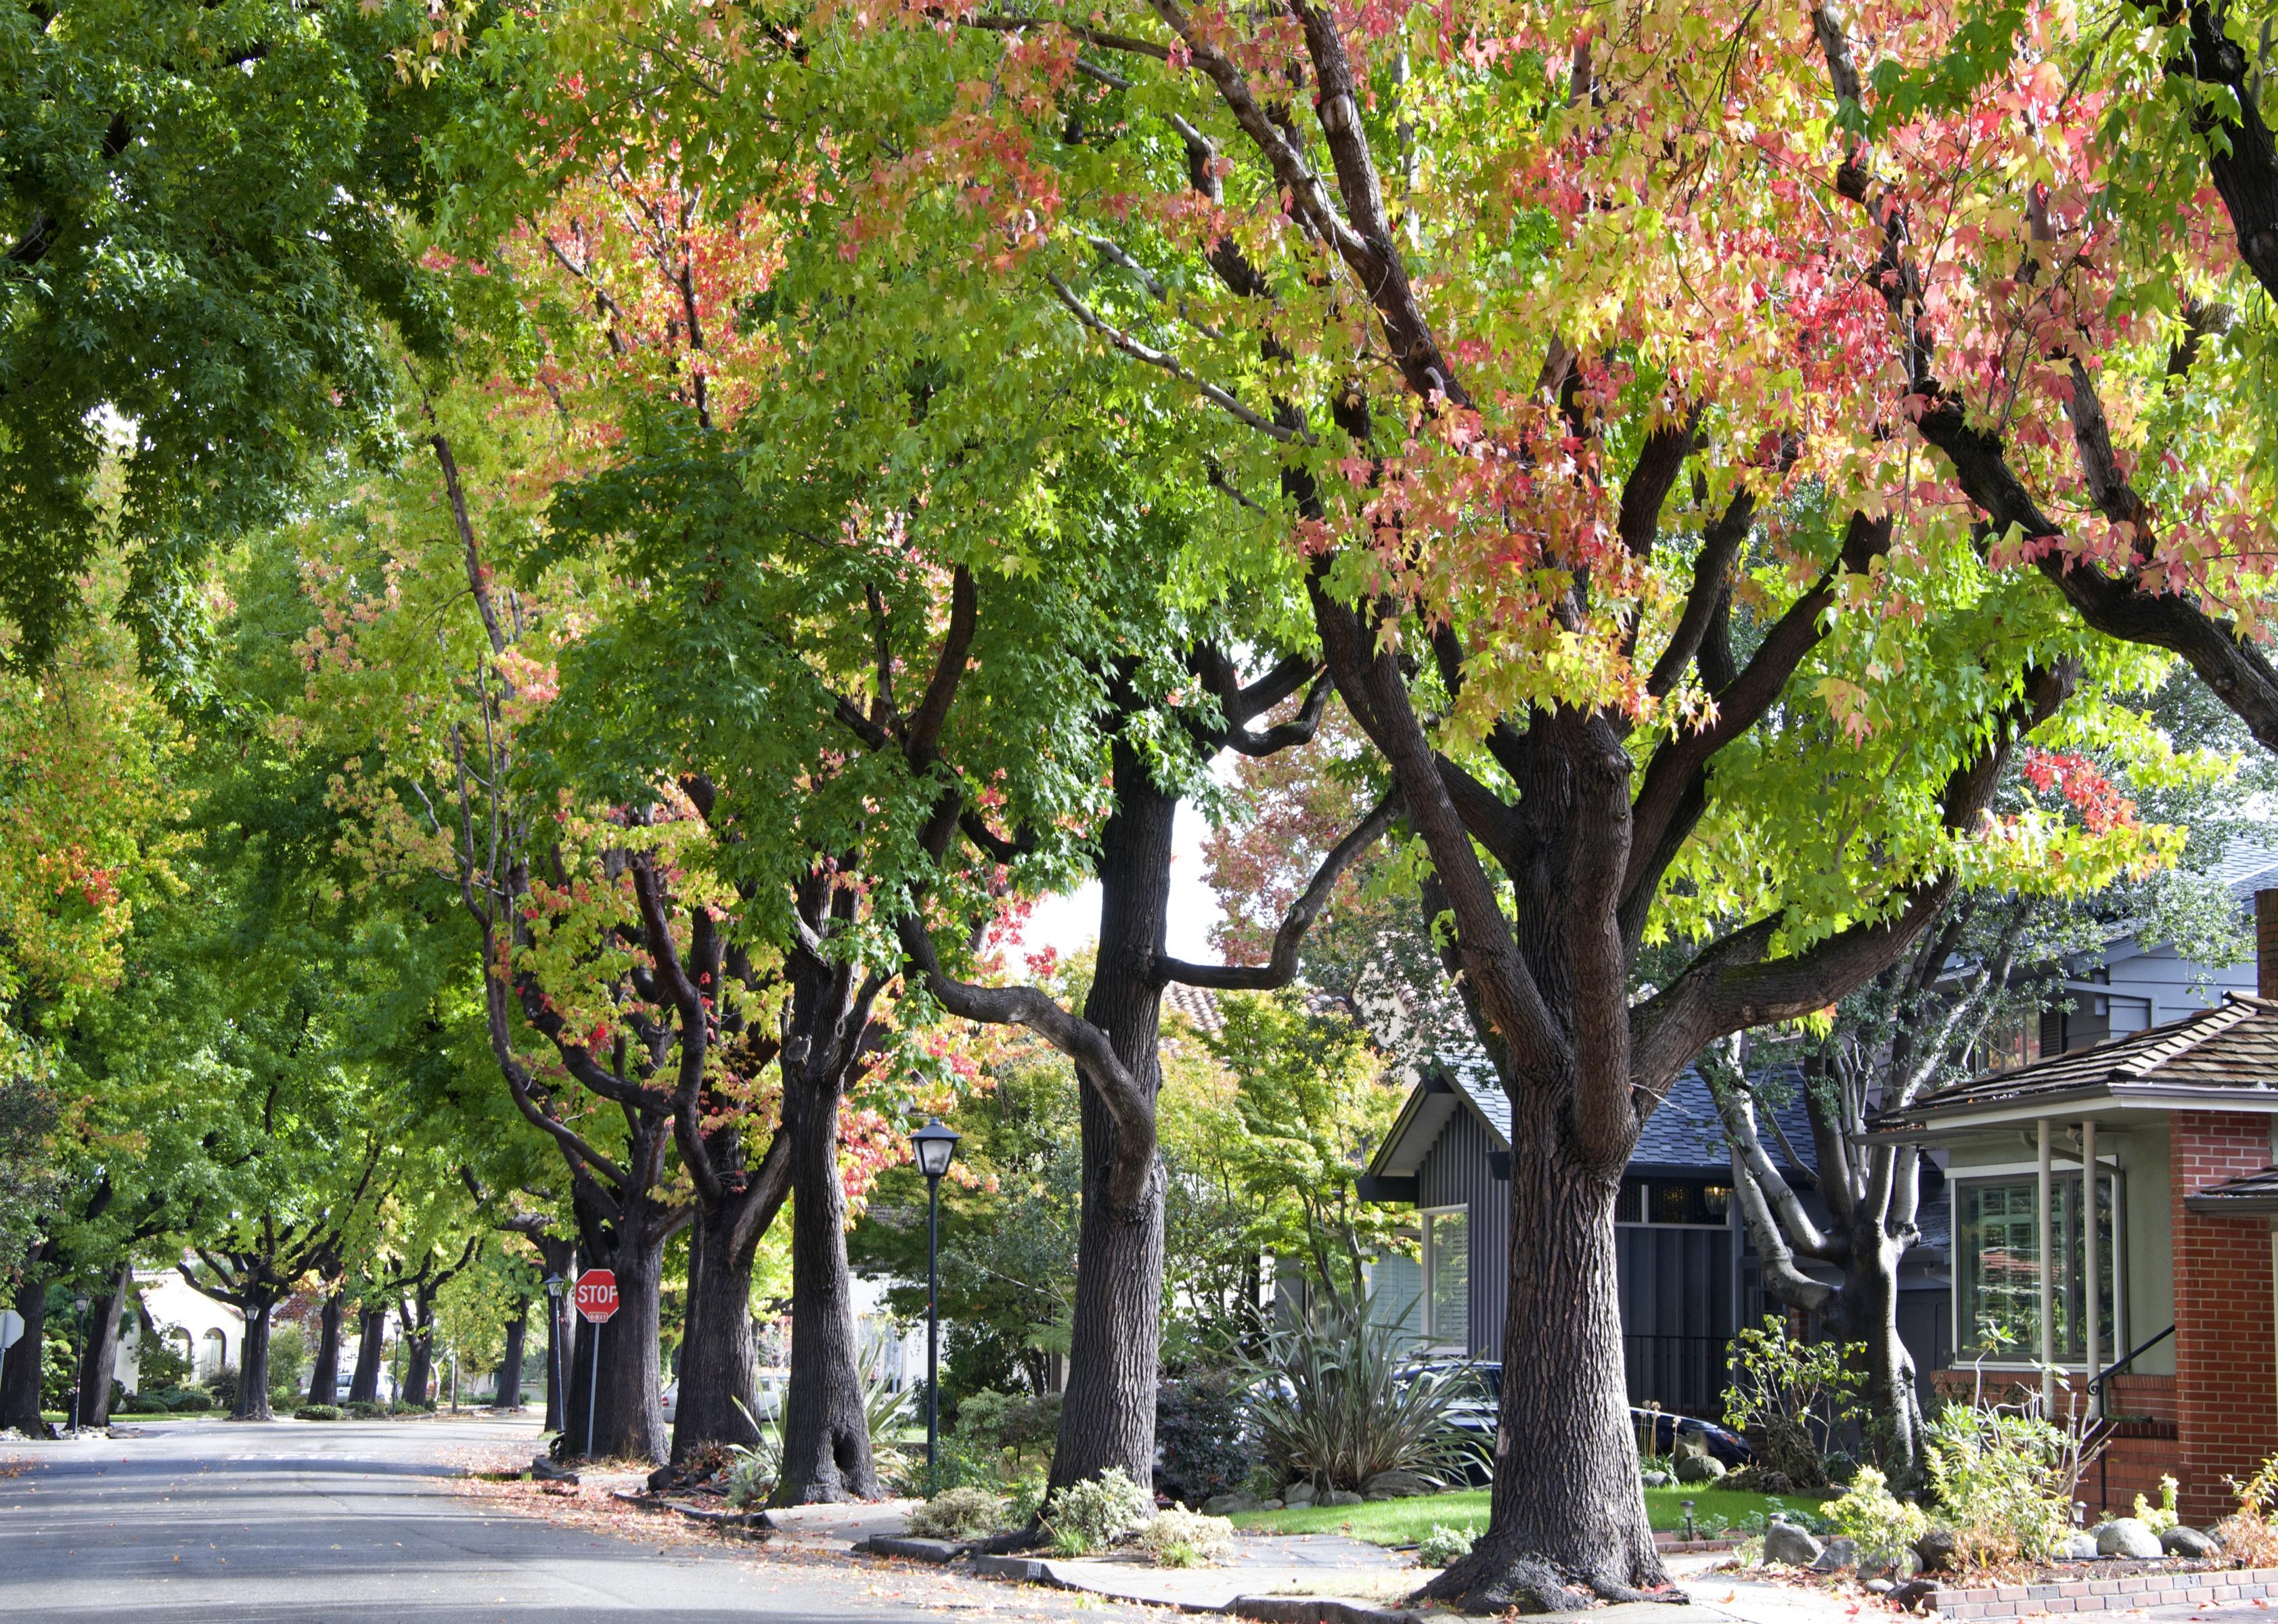
Trees lining a residential street
– Population: 18,951
– Median household income: $95,948
– Median home value: $382,714
– Median rent: $1,072
– Percent of people who own a home: 71%
– Area feel: Dense suburban
Wangkun Jia // Shutterstock
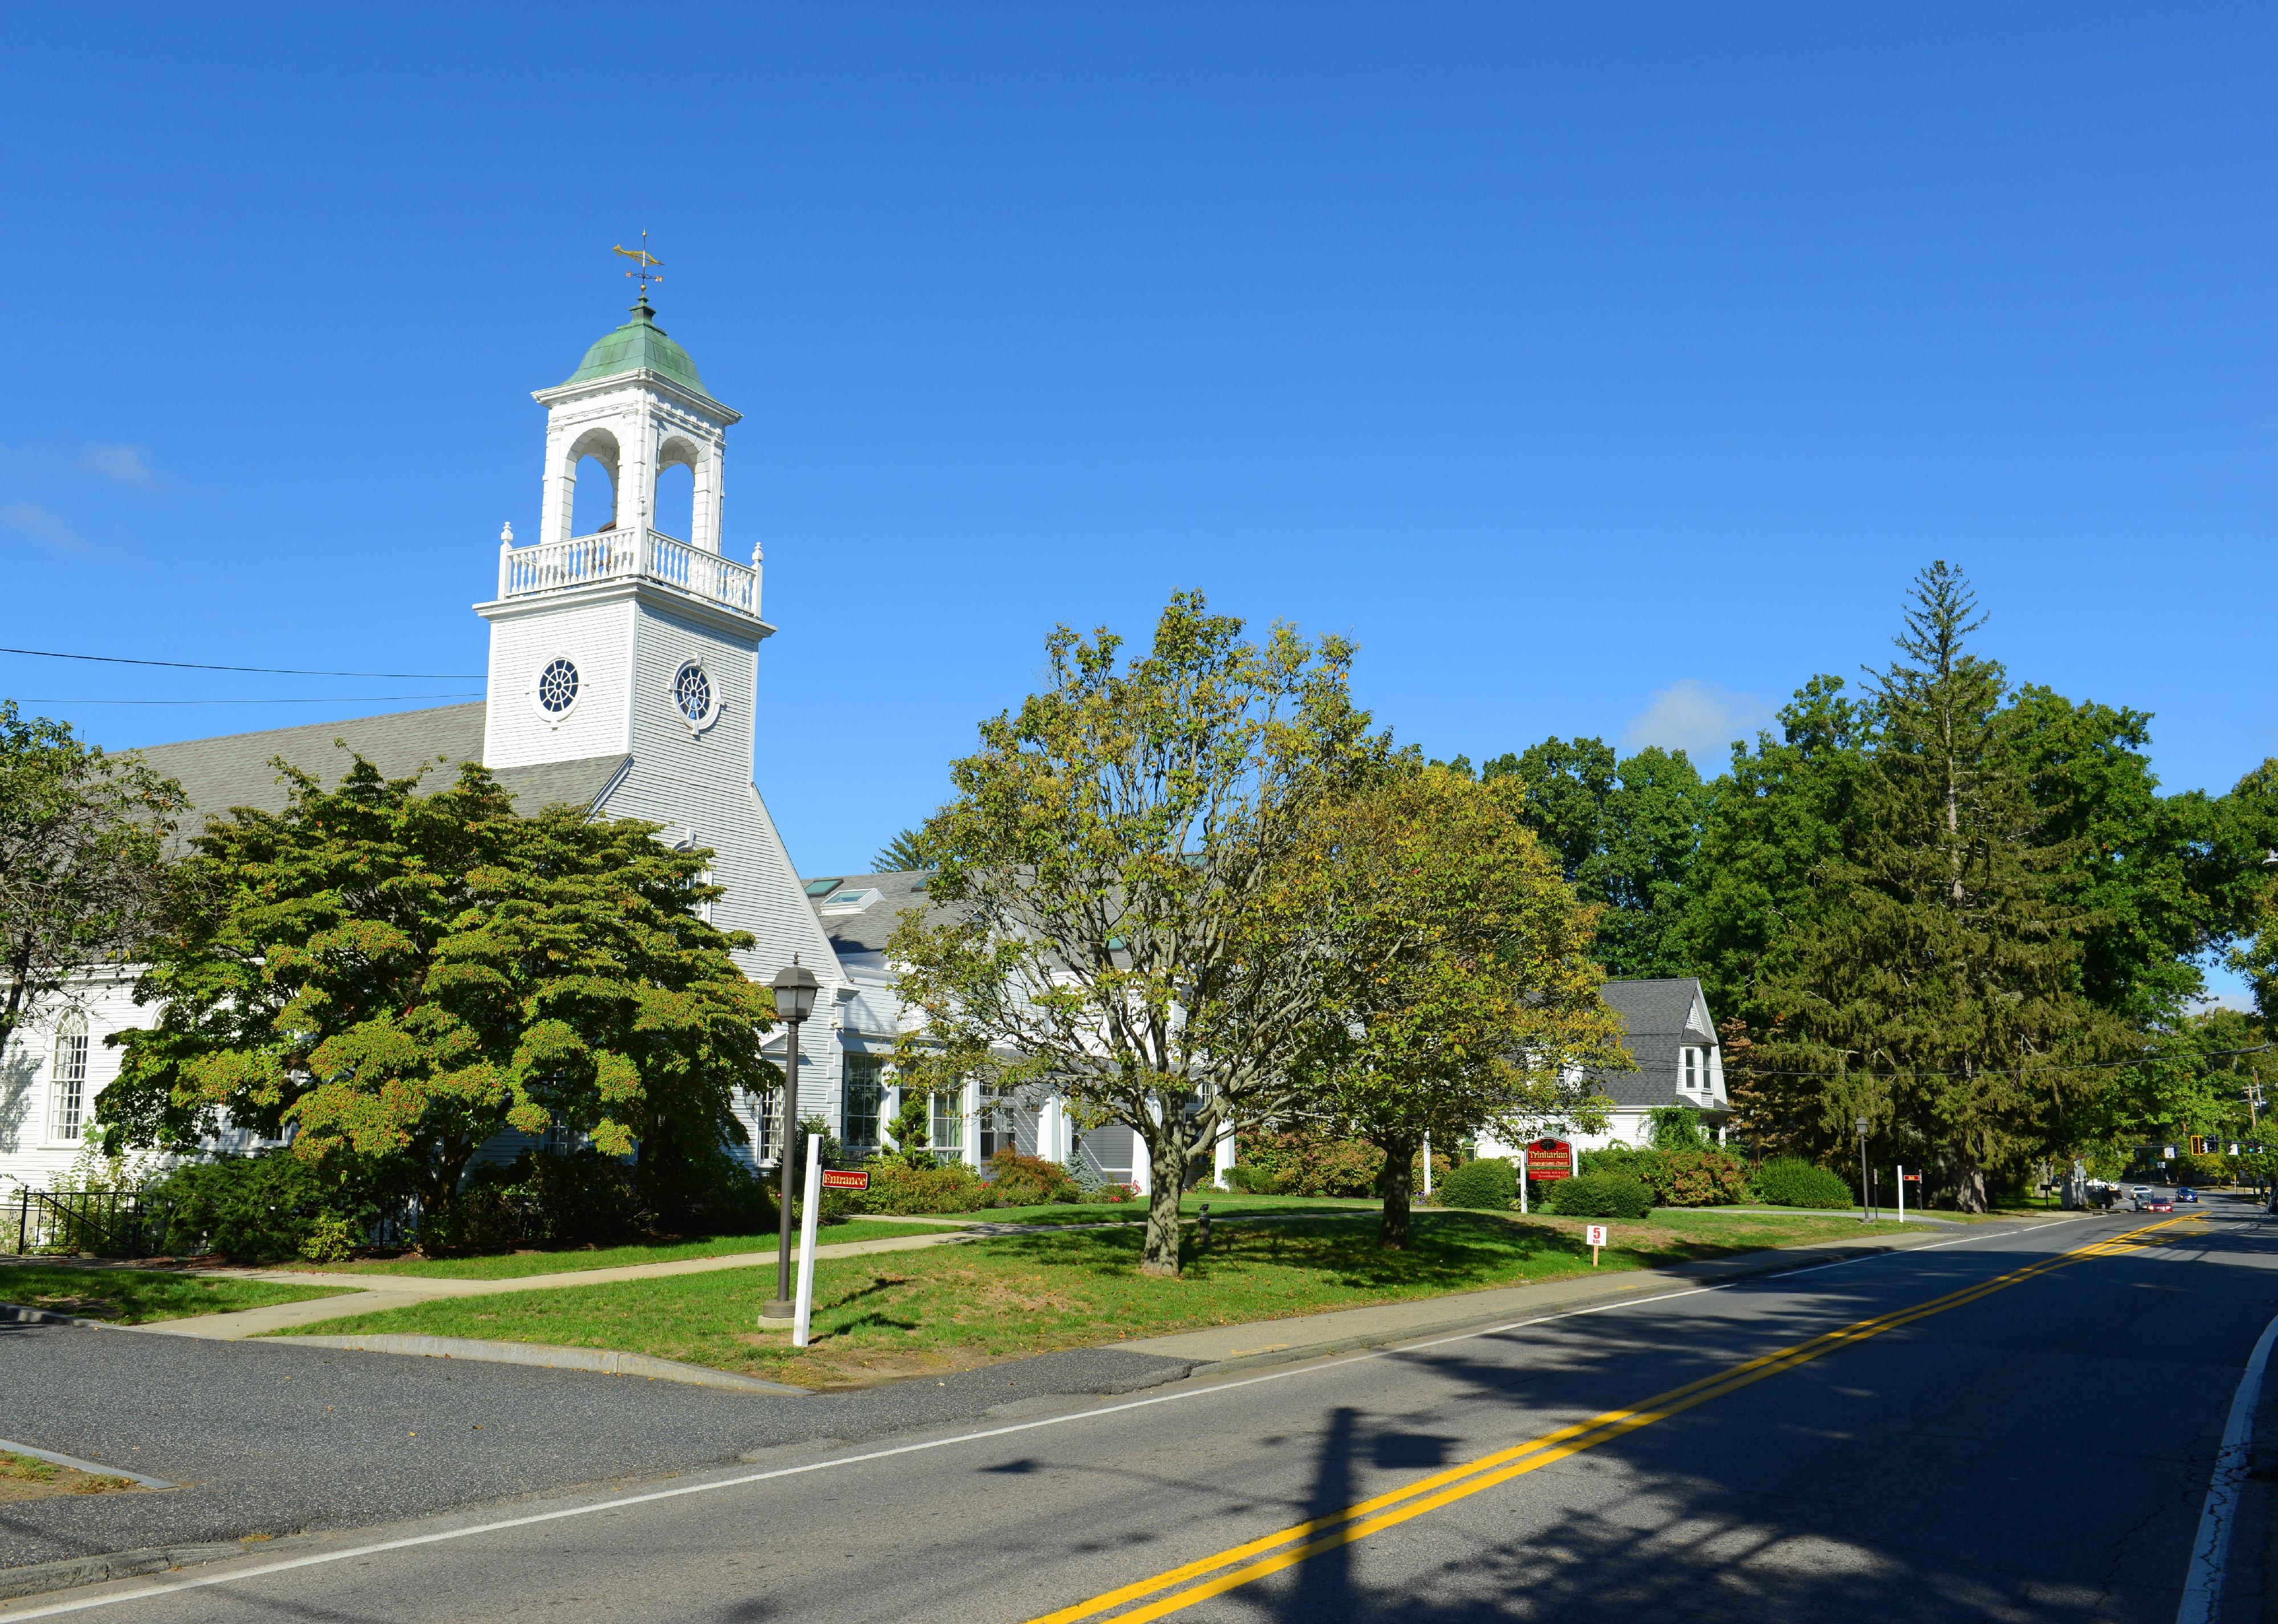
#18. Wayland, Massachusetts
Trinitarian Congregational Church in historic town center of Wayland, Massachusetts
– Population: 13,823
– Median household income: $192,632
– Median home value: $733,300
– Median rent: $1,263
– Percent of people who own a home: 91%
– Area feel: Sparse suburban
Diego Grandi // Shutterstock
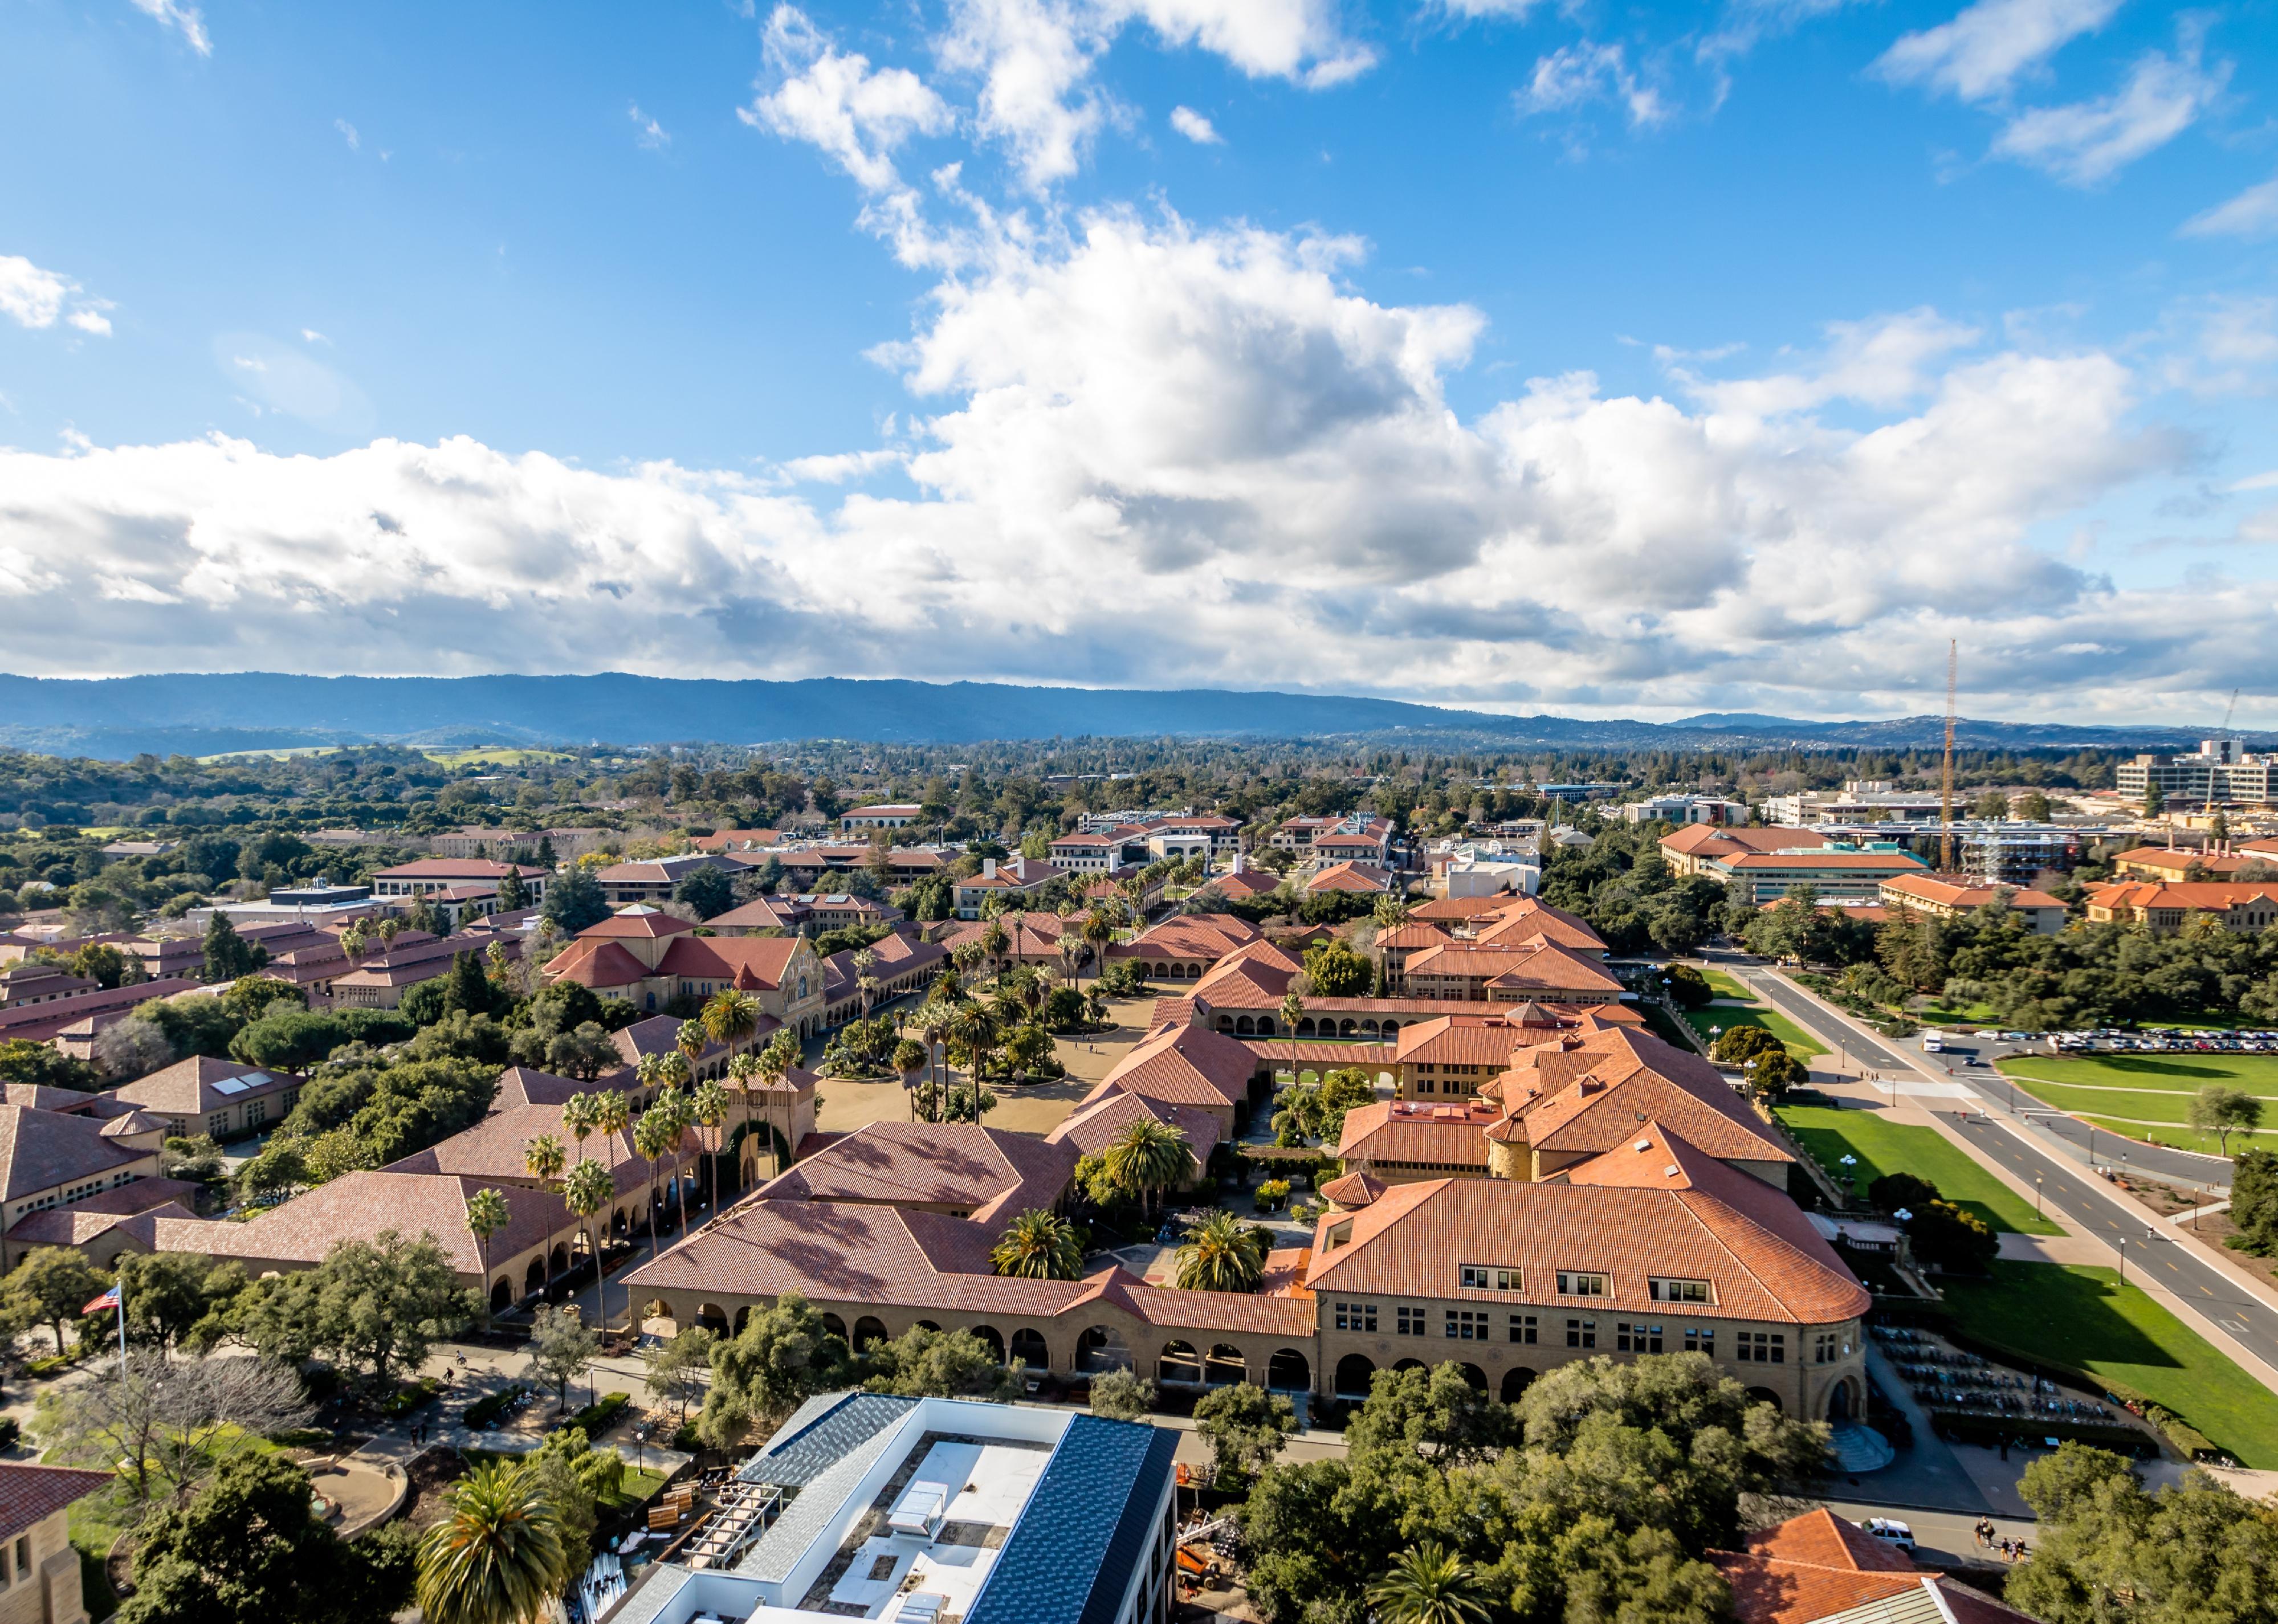
#17. Old Palo Alto, California
Aerial view of Stanford University Campus
– Population: 3,525
– Median household income: $248,610
– Median home value: $1,994,073
– Median rent: $2,850
– Percent of people who own a home: 77%
– Area feel: Sparse suburban

Kosatka // Shutterstock
#16. Wilshire/Montana, California
American flag and Pride Flag next to each other
– Population: 14,828
– Median household income: $112,966
– Median home value: $1,201,595
– Median rent: $2,135
– Percent of people who own a home: 21%
– Area feel: Dense urban
You may also like: What the 50 biggest cities in America looked like 50 years ago
rblfmr // Shutterstock
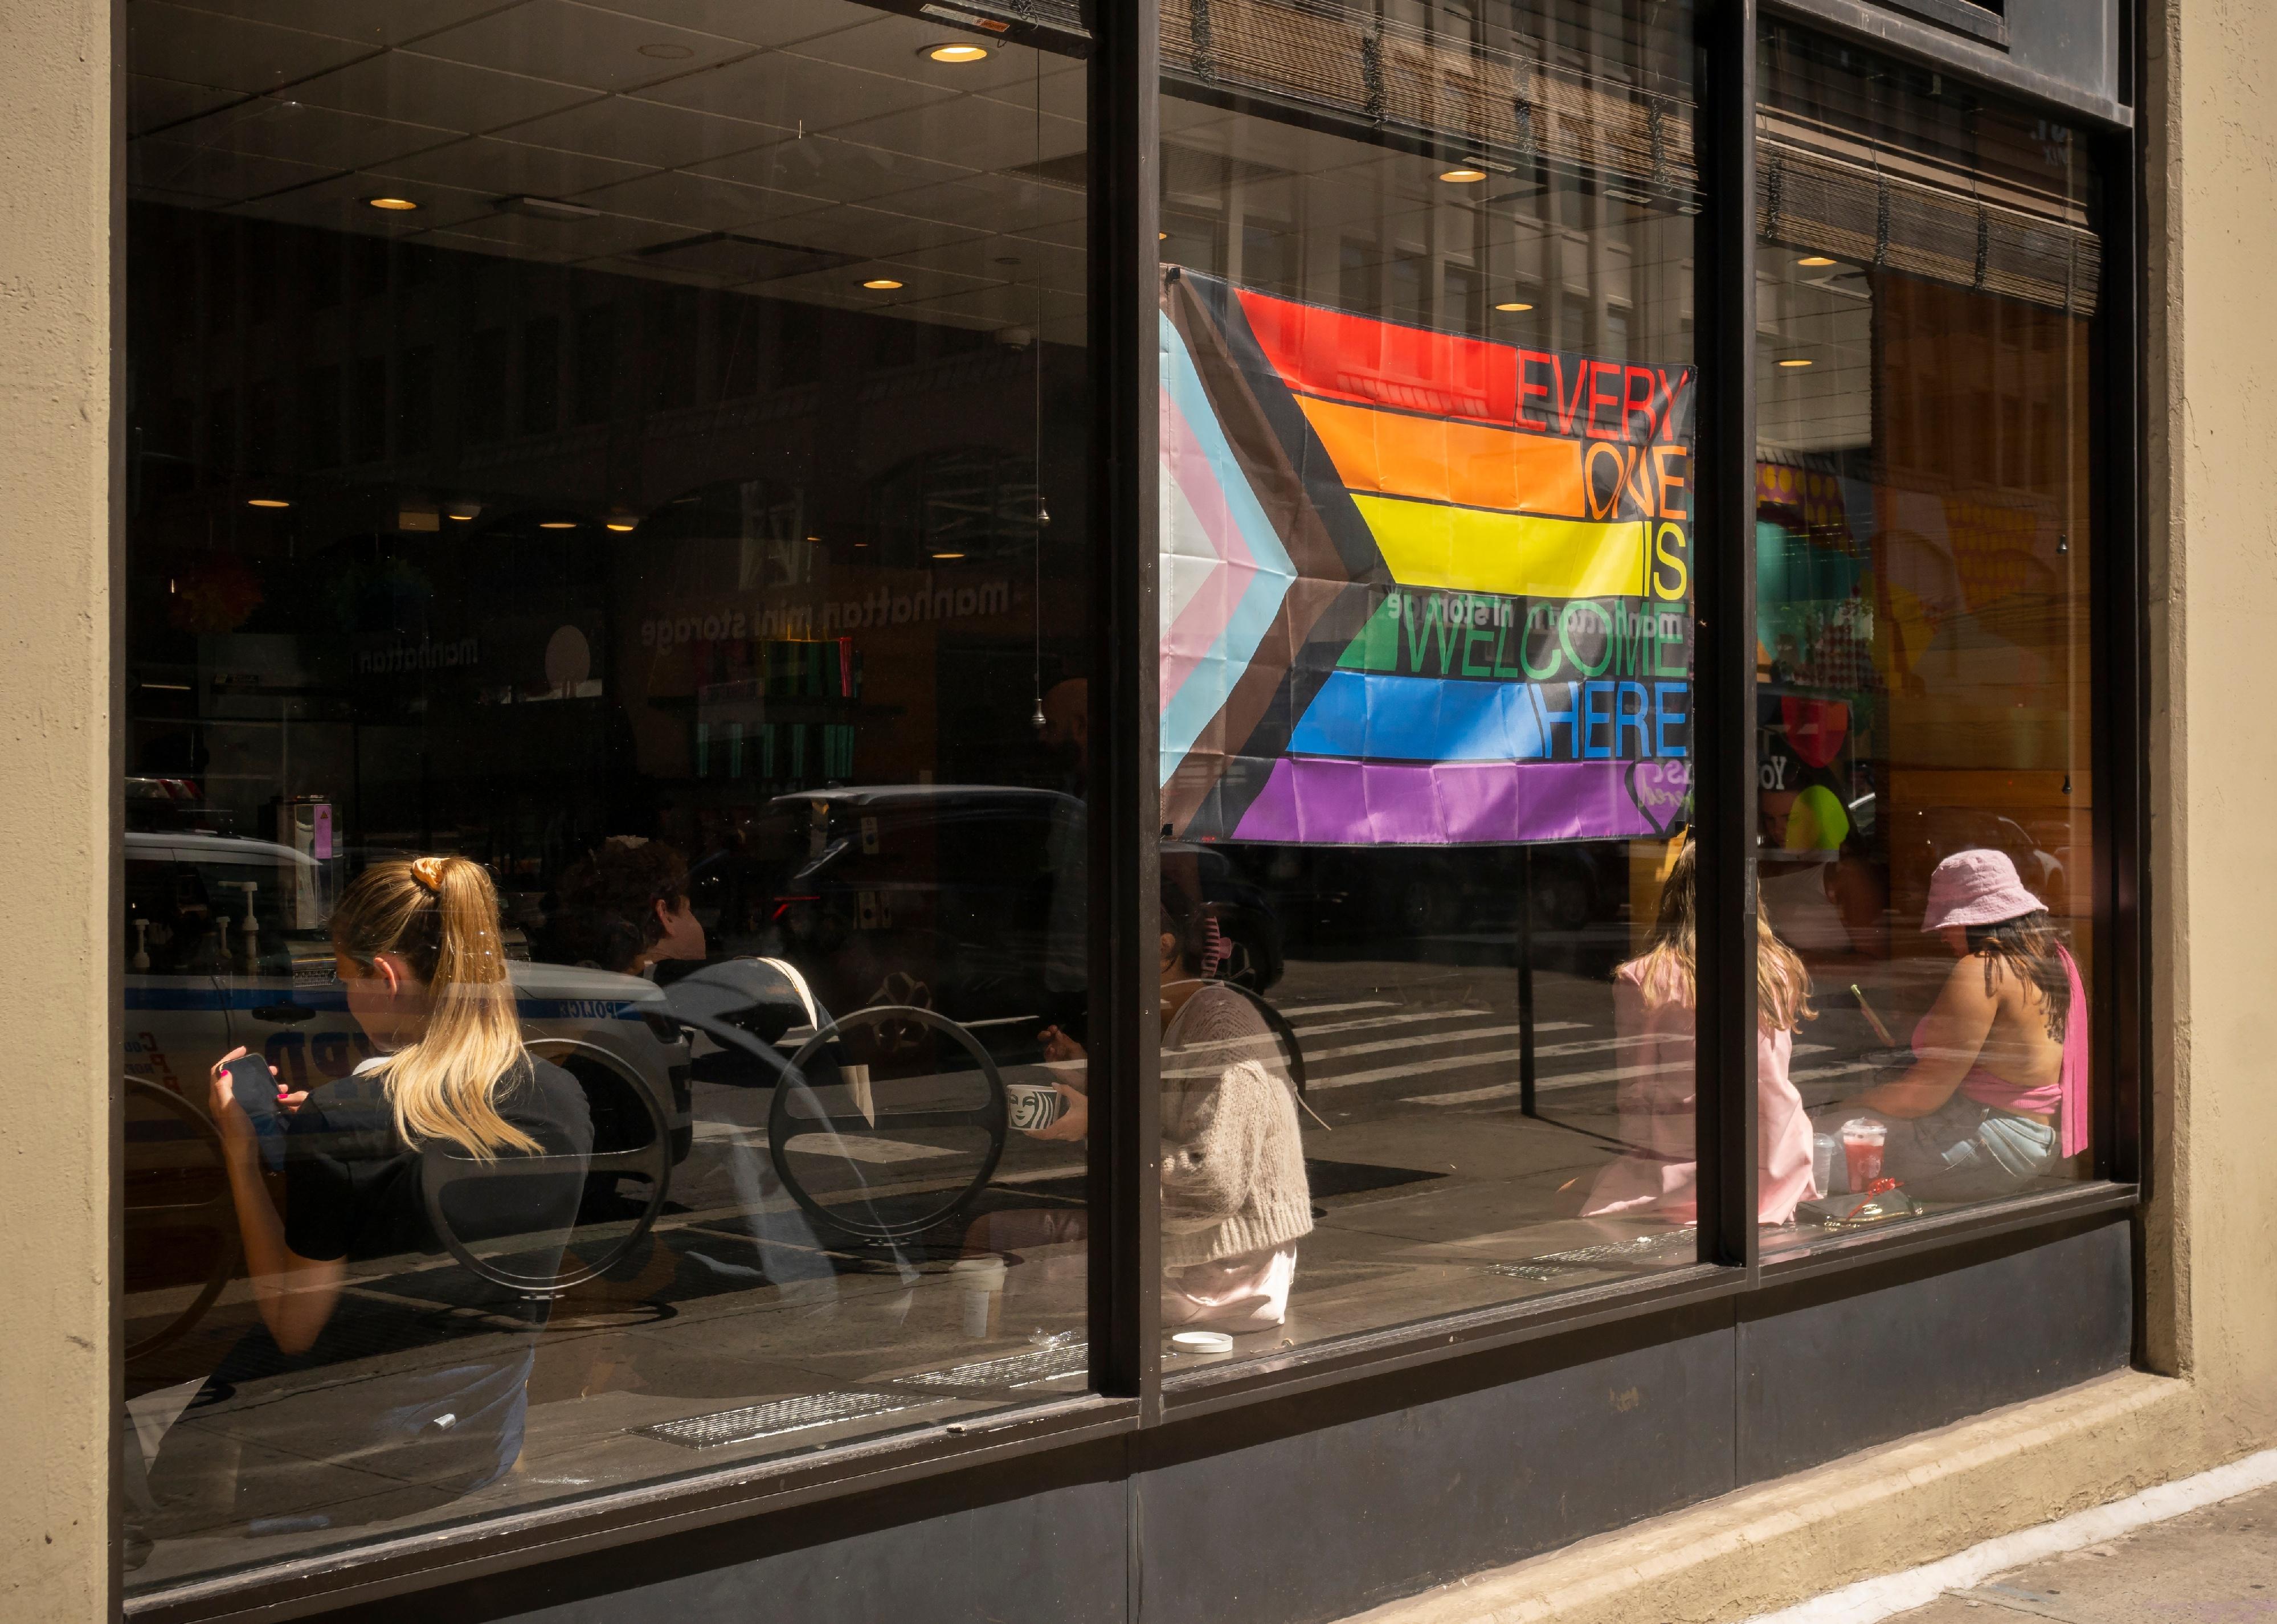
#15. Downtown North, California
Pride progress flag in window of coffee shop
– Population: 3,215
– Median household income: $81,663
– Median home value: $1,575,707
– Median rent: $1,845
– Percent of people who own a home: 28%
– Area feel: Dense urban
Vineyard Perspective // Shutterstock
#14. Manhasset Hills, New York
Brick house with BLM Love is Love flag flying from porch
– Population: 3,808
– Median household income: $165,833
– Median home value: $847,600
– Median rent: $2,768
– Percent of people who own a home: 92%
– Area feel: Rural
Dr.frog // Wikimedia Commons
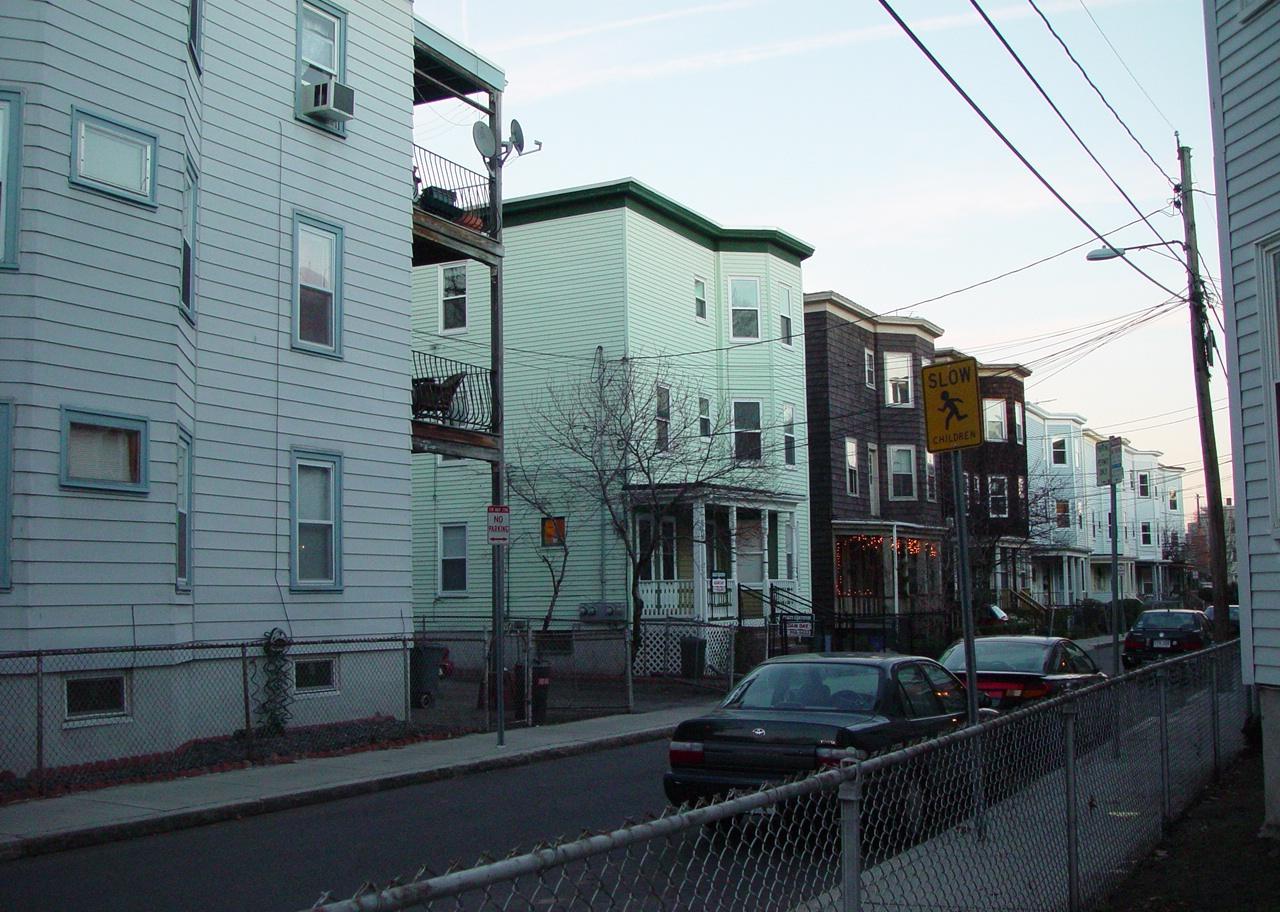
#13. Cambridgeport, Massachusetts
A row of flat-roofed triple deckers in Cambridge, Massachusetts
– Population: 13,713
– Median household income: $110,565
– Median home value: $887,195
– Median rent: $2,309
– Percent of people who own a home: 35%
– Area feel: Dense urban
John Phelan // Wikimedia Commons
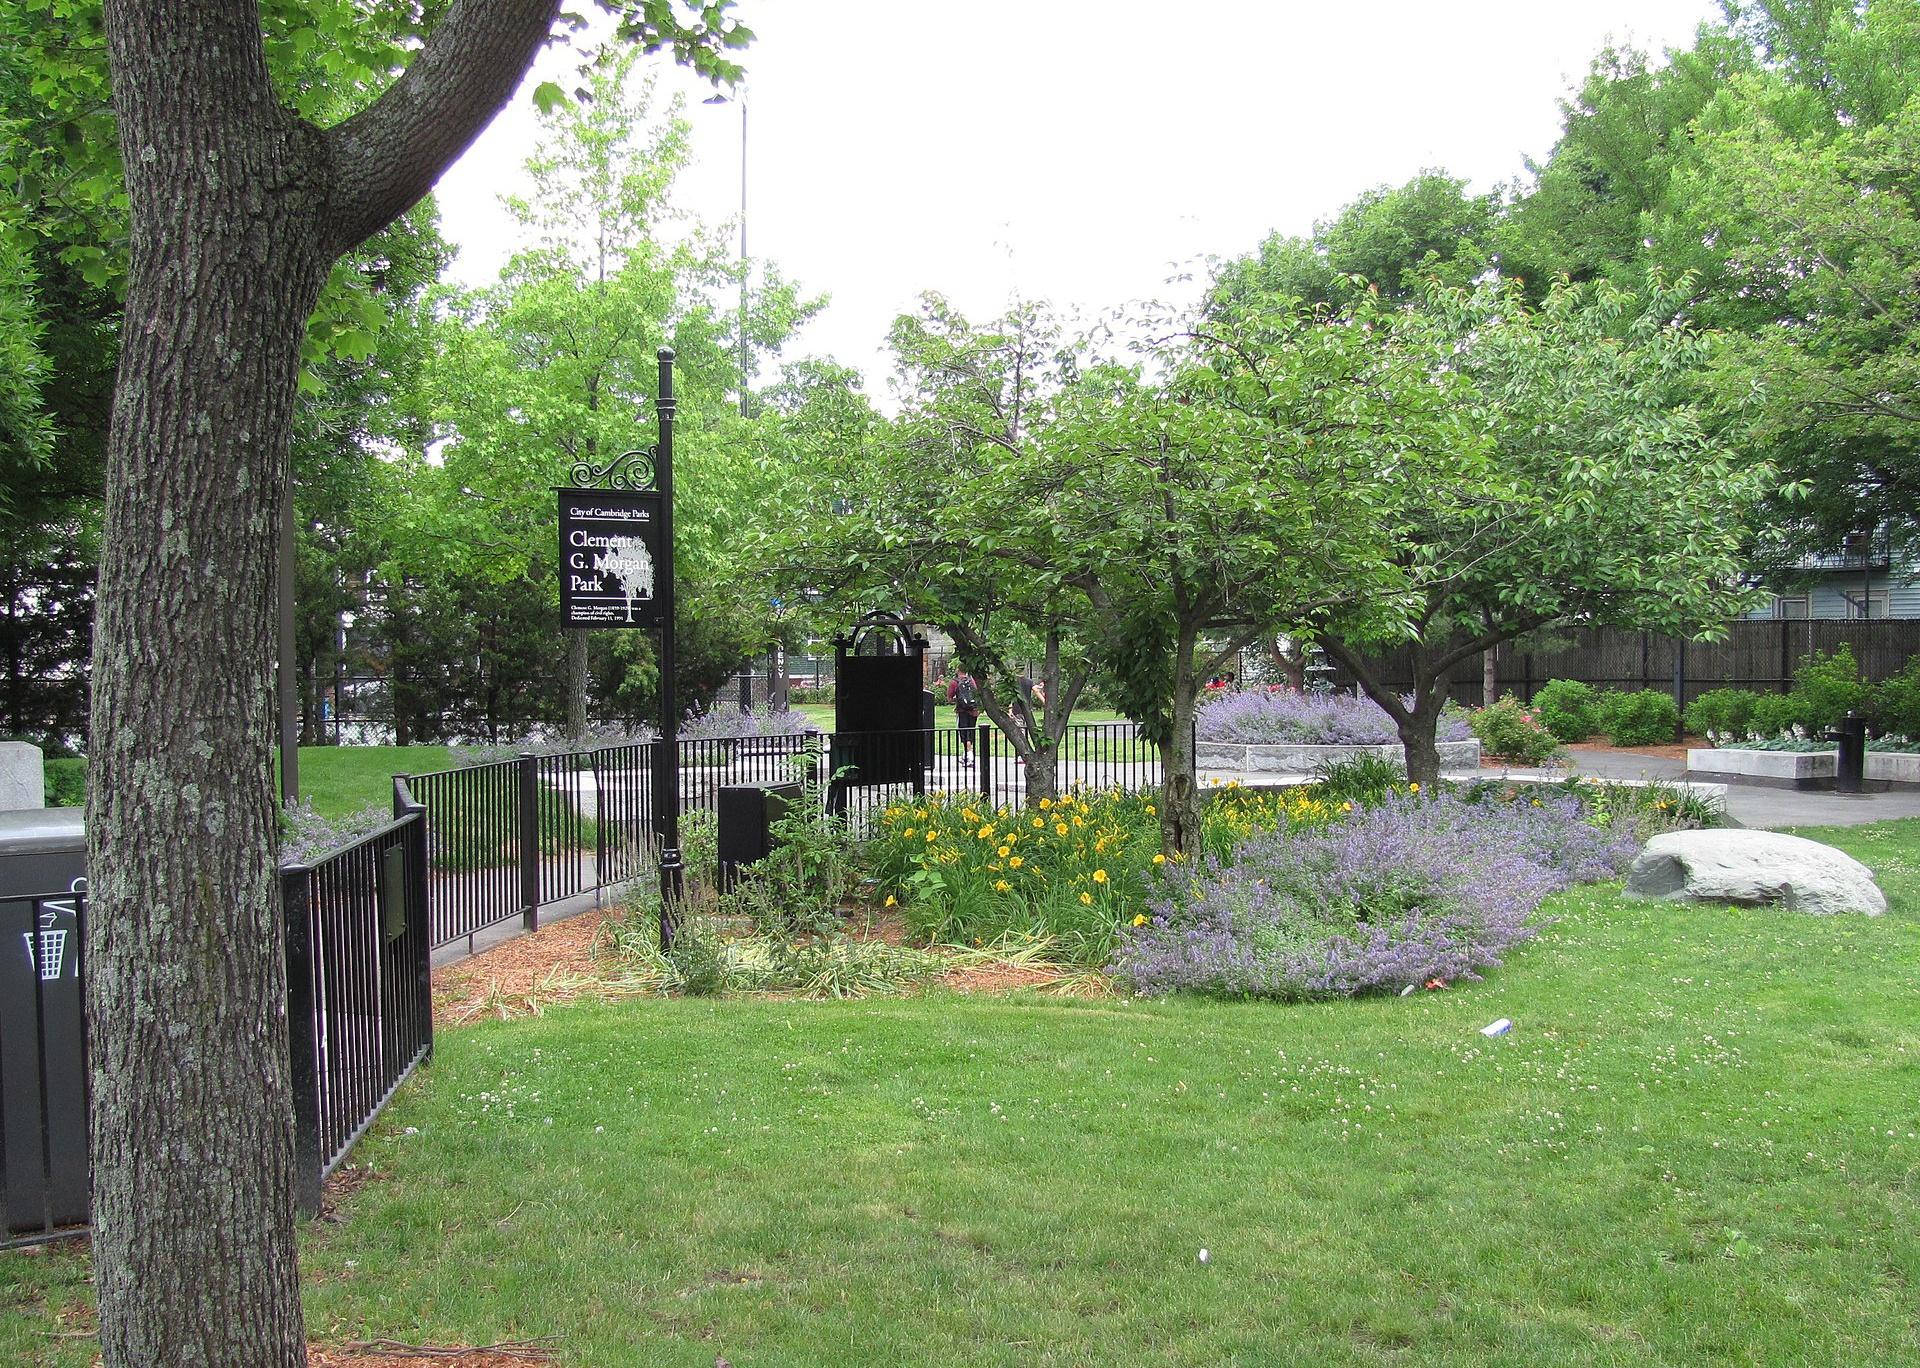
#12. The Port, Massachusetts
Clement G. Morgan Park
– Population: 6,658
– Median household income: $101,998
– Median home value: $805,299
– Median rent: $2,064
– Percent of people who own a home: 33%
– Area feel: Urban suburban mix
Jon Osumi // Shutterstock
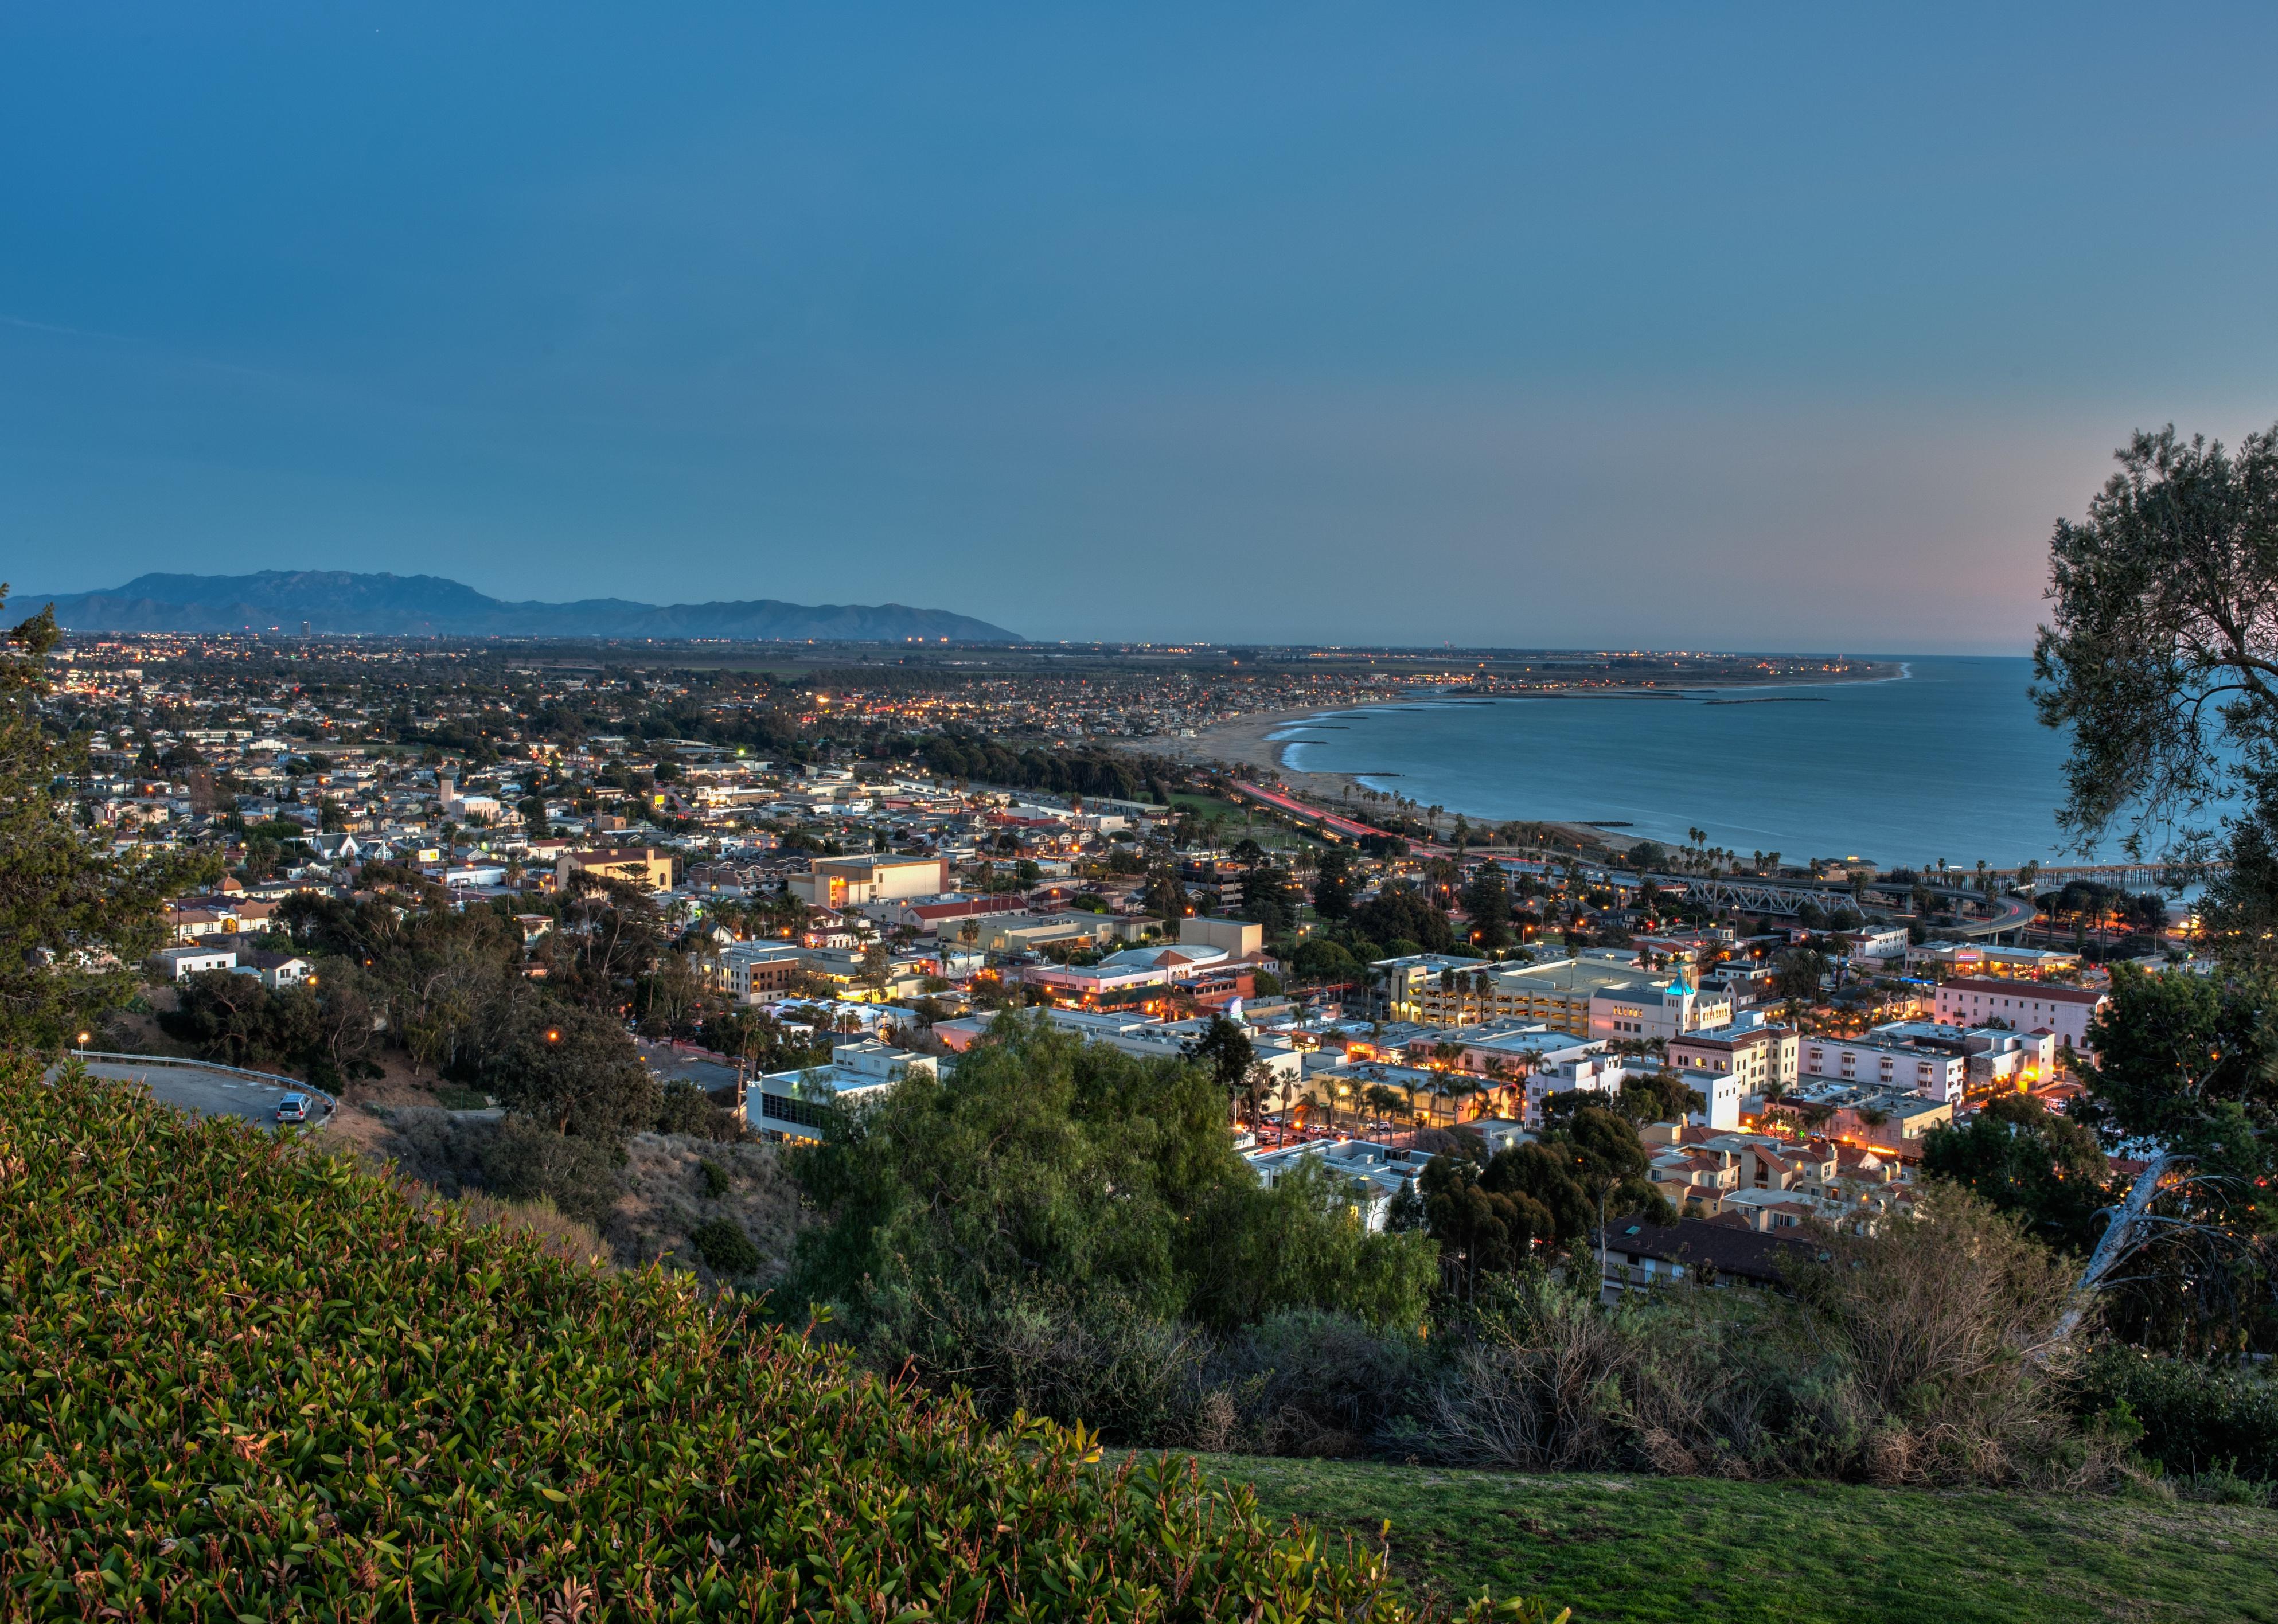
#11. Ventura, California
Coastal town of Ventura illuminated by street lights
– Population: 4,011
– Median household income: $165,978
– Median home value: $1,440,763
– Median rent: $2,386
– Percent of people who own a home: 38%
– Area feel: Urban
You may also like: The best places to live out your West Coast retirement dreams
RellMade // Shutterstock
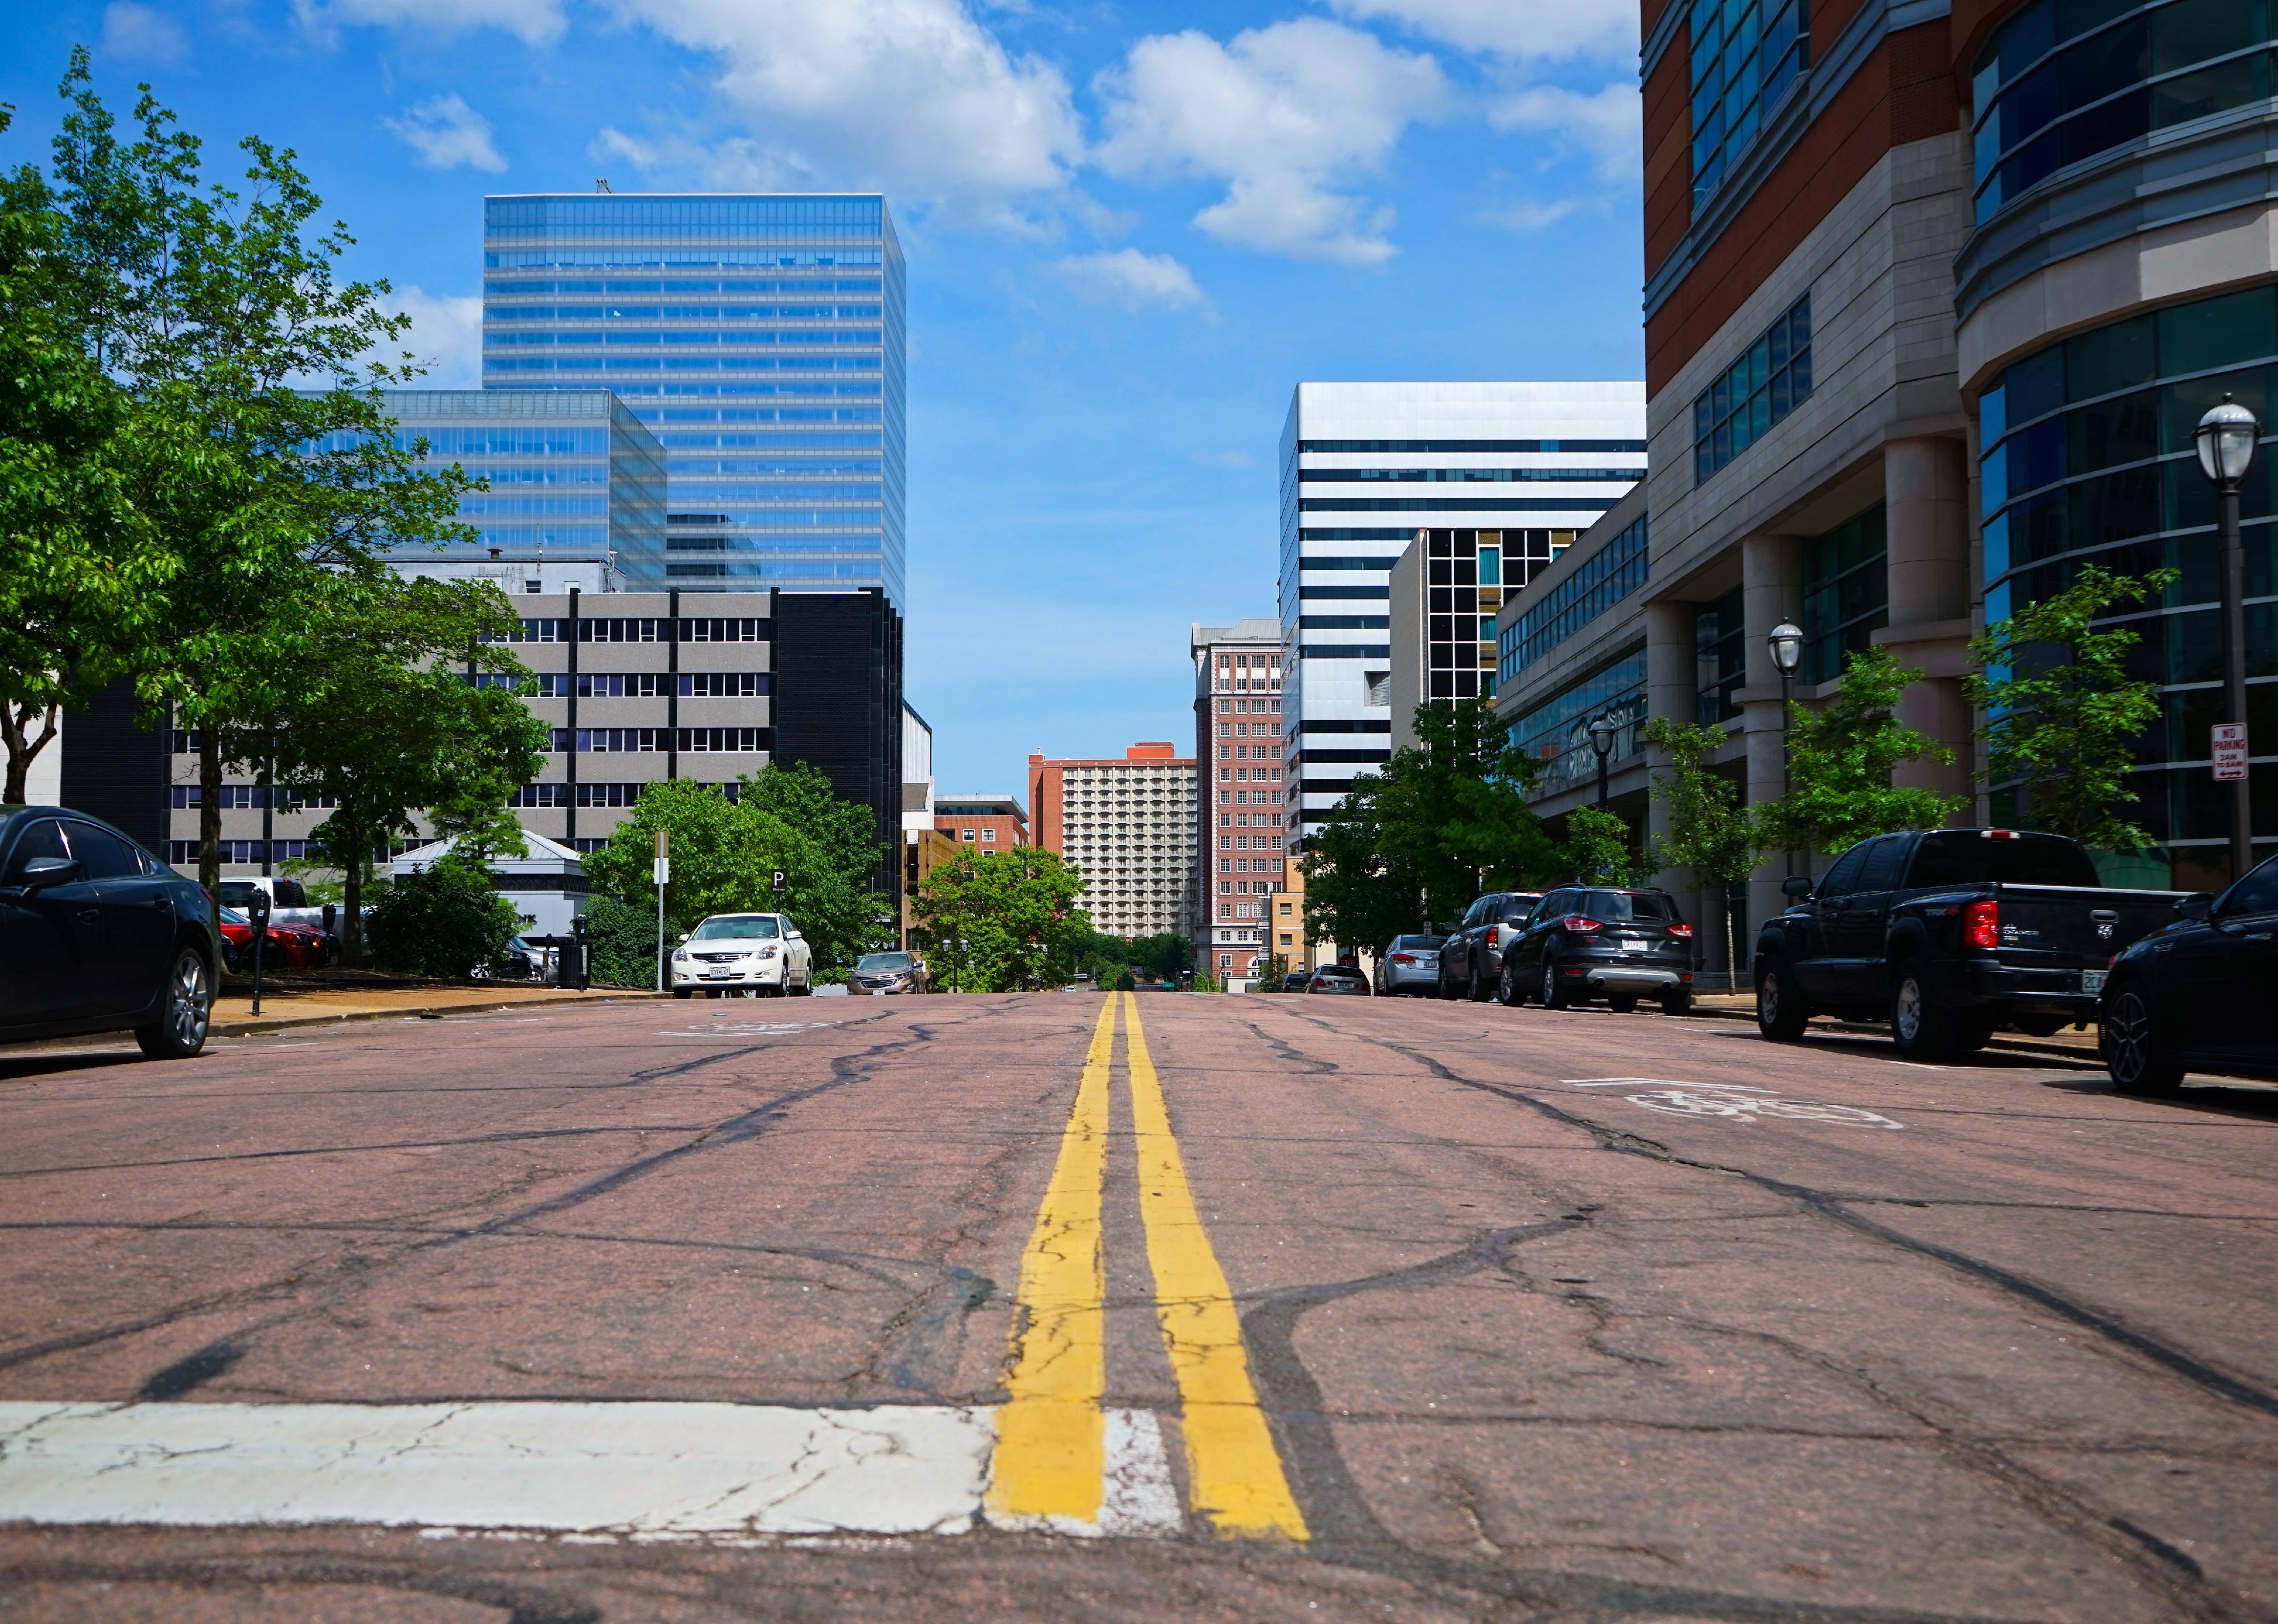
#10. Clayton, Missouri
Looking down a street in Clayton
– Population: 16,763
– Median household income: $108,387
– Median home value: $605,700
– Median rent: $1,334
– Percent of people who own a home: 57%
– Area feel: Urban suburban mix
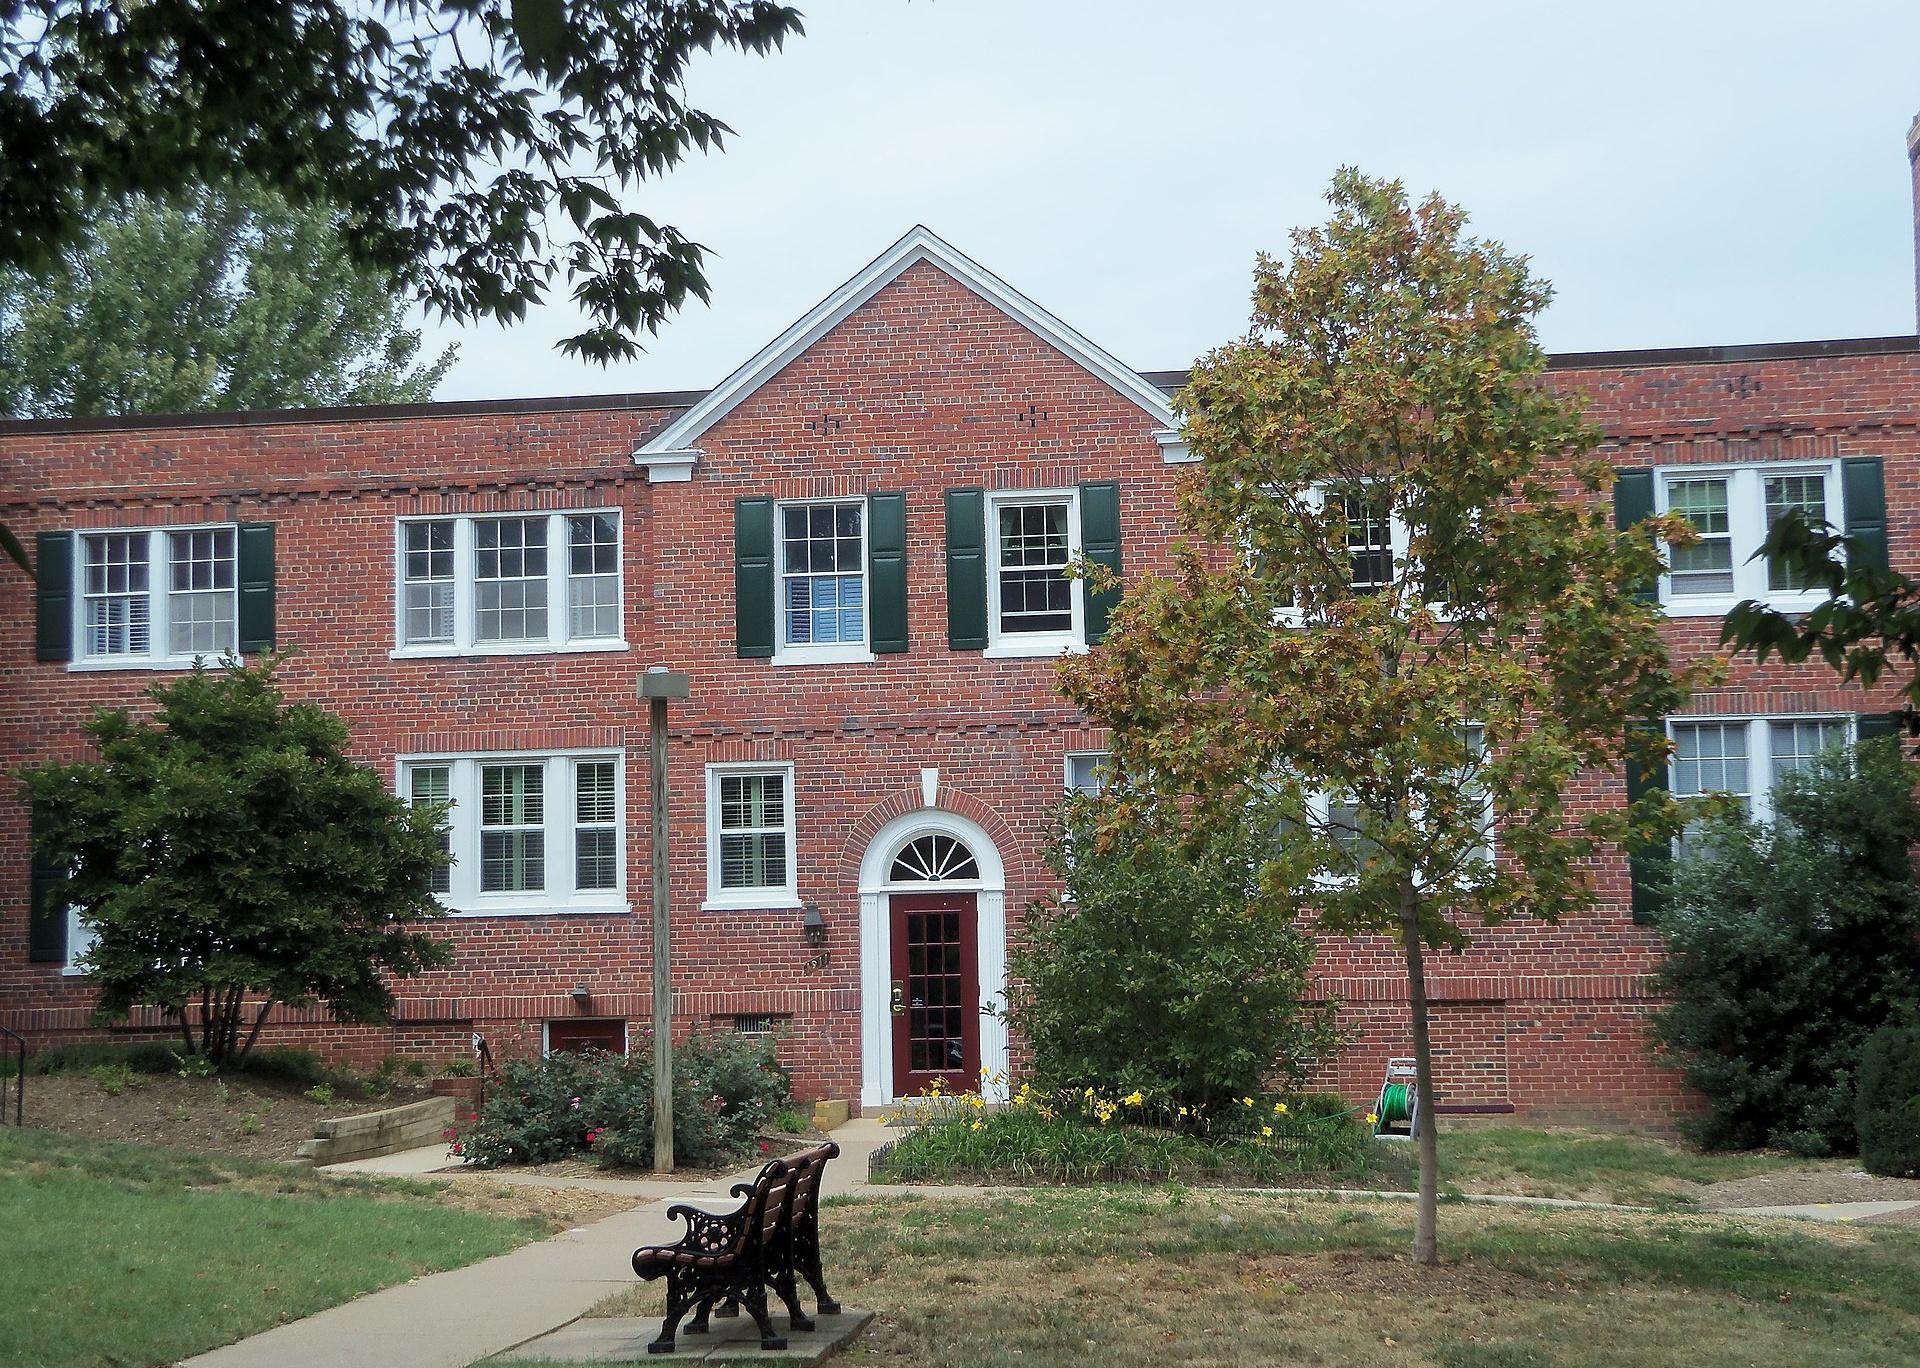
Farragutful // Wikimedia Commons
#9. Colonial Village, Virginia
Colonial Village, an apartment building in Arlington, Virginia
– Population: 3,071
– Median household income: $106,428
– Median home value: $376,387
– Median rent: $2,010
– Percent of people who own a home: 32%
– Area feel: null
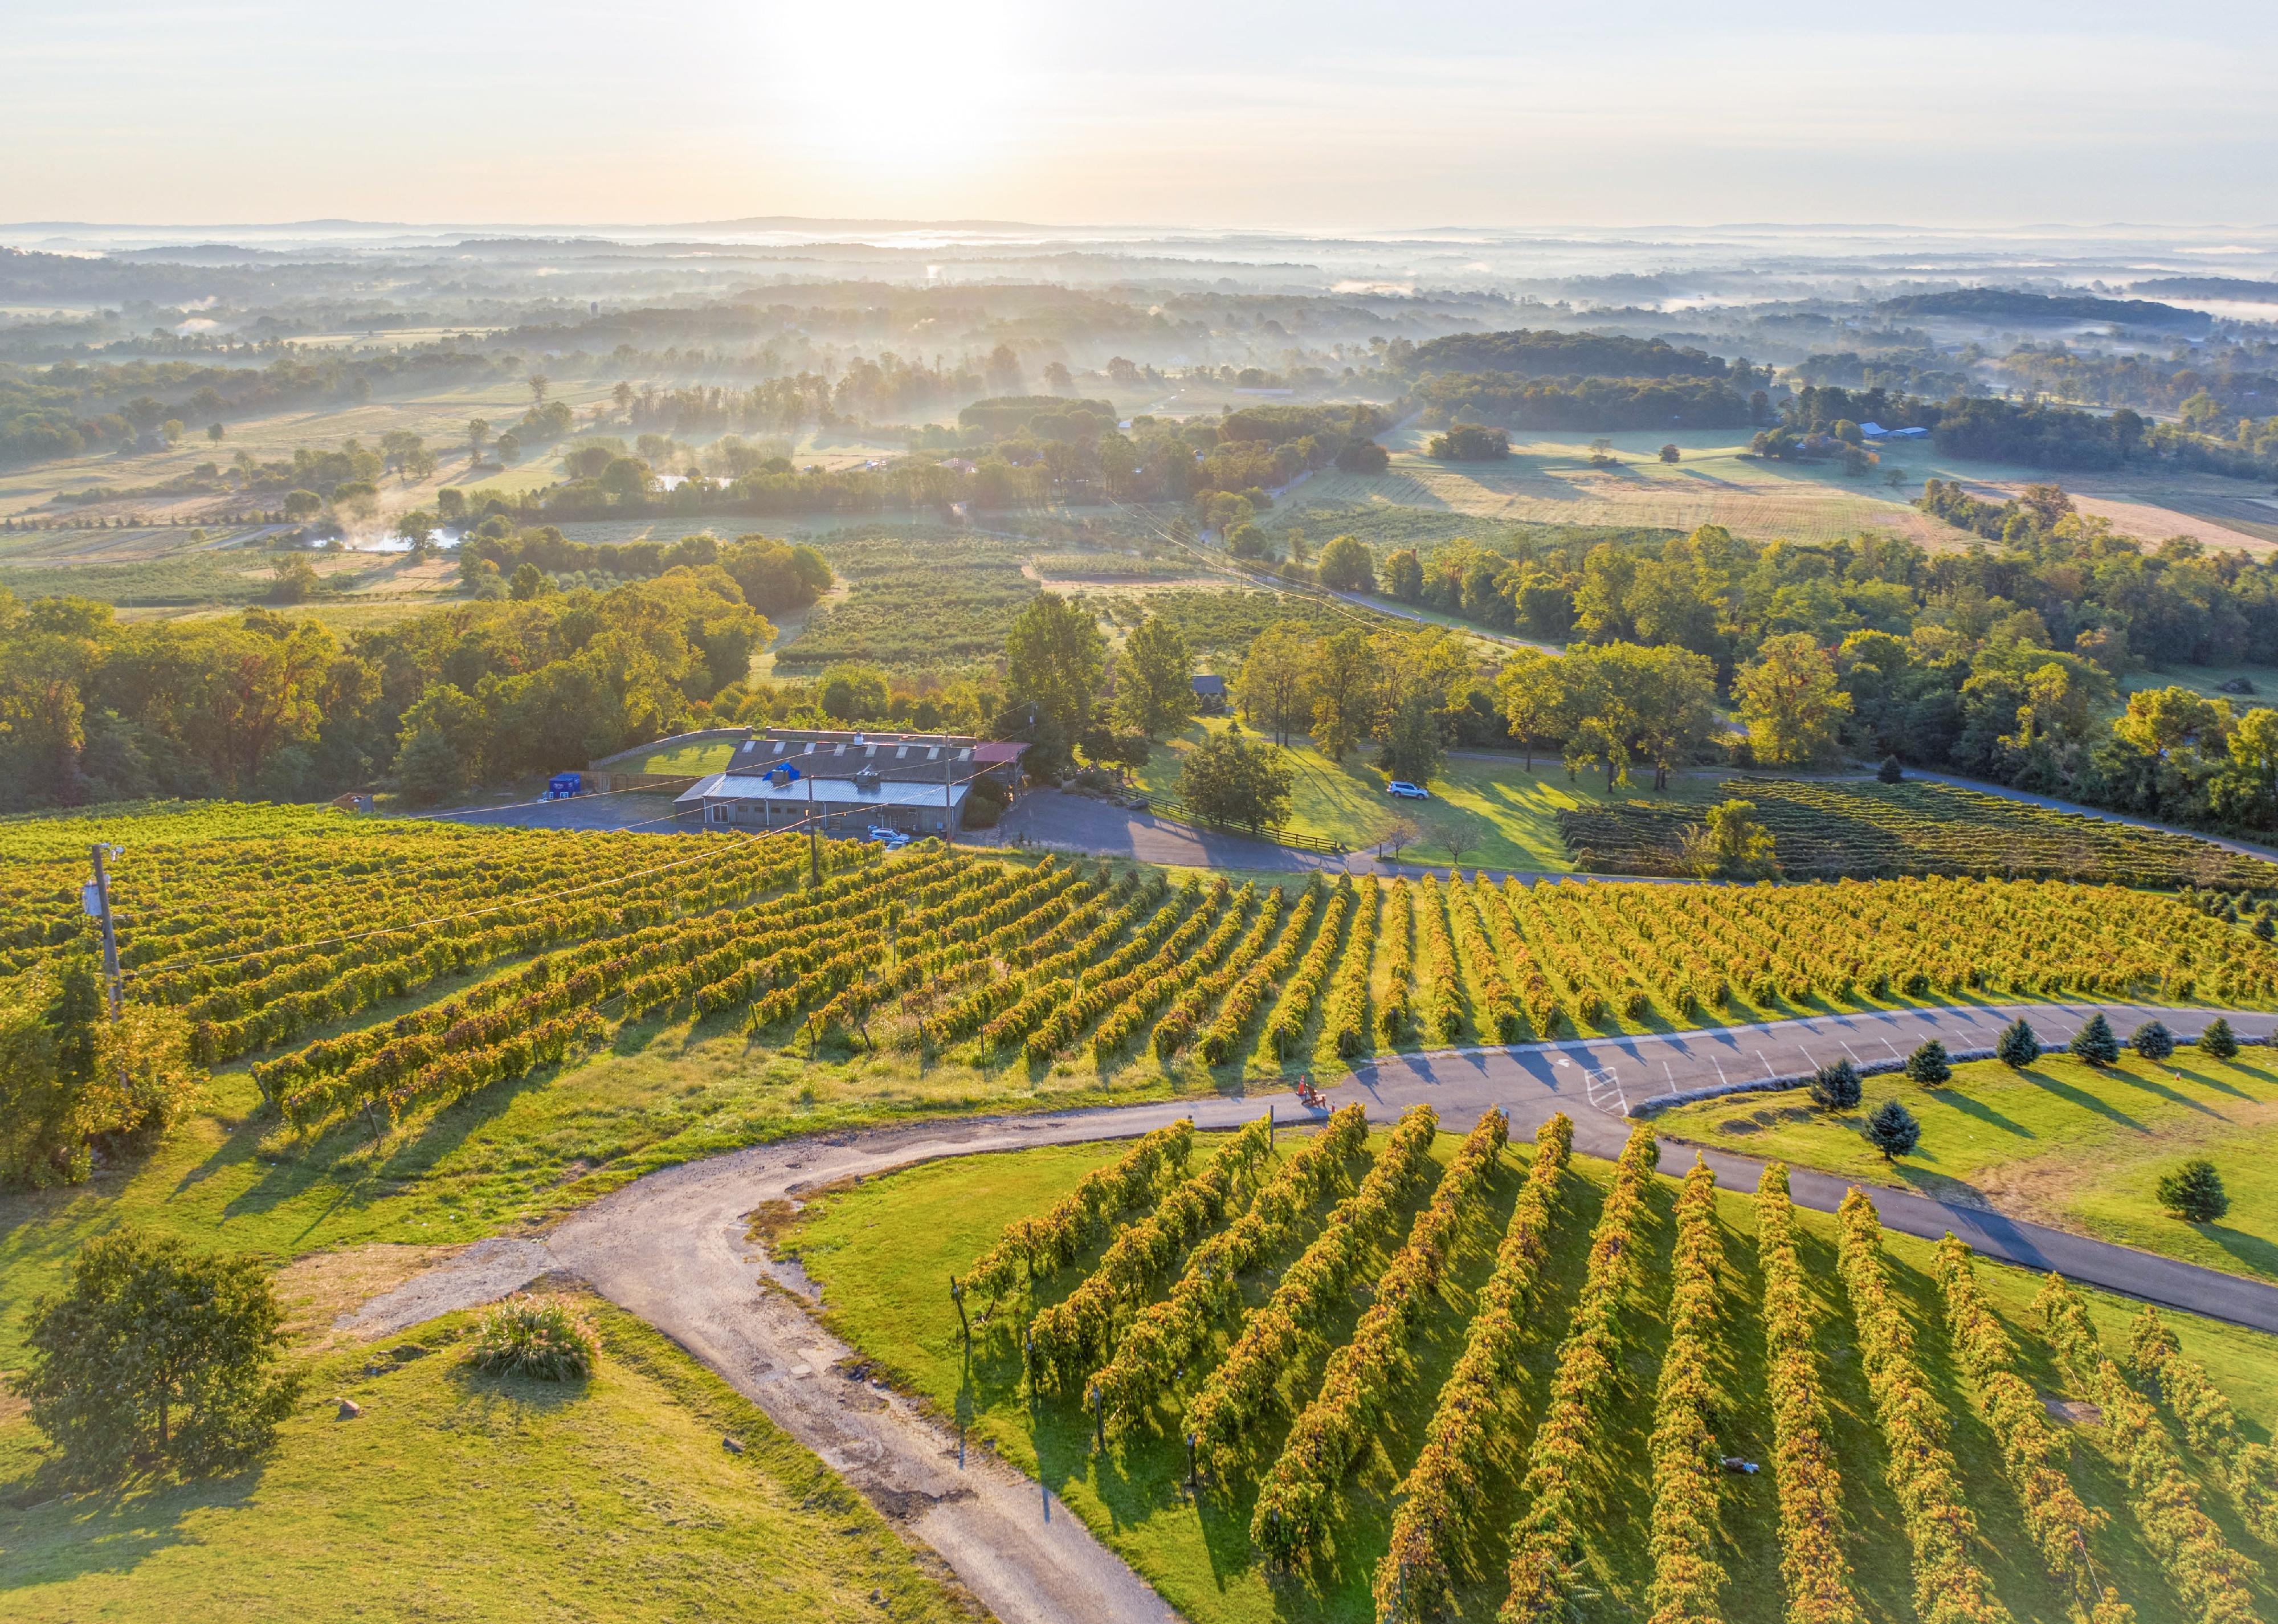
Brian Balik // Shutterstock
#8. Bluemont, Virginia
Bluemont Vineyards in Loudoun County, Virginia
– Population: 7,641
– Median household income: $182,295
– Median home value: $789,707
– Median rent: $2,186
– Percent of people who own a home: 66%
– Area feel: null
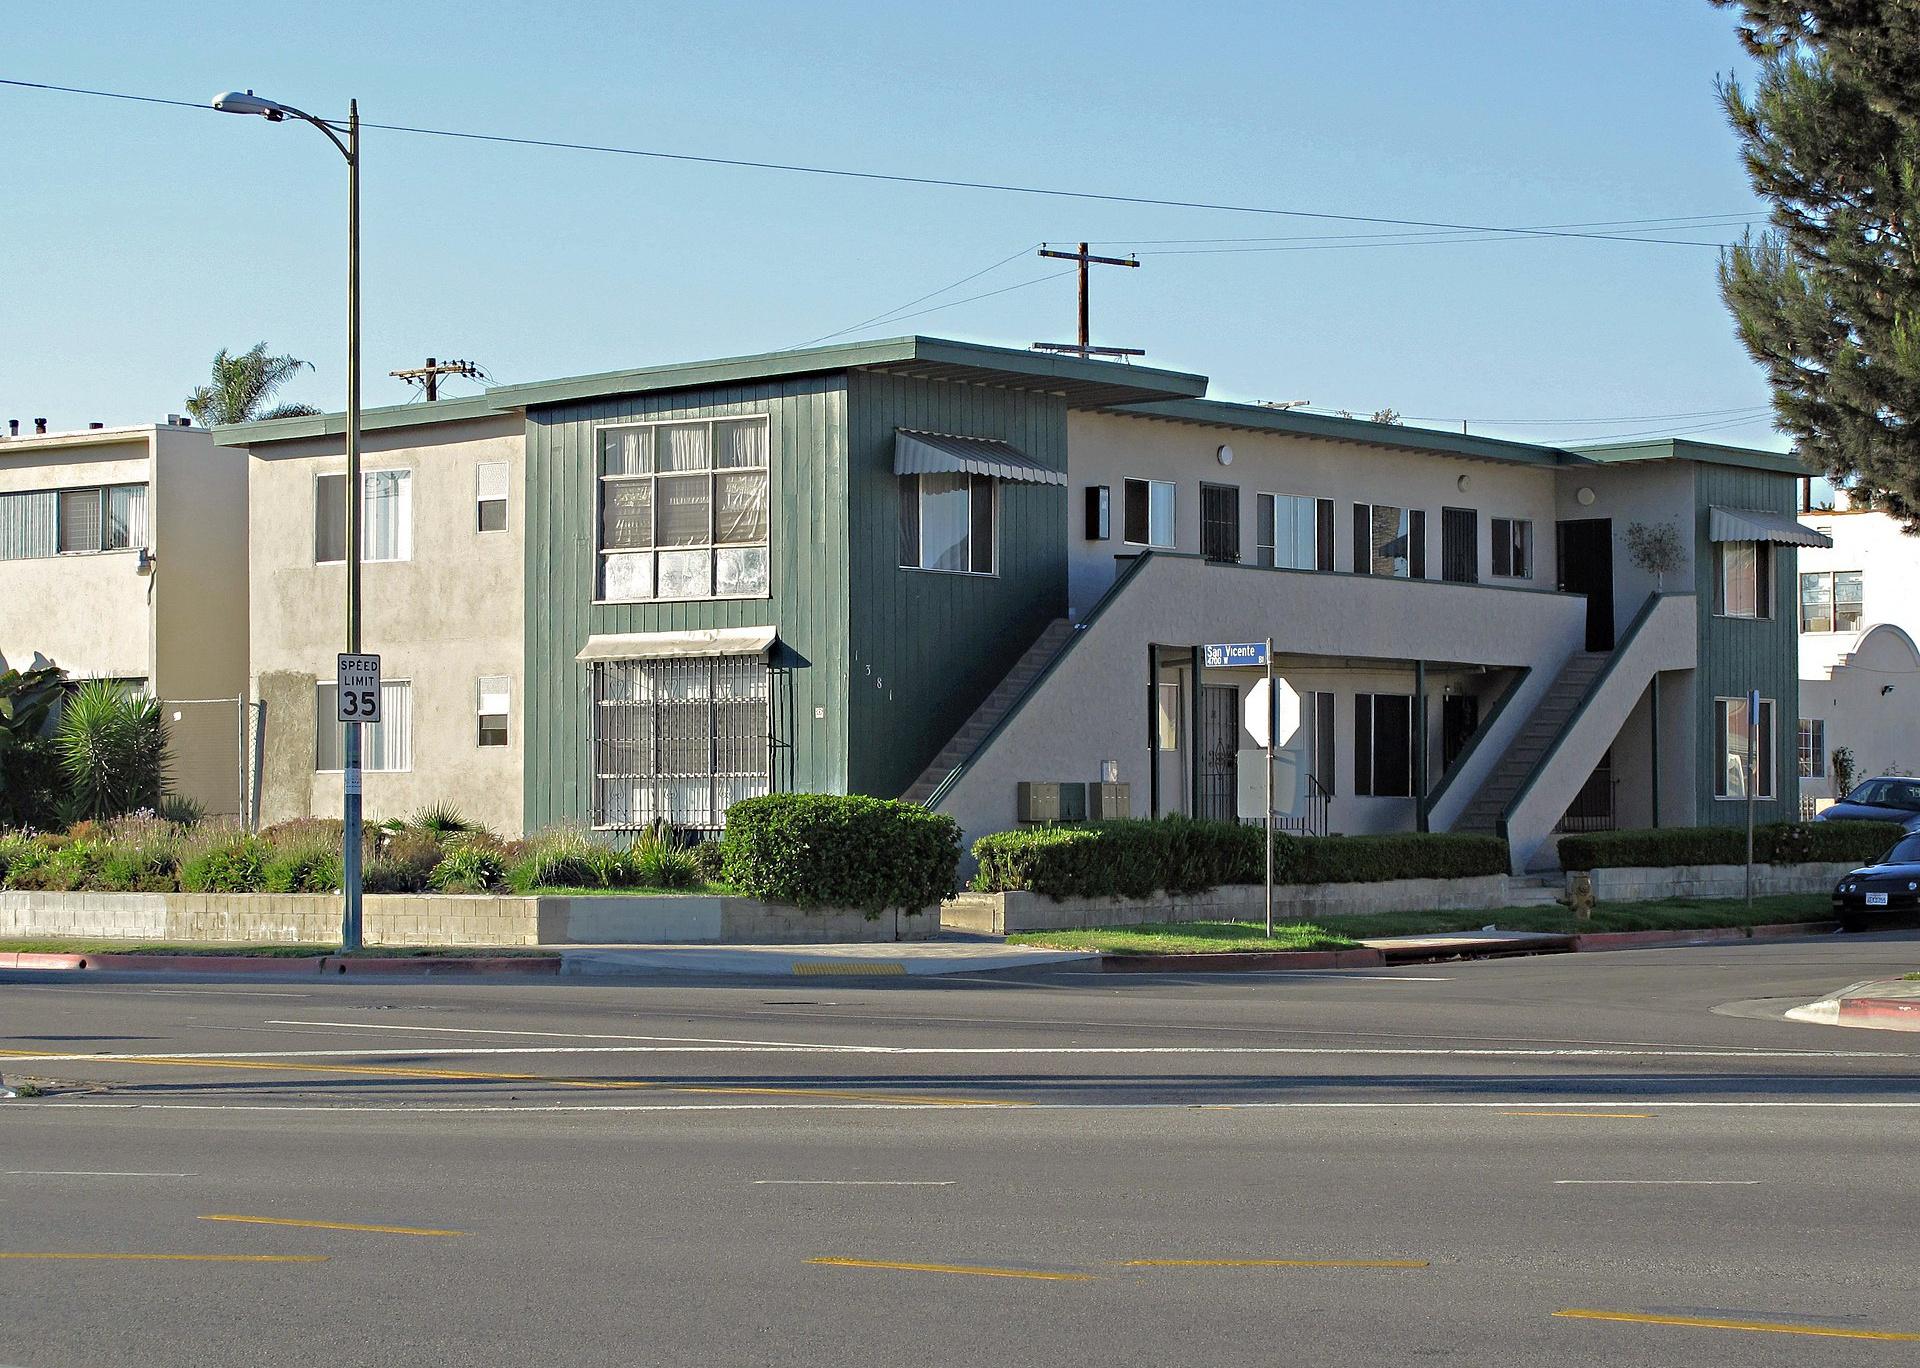
Dr.frog // Wikimedia Commons
#7. Mid-City, California
Apartment building at San Vicente and Pico boulevards
– Population: 16,938
– Median household income: $108,407
– Median home value: $1,029,245
– Median rent: $1,996
– Percent of people who own a home: 20%
– Area feel: Dense urban

Franco Francisco Maria // Shutterstock
#6. University South, California
BLM sign and rainbow flag
– Population: 4,040
– Median household income: $131,190
– Median home value: $1,773,512
– Median rent: $2,186
– Percent of people who own a home: 34%
– Area feel: Dense urban
You may also like: Metros where people owe more than their homes are worth
AITFFan1 // Wikimedia Commons
#5. Great Neck Gardens, New York
Locust Street in Great Neck Gardens
– Population: 1,213
– Median household income: $218,603
– Median home value: $980,700
– Median rent: null
– Percent of people who own a home: 60%
– Area feel: Sparse suburban
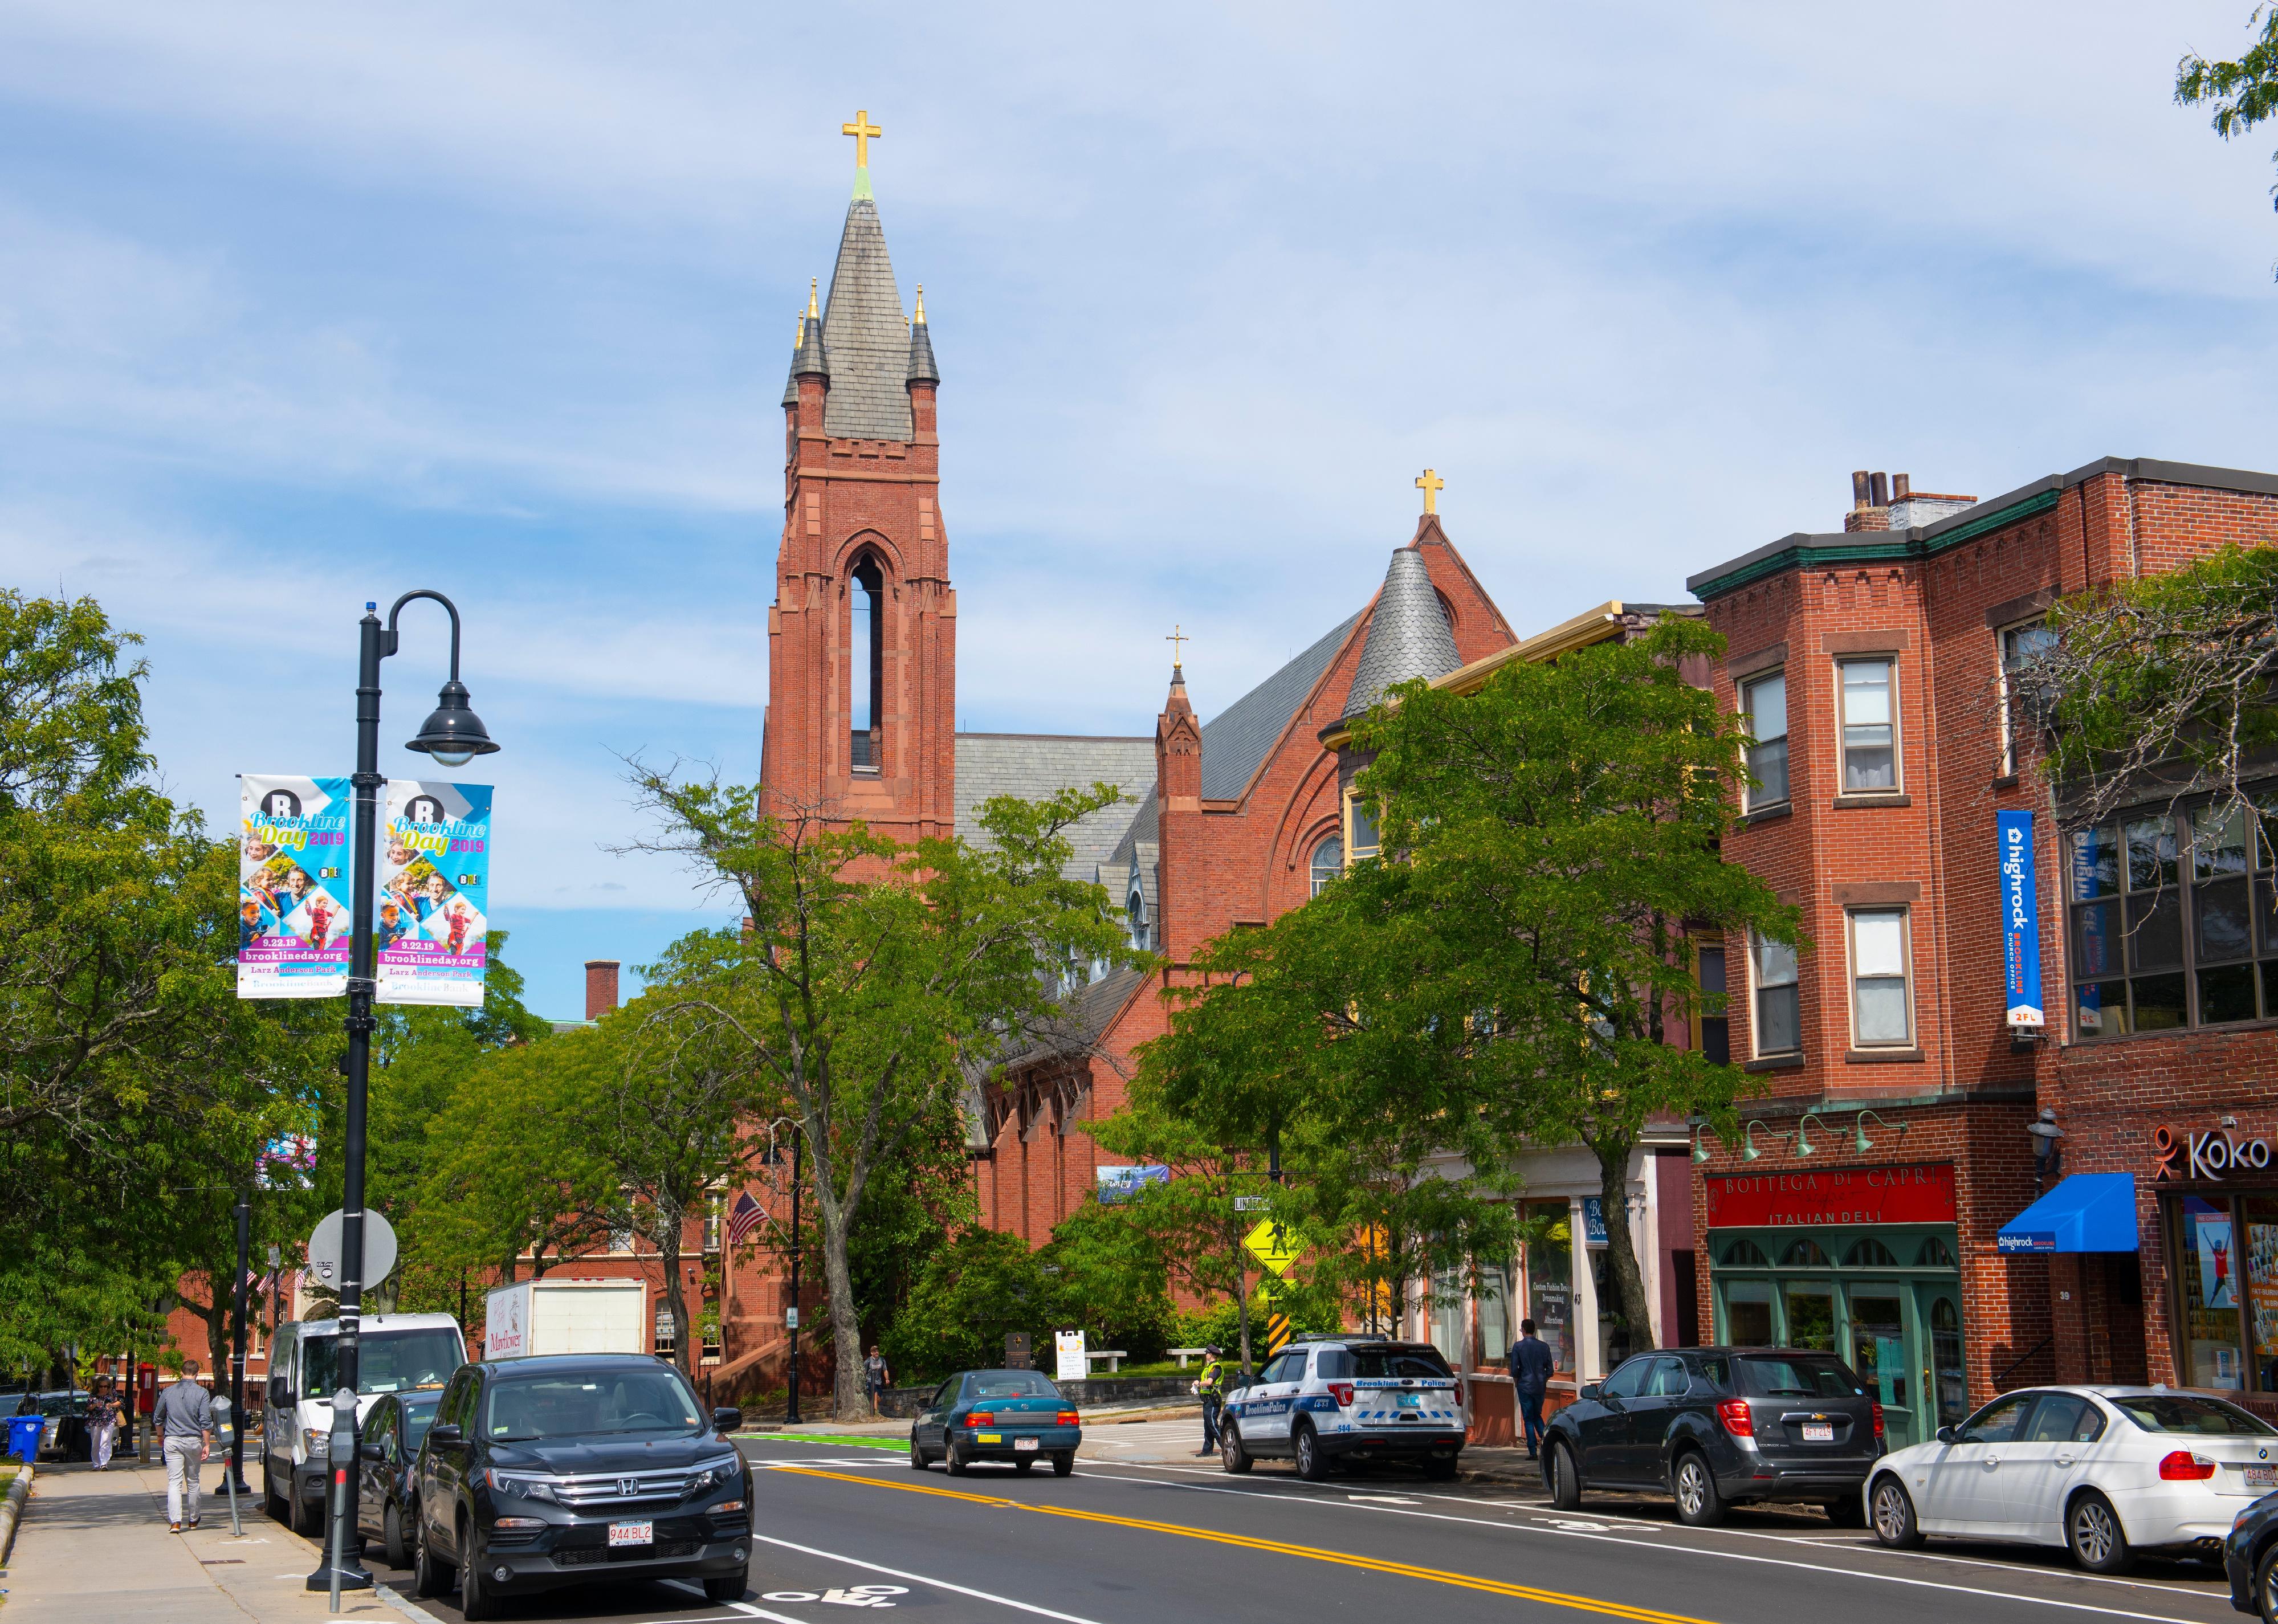
Wangkun Jia // Shutterstock
#4. Brookline, Massachusetts
Harvard Street in Brookline Village
– Population: 59,223
– Median household income: $113,642
– Median home value: $1,006,200
– Median rent: $2,305
– Percent of people who own a home: 49%
– Area feel: Urban
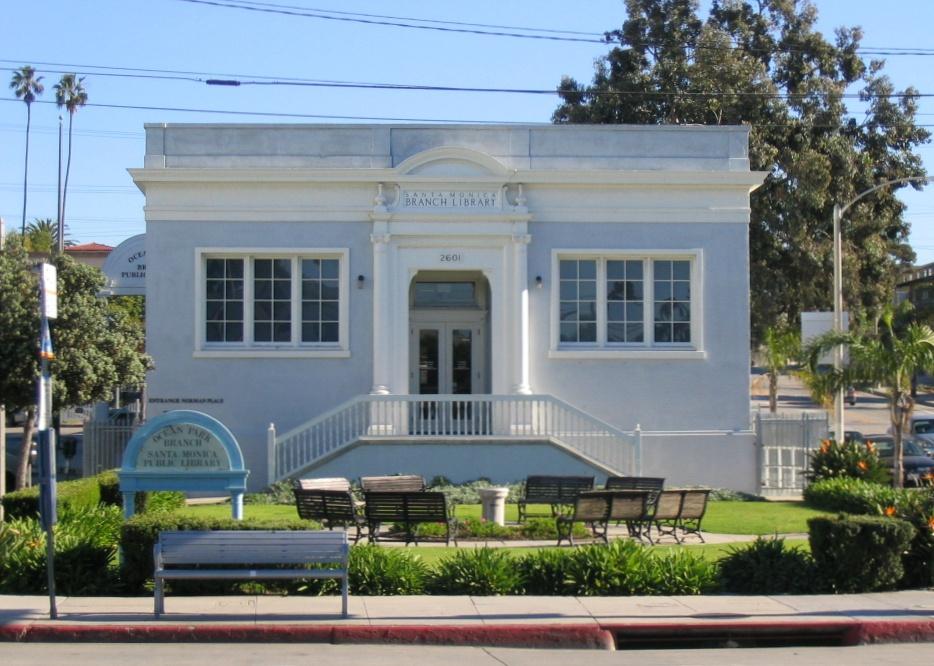
Creative Commons // Wikimedia Commons
#3. Ocean Park, California
Ocean Park Branch library
– Population: 12,072
– Median household income: $96,580
– Median home value: $1,260,192
– Median rent: $1,856
– Percent of people who own a home: 20%
– Area feel: Dense urban
Andriy Blokhin // Shutterstock
#2. Radnor/Fort Myer Heights, Virginia
Closeup of presidential election political yard sign
– Population: 11,927
– Median household income: $116,508
– Median home value: $536,537
– Median rent: $2,051
– Percent of people who own a home: 26%
– Area feel: null
Ii2nmd // Wikimedia Commons
#1. Ardmore, Pennsylvania
Front view of Ardmore post office
– Population: 13,567
– Median household income: $102,092
– Median home value: $346,300
– Median rent: $1,469
– Percent of people who own a home: 64%
– Area feel: Urban suburban mix
You may also like: Oldest cities in America