Workers suffer the most injuries in these 25 jobs

Andrey_Popov // Shutterstock
Workers suffer the most injuries in these 25 jobs
A woman at a desk on the phone with a blue cast on her arm.
When it comes to workplace safety, not all industries are created equal. In fact, some industries are significantly more dangerous than others. While workplaces have generally become safer since the creation of safety regulations and enforcement agencies, some work environments are inherently risky regardless of protective measures.
The consequences of occupational injuries extend beyond the person who gets injured. The nonprofit National Safety Council determined that the 2020 cost of work injuries was $163.9 billion, a figure that includes workers’ compensation, medical expenses, and productivity loss from missed days of work.
Westfield used Bureau of Labor Statistics data to rank the 25 jobs with the highest rates of nonfatal occupational injuries that involved days away from work, which can indicate a more serious illness or injury. All data is from 2020, the most recent available, and includes all workers nationally, regardless of sector or industry.
In 2020, there were 1.4 million nonfatal workplace injuries and illnesses that caused a worker to miss at least one day of work, according to the Bureau of Labor Statistics. This is a 28.5% increase from the previous year. Importantly, this data includes cases where a worker was infected with COVID-19 while performing work-related duties.
There were 428,700 employer-reported respiratory illness cases in 2020—an increase from 10,800 in 2019. The increase is thus attributable to the coronavirus pandemic and mandated quarantine protocols for potential exposure.
Overall in 2020, “exposure to harmful substances or environments” was the leading cause of work-related injuries and illnesses leading to days off work. The year before, that had been the sixth-ranked cause.
Despite the surge in cases, 2020 workers’ compensation premiums for private carriers and state funds dropped by 9.8% (from 2019 levels) to $42.5 billion, according to the Insurance Information Institute. That’s because there were so many people laid off that even with the increased risk from COVID-19, the overall risk of workplace injury dropped.
Unsurprisingly, the health care industry experienced a 249% increase in workplace injuries and illnesses in 2020. Though it was an exceptionally hazardous year for health care workers, the industry is often among the most dangerous because of the nature of the work itself.
Read on to discover which other jobs pose the most risks to the health and safety of their workers.
![]()

Canva
#25. Physical therapist assistants
A physical therapist helps a man unwrap a bandaged leg.
– Injury and illness rate: 376.3 per 10,000 full-time workers
– Total injury and illness cases: 2,310
– Median days out: 11

Canva
#24. Registered nurses
A nurse taking a patient’s blood pressure in a hospital bed.
– Injury and illness rate: 385.3 per 10,000 full-time workers
– Total injury and illness cases: 90,170
– Median days out: 13

Canva
#23. Medical and health services managers
A medical team management meeting at a table.
– Injury and illness rate: 386.5 per 10,000 full-time workers
– Total injury and illness cases: 13,750
– Median days out: 12

Canva
#22. Recreational therapists
A young woman on a couch talking with a therapist.
– Injury and illness rate: 392.7 per 10,000 full-time workers
– Total injury and illness cases: 540
– Median days out: 12

Canva
#21. Pest control workers
A pest control worker spraying the outside windows of a home.
– Injury and illness rate: 394.0 per 10,000 full-time workers
– Total injury and illness cases: 2,830
– Median days out: 14

Teran Studios // Shutterstock
#20. Respiratory therapists
A young girl using a respiratory therapy tool administered by a therapist.
– Injury and illness rate: 395.9 per 10,000 full-time workers
– Total injury and illness cases: 4,220
– Median days out: 15

Canva
#19. Animal caretakers
A zoo keeper holding a big lizard.
– Injury and illness rate: 419.7 per 10,000 full-time workers
– Total injury and illness cases: 5,440
– Median days out: 3

Canva
#18. Maids and housekeeping cleaners
A maid vacuuming a living room.
– Injury and illness rate: 423.2 per 10,000 full-time workers
– Total injury and illness cases: 24,120
– Median days out: 11

Canva
#17. Occupational therapy assistants
An occupational therapist working with a child while playing with a toy.
– Injury and illness rate: 444.2 per 10,000 full-time workers
– Total injury and illness cases: 1,320
– Median days out: 12
Canva
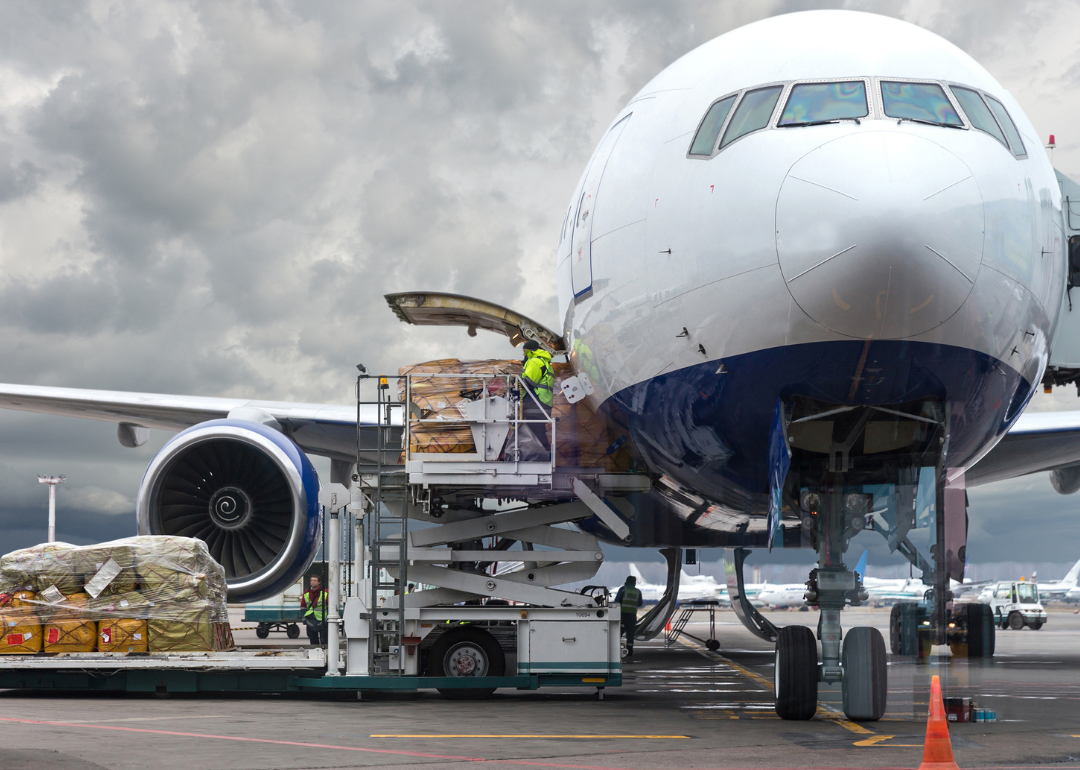
#16. Aircraft cargo handling supervisors
Aircraft cargo handlers moving large packages onto a plane.
– Injury and illness rate: 460.1 per 10,000 full-time workers
– Total injury and illness cases: 390
– Median days out: 95

Canva
#15. Refuse and recyclable material collectors
A trash collector riding on the back of a green garbage truck.
– Injury and illness rate: 476.8 per 10,000 full-time workers
– Total injury and illness cases: 4,650
– Median days out: 19

Canva
#14. First-line supervisors of correctional officers
A correctional officer escorting a prisoner out of a room.
– Injury and illness rate: 484.6 per 10,000 full-time workers
– Total injury and illness cases: 2,380
– Median days out: 14

Canva
#13. Bus drivers, transit and intercity
A red bus driving through the city.
– Injury and illness rate: 491.1 per 10,000 full-time workers
– Total injury and illness cases: 7,300
– Median days out: 46
Canva
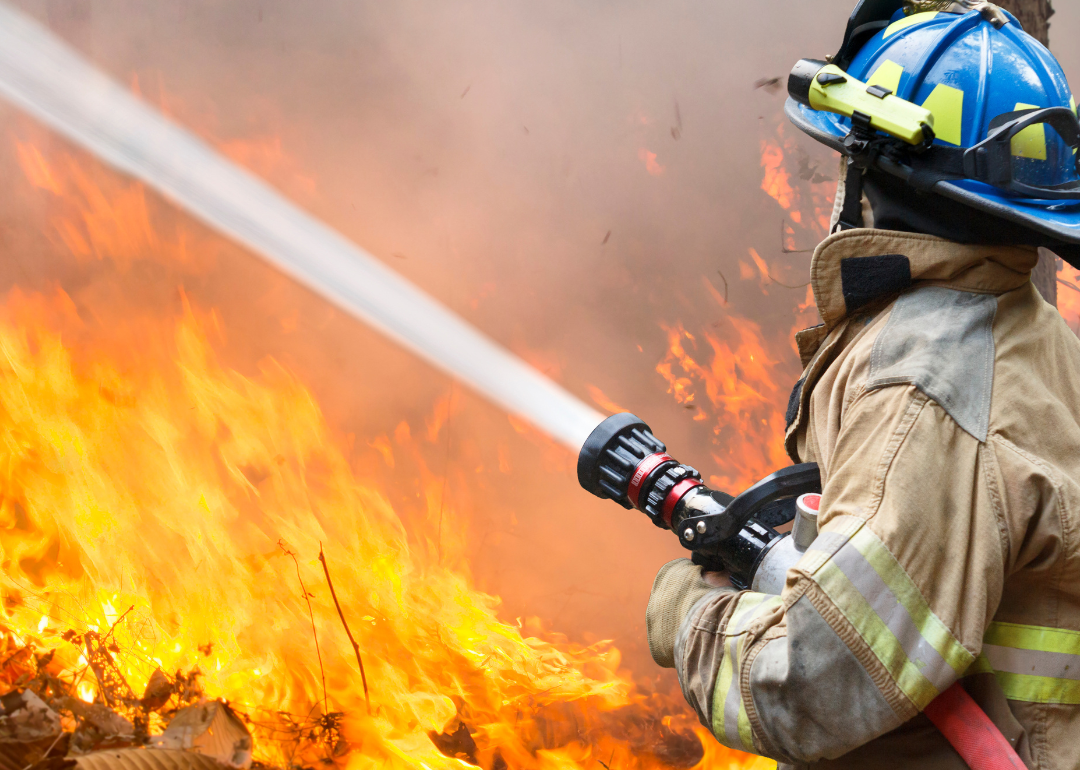
#12. Firefighters
A firefighter hosing a wildfire.
– Injury and illness rate: 539.0 per 10,000 full-time workers
– Total injury and illness cases: 17,890
– Median days out: 14

Canva
#11. Health information technologists, medical registrars, surgical assistants, and health care practitioners and technical workers, all other
A surgical assistant holding a tray of tools during surgery.
– Injury and illness rate: 567.9 per 10,000 full-time workers
– Total injury and illness cases: 3,270
– Median days out: 14

Canva
#10. Licensed practical and licensed vocational nurses
A nurse helping a patient out of a wheelchair.
– Injury and illness rate: 588.4 per 10,000 full-time workers
– Total injury and illness cases: 30,960
– Median days out: 12

Canva
#9. Police and sheriff’s patrol officers
A police officer walking toward a scene.
– Injury and illness rate: 685.3 per 10,000 full-time workers
– Total injury and illness cases: 38,930
– Median days out: 11

Canva
#8. First-line supervisors of firefighting and prevention workers
Two firefighters shaking hands in front of an engine.
– Injury and illness rate: 714.4 per 10,000 full-time workers
– Total injury and illness cases: 5,110
– Median days out: 22

Canva
#7. Correctional officers and jailers
A correctional officer escorting a prisoner in an orange jumpsuit.
– Injury and illness rate: 799.4 per 10,000 full-time workers
– Total injury and illness cases: 27,630
– Median days out: 14

Canva
#6. Orderlies
An orderly helping a man in a wheelchair put on shoes.
– Injury and illness rate: 849.0 per 10,000 full-time workers
– Total injury and illness cases: 2,780
– Median days out: 11

Canva
#5. Occupational therapy aides
Occupational therapists helping patients.
– Injury and illness rate: 904.4 per 10,000 full-time workers
– Total injury and illness cases: 350
– Median days out: 14

David Pereiras // Shutterstock
#4. Psychiatric technicians
A psychiatric tech kneeling down to help a patient sitting on the floor.
– Injury and illness rate: 1,000.6 per 10,000 full-time workers
– Total injury and illness cases: 6,840
– Median days out: 6

Canva
#3. Nursing assistants
A nurse talking with an assistant in the hospital hallway.
– Injury and illness rate: 1,014.4 per 10,000 full-time workers
– Total injury and illness cases: 103,300
– Median days out: 12

Canva
#2. Psychiatric aides
An aide speaking with an elderly couple in a health care facility.
– Injury and illness rate: 1,383.7 per 10,000 full-time workers
– Total injury and illness cases: 5,360
– Median days out: 10

Canva
#1. Dietetic technicians
A technician working with an elderly woman on her diet.
– Injury and illness rate: 3,092.9 per 10,000 full-time workers
– Total injury and illness cases: 6,550
– Median days out: 10
This story originally appeared on Westfield and was produced and
distributed in partnership with Stacker Studio.