States with the most drunk driving fatalities
Gorodenkoff // Shutterstock
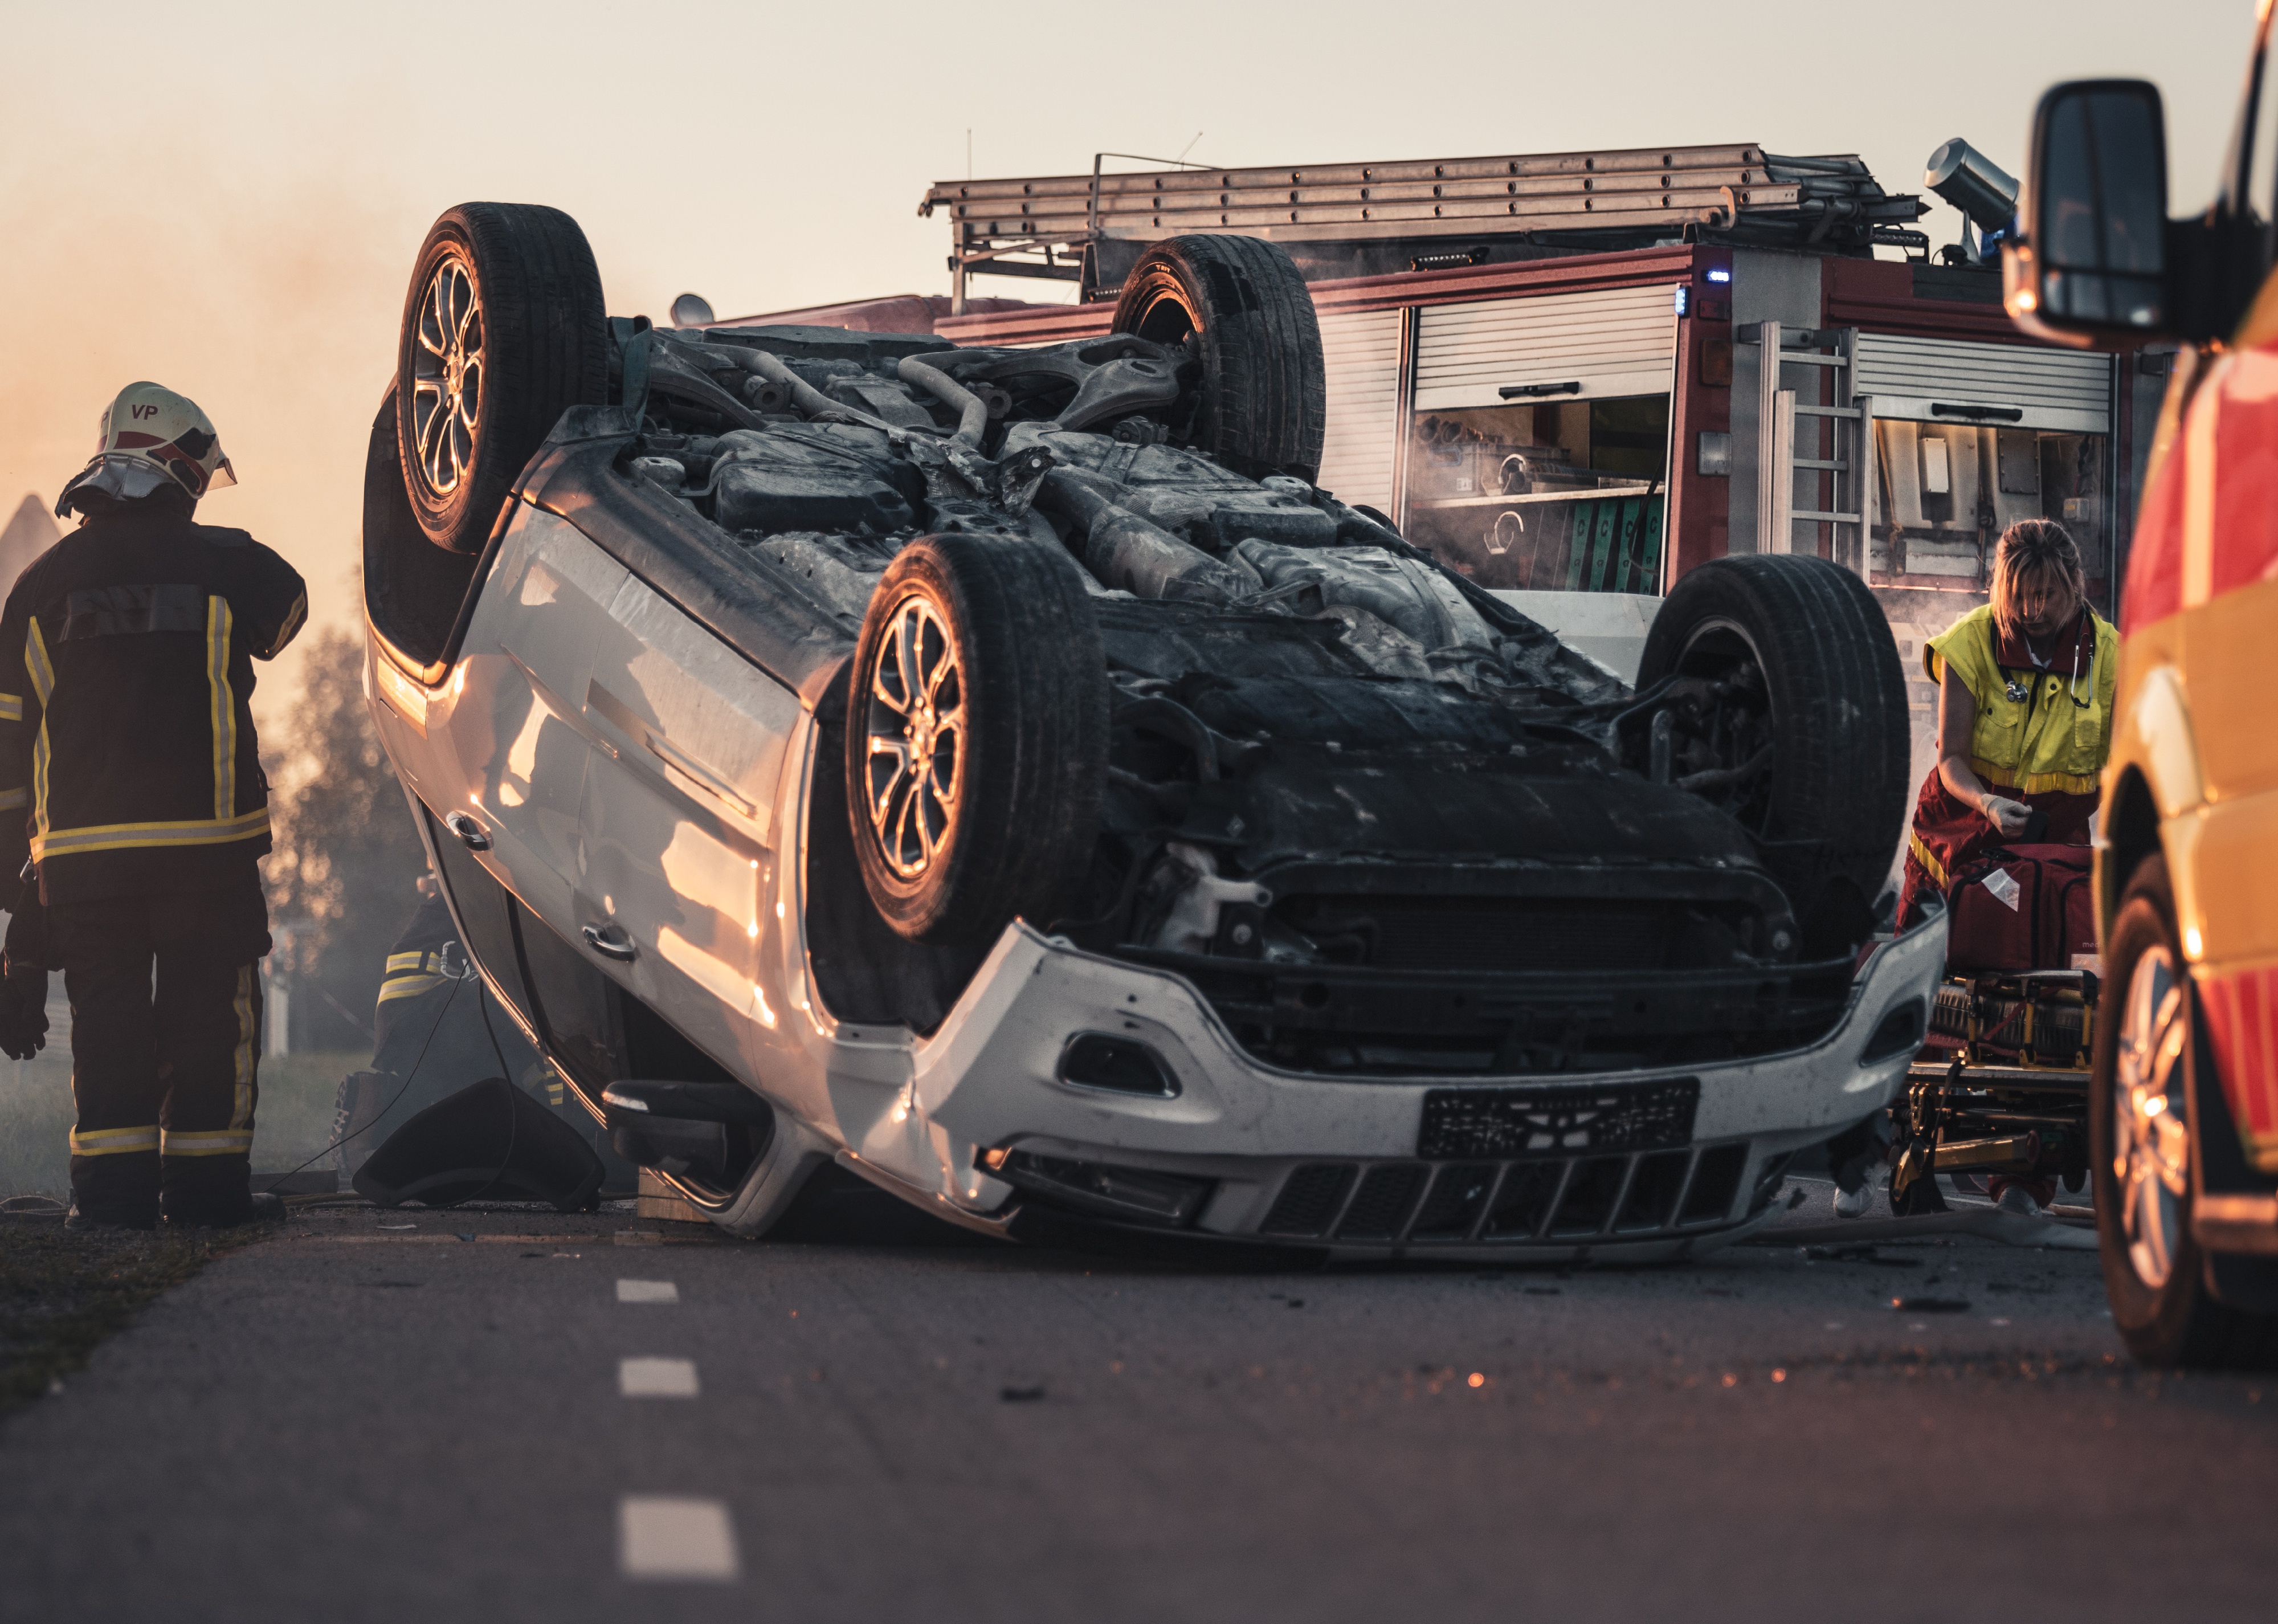
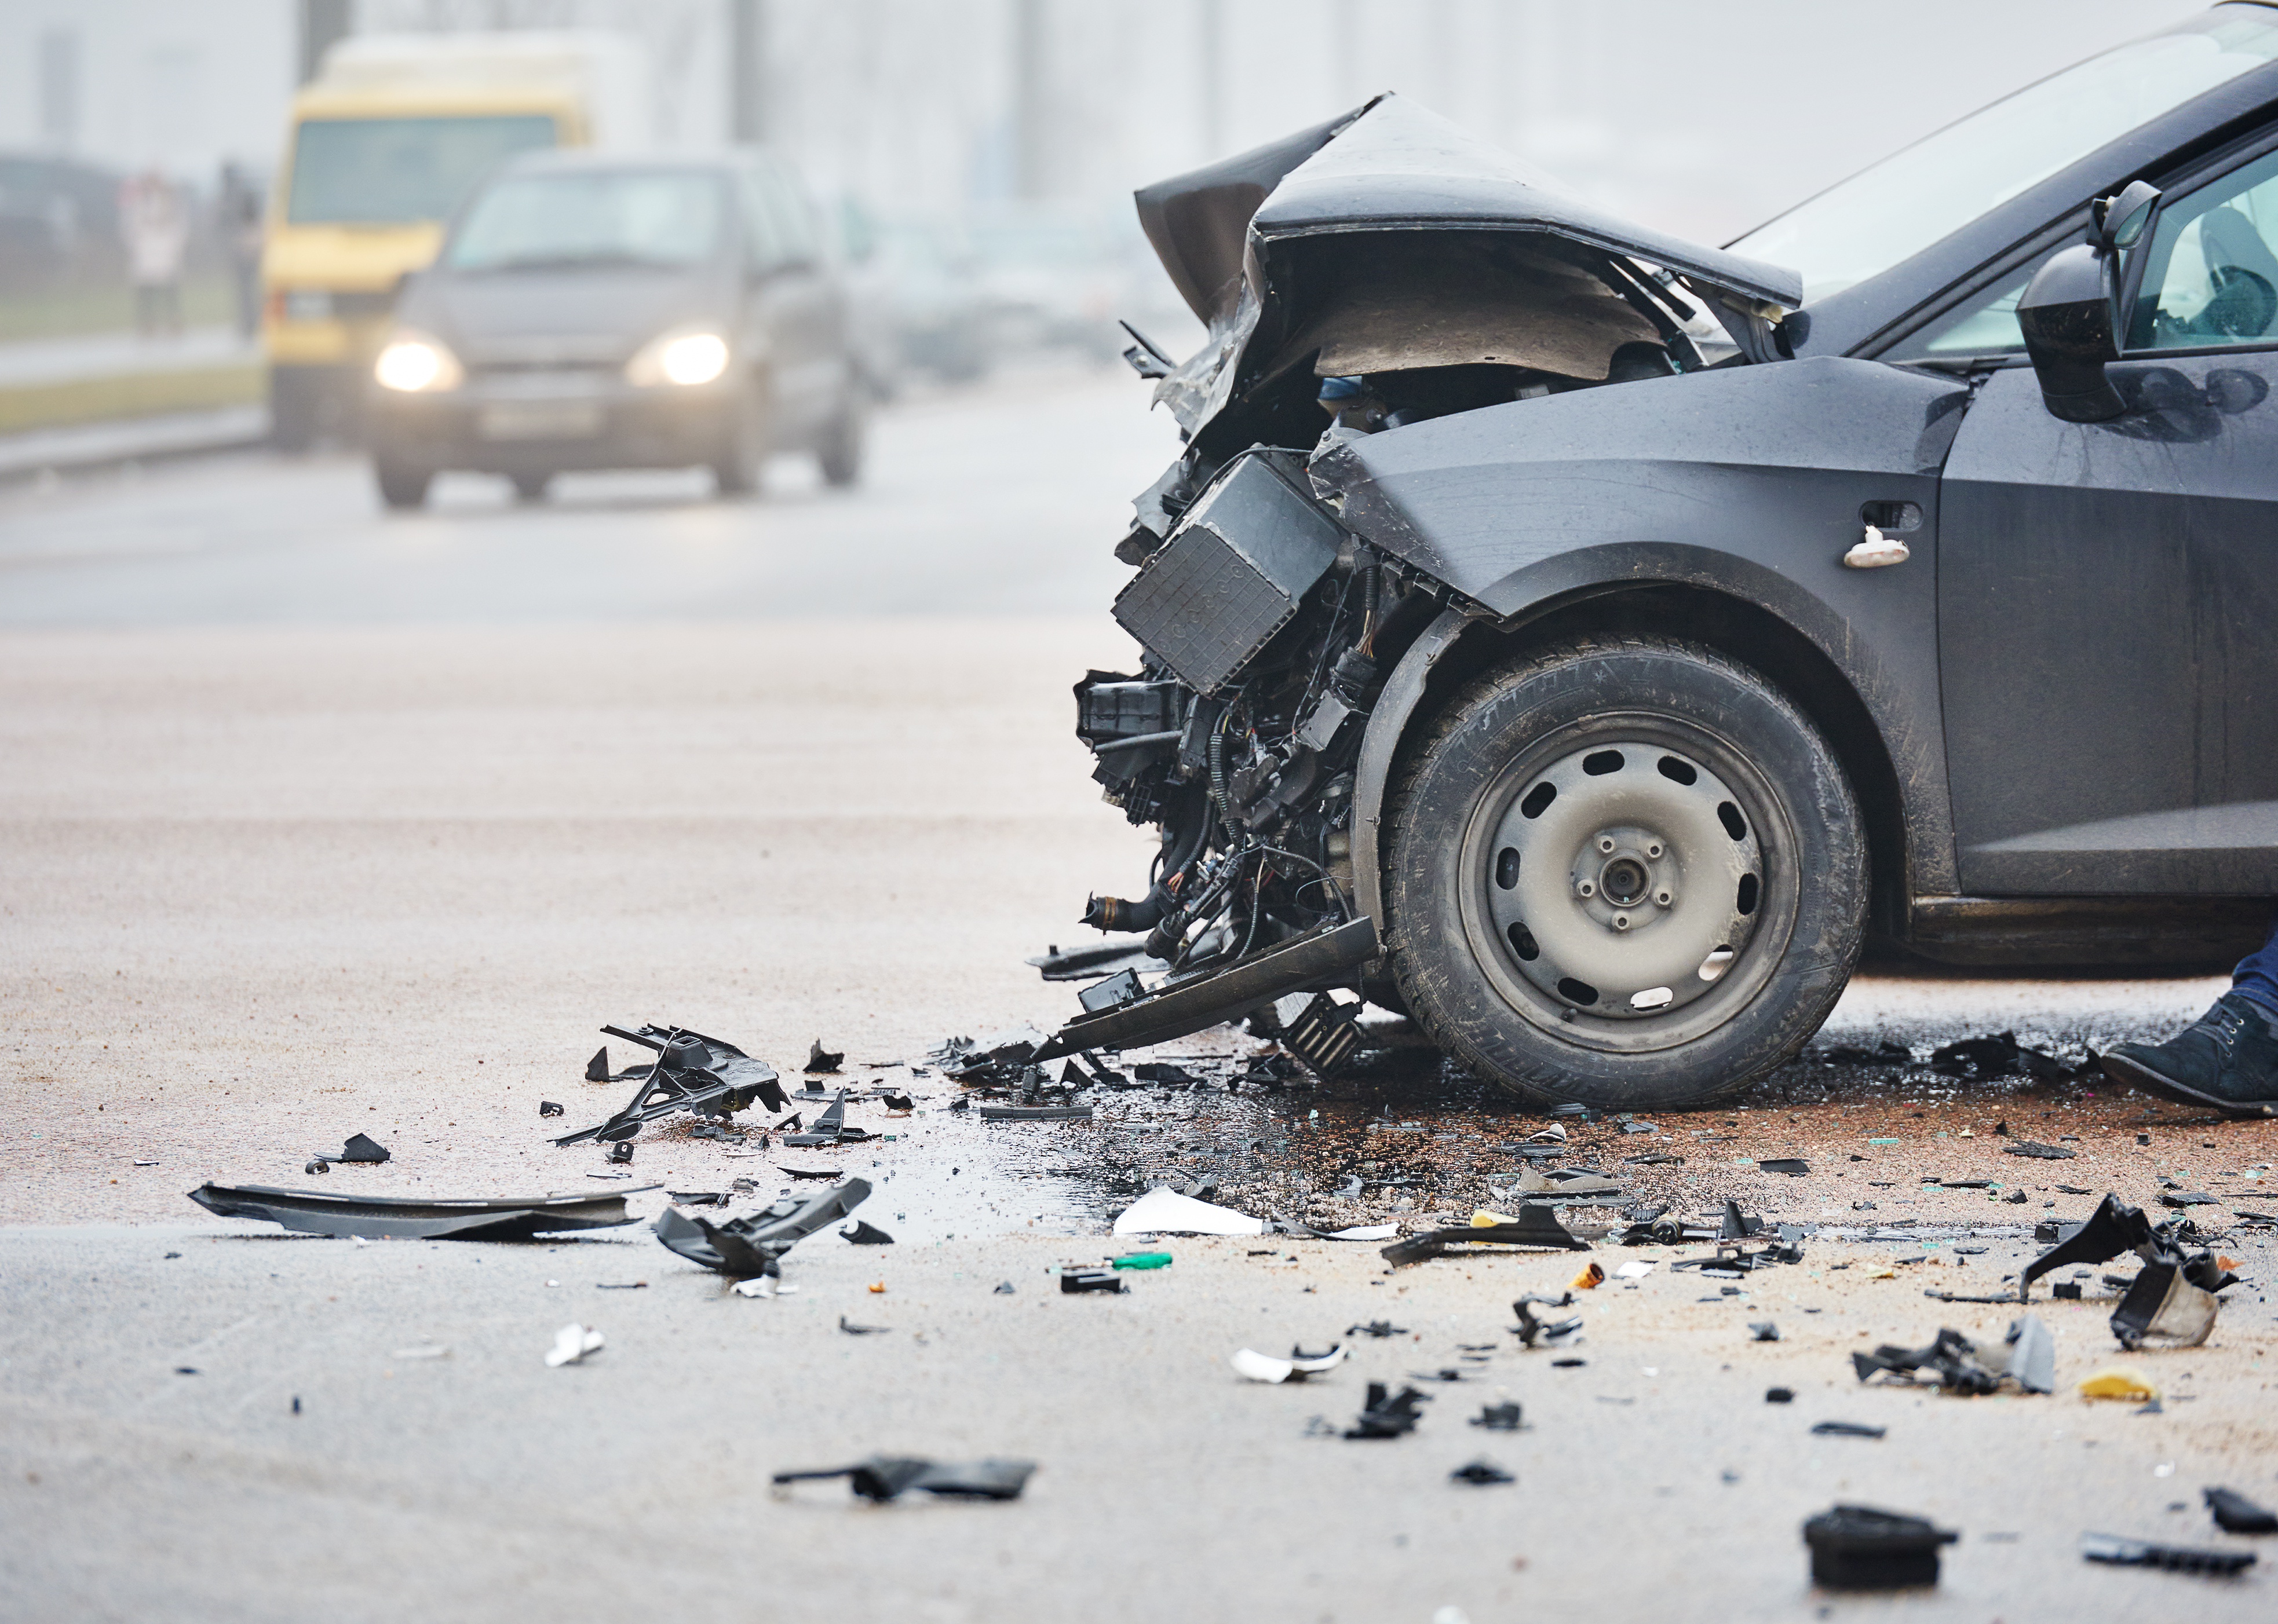
States with the most drunk driving fatalities
Burning vehicle upside down in the middle of the road after collision.
There were an estimated 42,795 fatalities due to motor vehicle crashes in 2022, down by 0.3% from the year prior, according to early estimates released in April 2023 from the National Highway Traffic Safety Administration. While a reduction in crash-related deaths, even one as slight as this, is generally positive, the facts remain deeply concerning: Crash-related deaths rose more than 10% in 2021 and more than 7% the year before that, marking a disturbing trend leading into and persisting through the COVID-19 pandemic.
In 2021, the most recent full year of traffic-death data available, drunken driving fatalities rose by 14% from 2020. Monge and Associates cited data from NHTSA to identify states with the highest rate of fatalities from car accidents involving at least one drunken driver. States are ranked by drunken driving fatalities per 100,000 residents. This rate is listed up to its first decimal point, but the exact ranking of states was determined from the total rate calculation, which did not result in ties.
A blood-alcohol content of .08 or higher is considered impaired. Judgment and driving abilities continue to worsen as BAC levels increase. Laws adopted between 1982 and 1997 throughout most of the U.S. successfully decreased the proportion of DUI-related motor vehicle fatalities in subsequent years.
Alternative transportation programs have also shown some promise in helping to deter drunken driving. Even in areas lacking robust transit options, recent studies suggest that alternatives such as rideshare services like Uber and Lyft can reduce drunken driving-related collisions.
Keep reading to see what percentage of car crash deaths in your state involved drunken driving.
![]()
Kristi Blokhin // Shutterstock
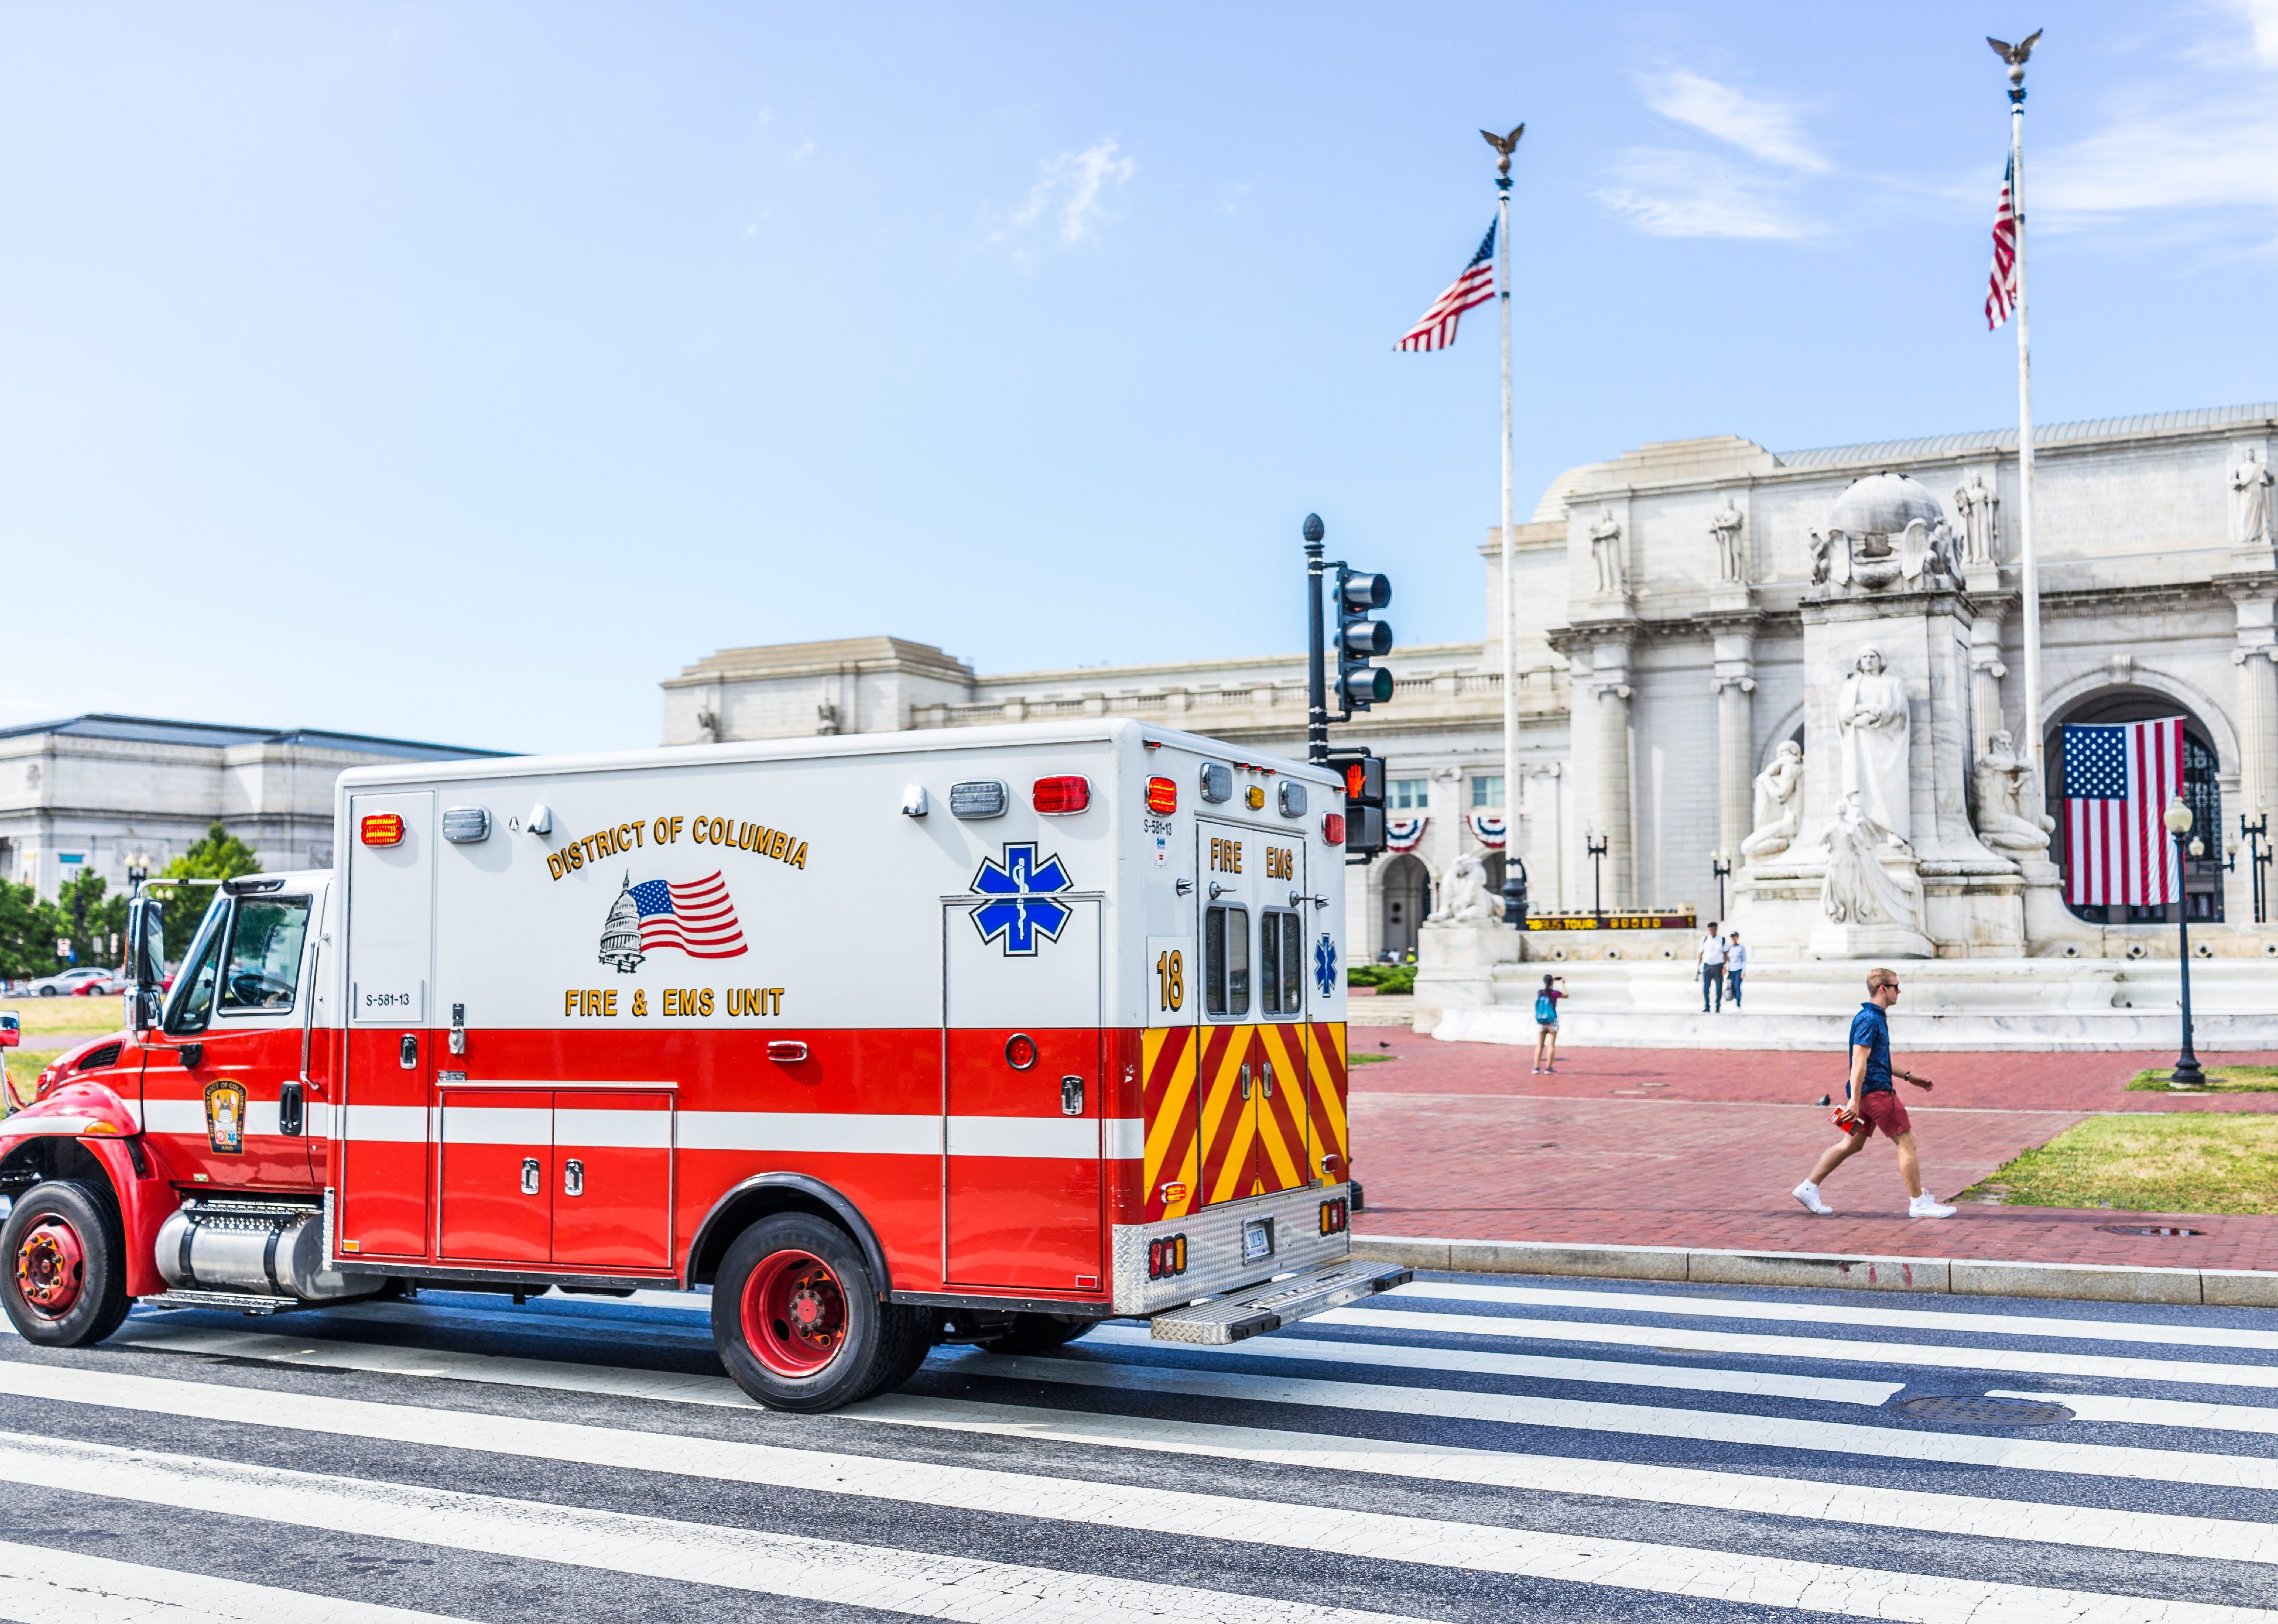
#52. Washington DC
Union Station on Columbus Circle with firetruck and EMS on road.
– Drunken driving fatalities per 100k residents: 1.8 (12, 30% of all car crash fatalities)
– Fatalities involving driver with BAC 0.15 and above: 1.3 per 100K (9, 75% of all drunken driving fatalities)
– Change in drunken driving fatalities from 2012: 300% increase
Andrew F. Kazmierski // Shutterstock
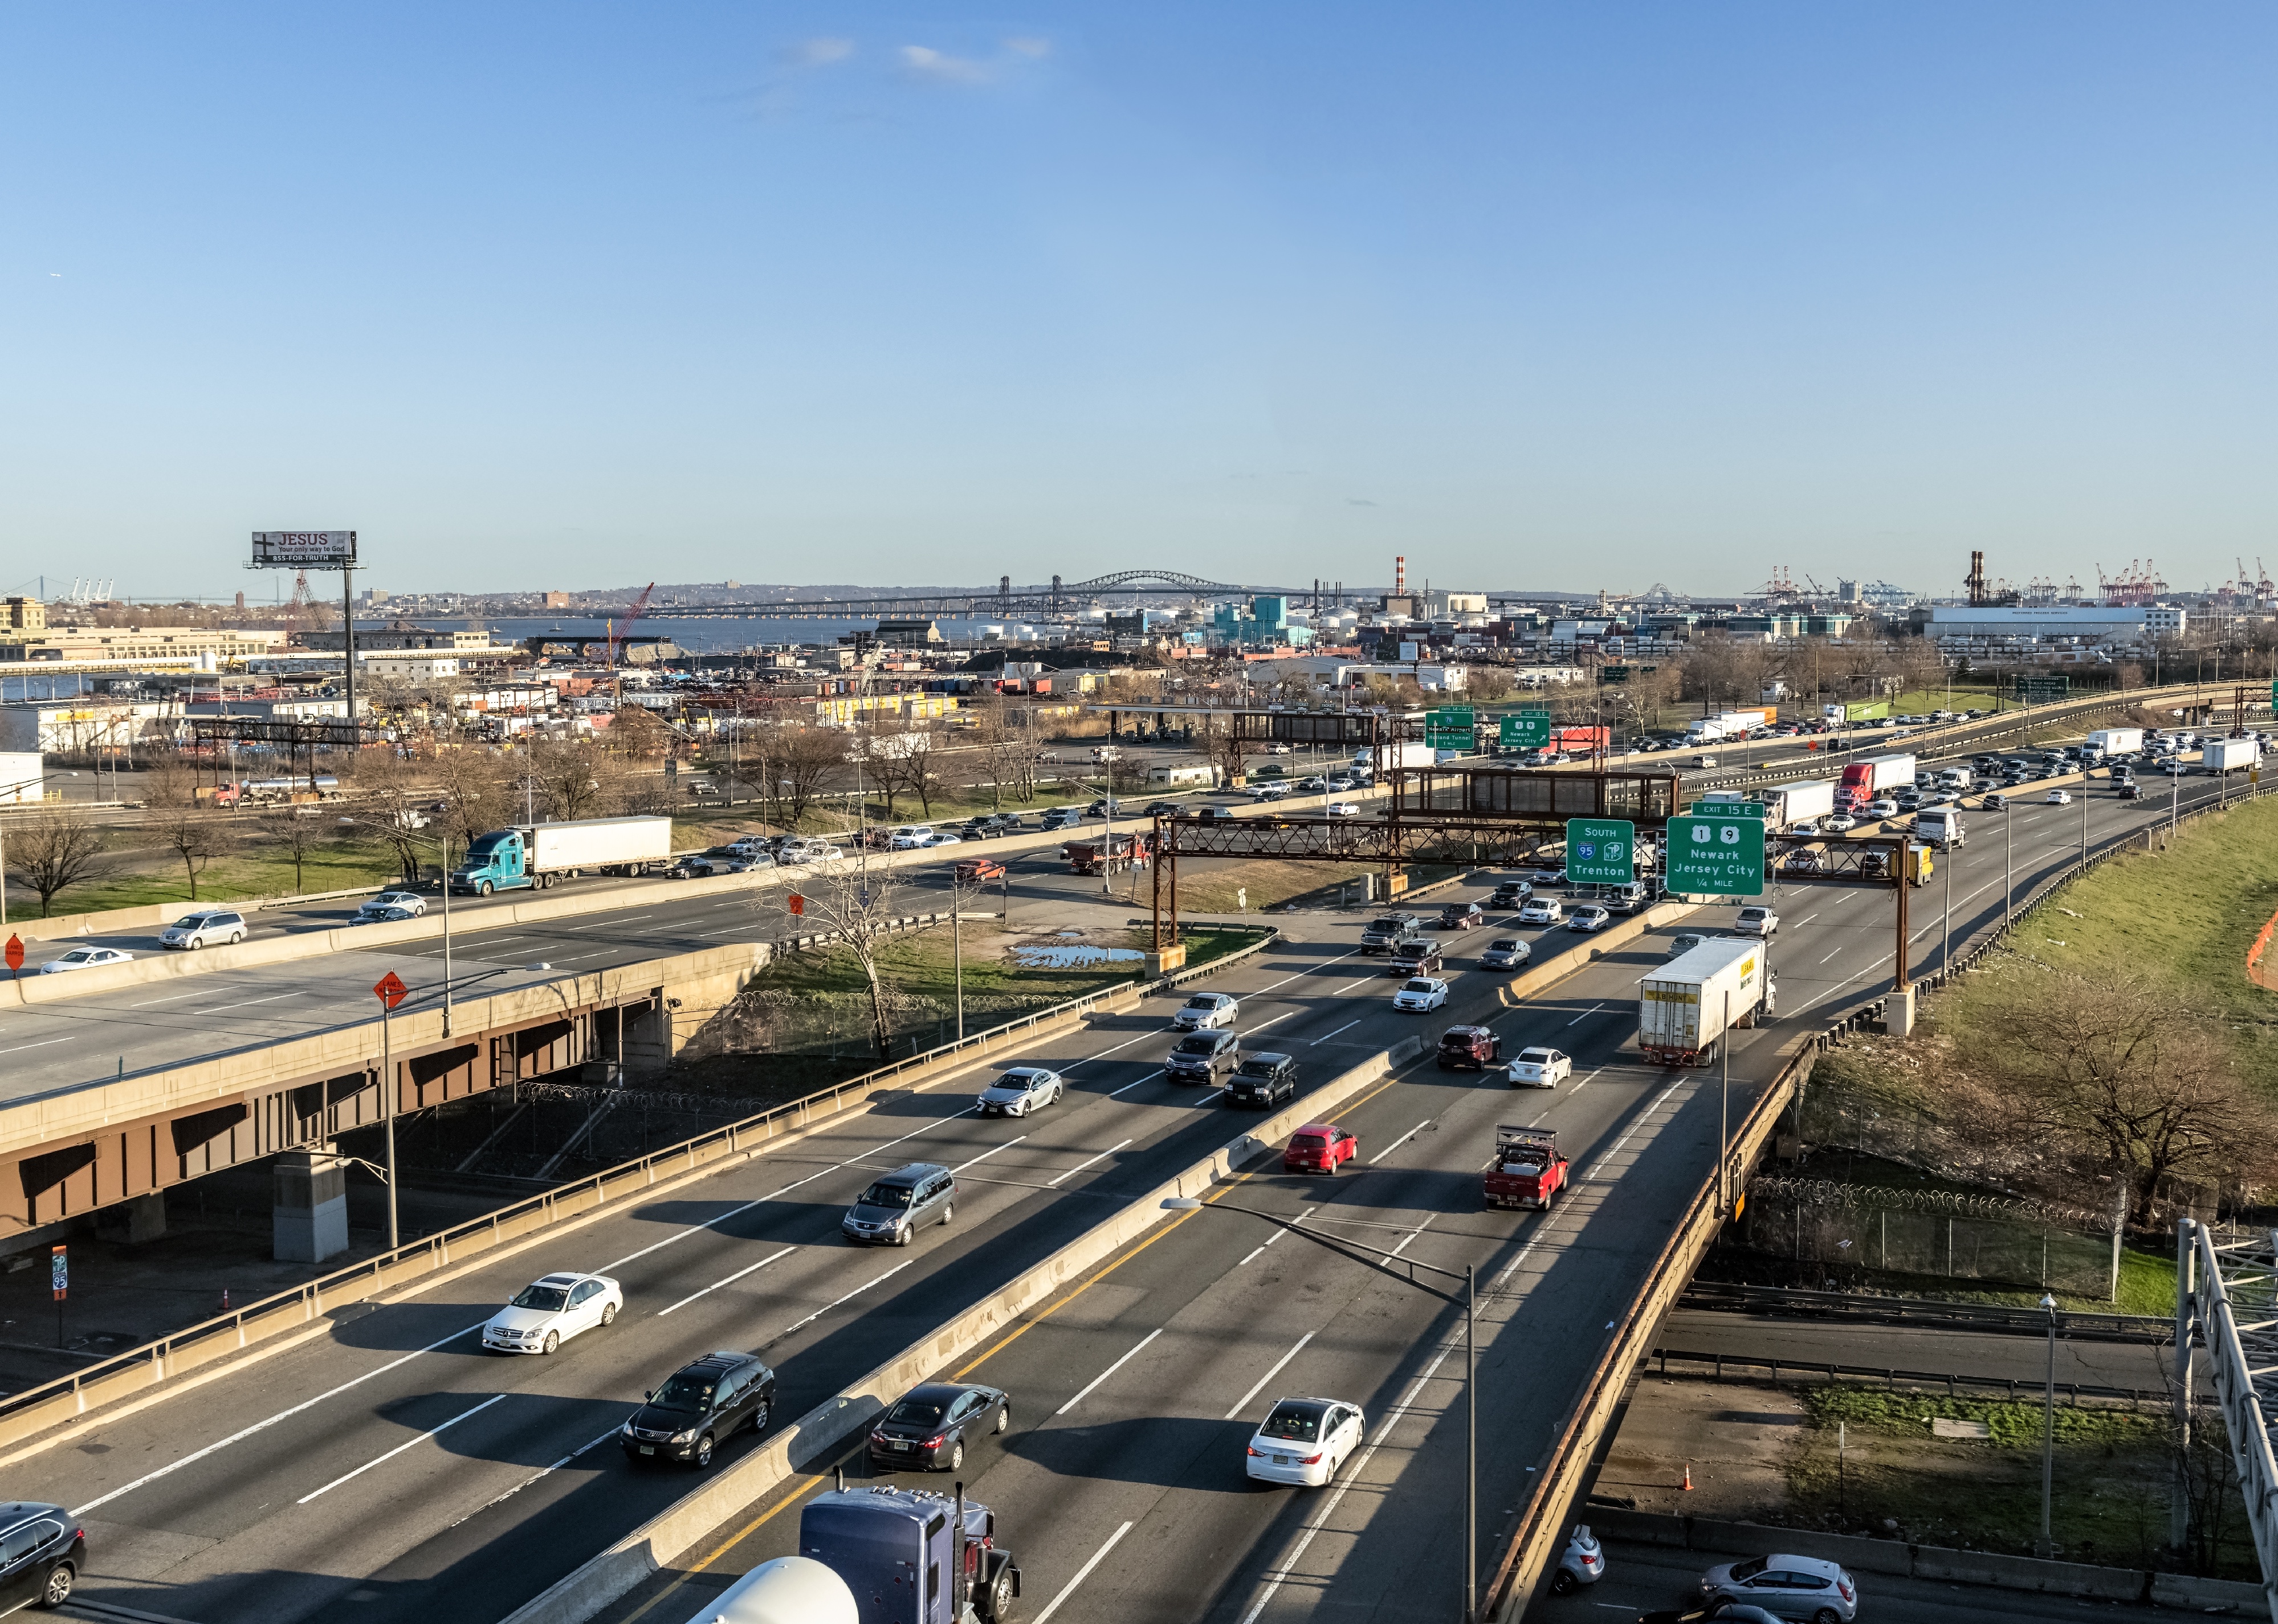
#51. New Jersey
A wide angle view of the New Jersey Turnpike.
– Drunken driving fatalities per 100k residents: 1.9 (178, 25% of all car crash fatalities)
– Fatalities involving driver with BAC 0.15 and above: 1.2 per 100K (114, 64% of all drunken driving fatalities)
– Change in drunken driving fatalities from 2012: 8.5% increase

Adra Keri // Shutterstock
#50. Hawaii
Hawaii road and mountain.
– Drunken driving fatalities per 100k residents: 1.9 (28, 29% of all car crash fatalities)
– Fatalities involving driver with BAC 0.15 and above: 1.0 per 100K (14, 50% of all drunken driving fatalities)
– Change in drunken driving fatalities from 2012: 40.4% decrease
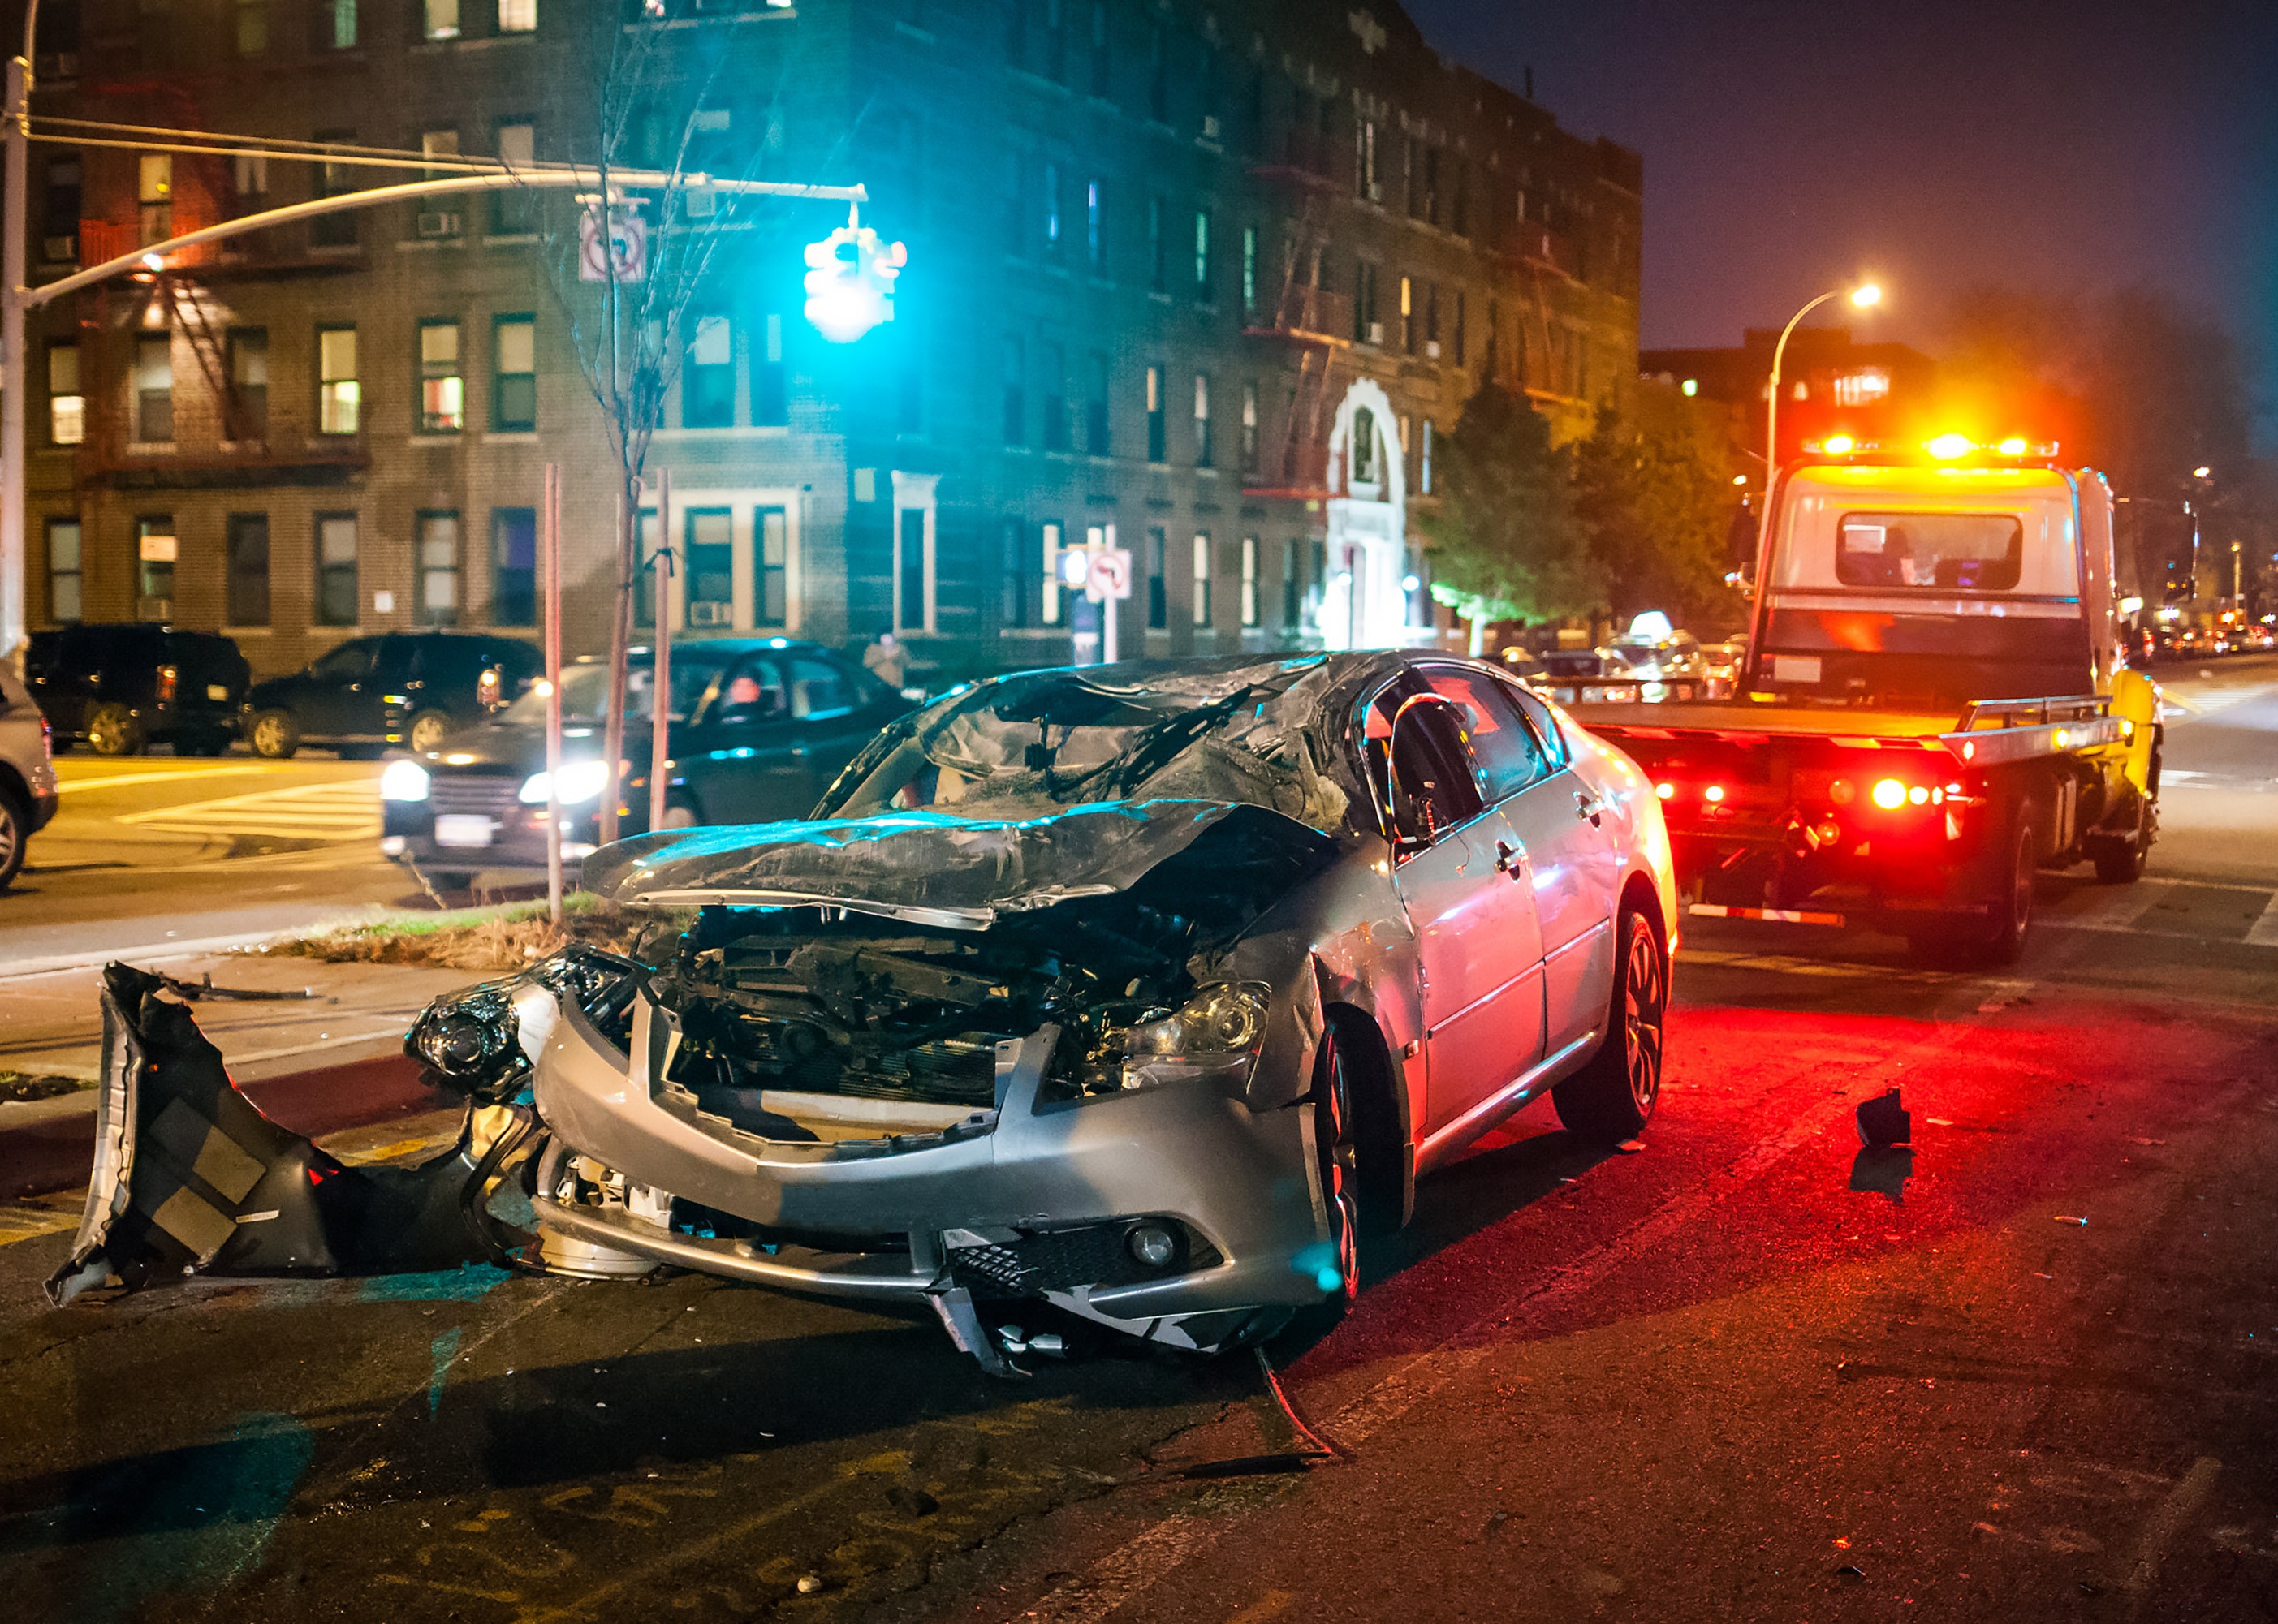
Photo Spirit // Shutterstock
#49. New York
Evening scene of a NYC car crash.
– Drunken driving fatalities per 100k residents: 2.0 (388, 34% of all car crash fatalities)
– Fatalities involving driver with BAC 0.15 and above: 1.3 per 100K (249, 64.2% of all drunken driving fatalities)
– Change in drunken driving fatalities from 2012: 14.1% increase
Tony Dunn // Shutterstock
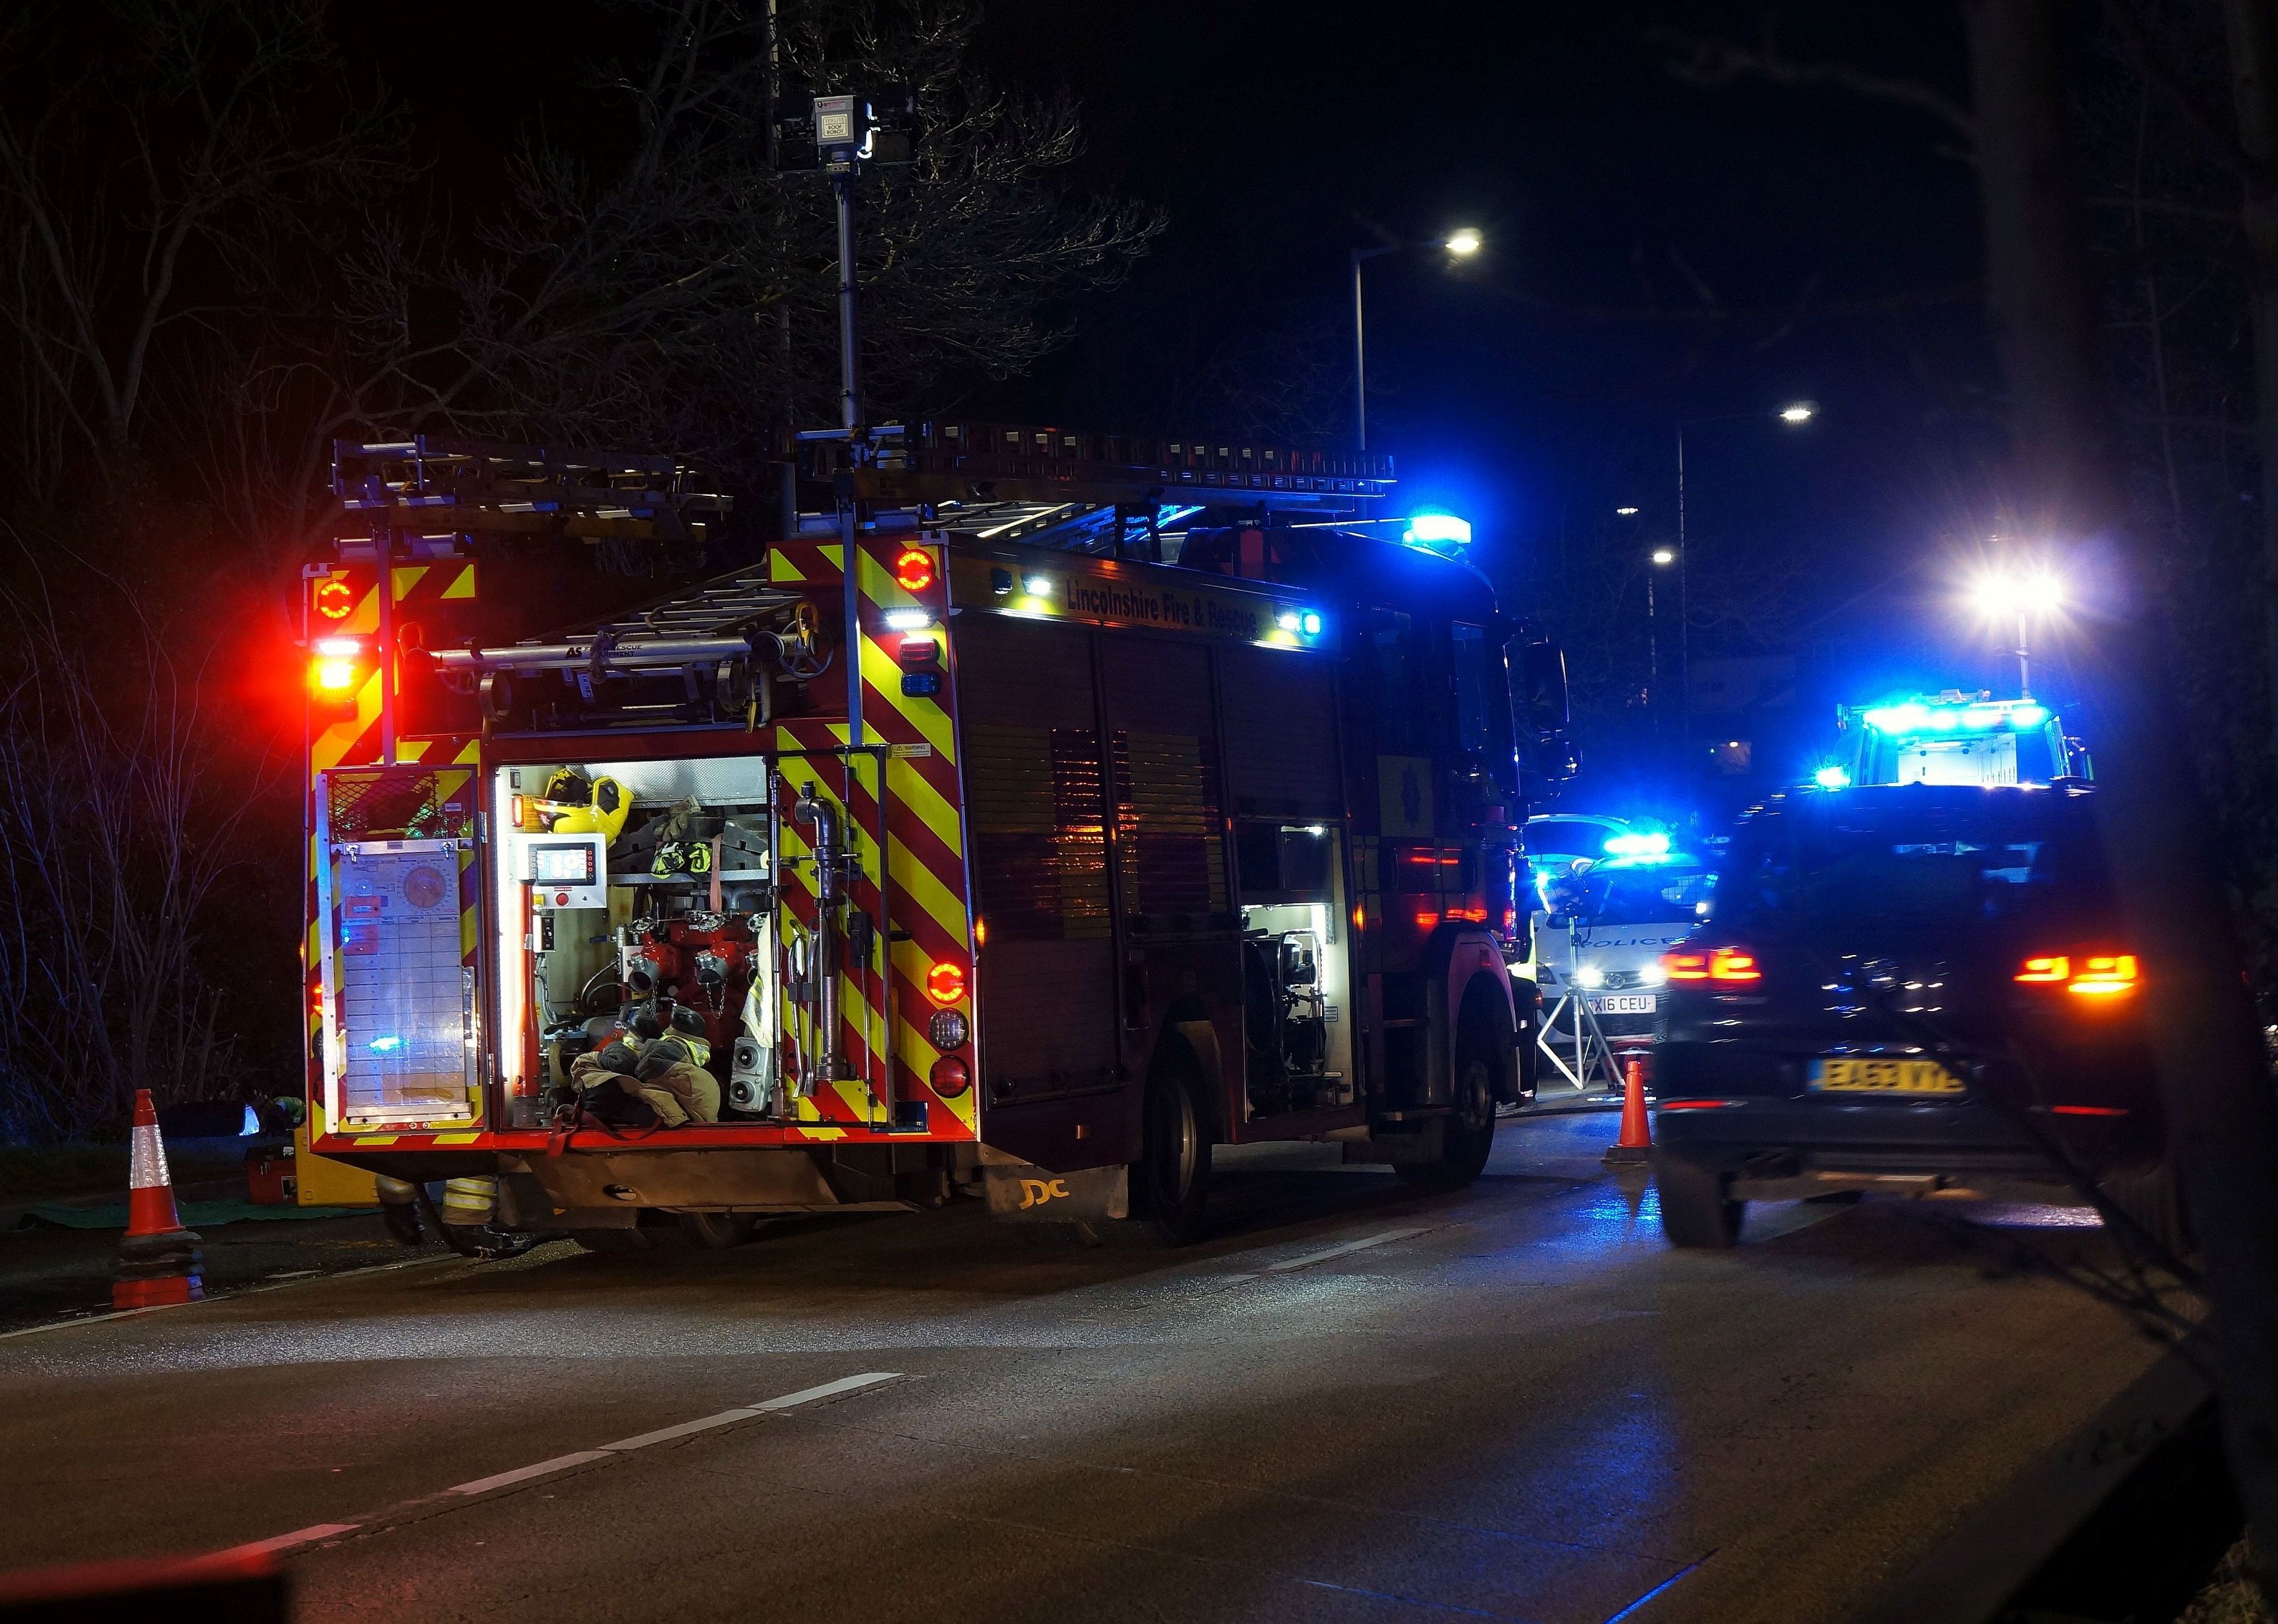
#48. Massachusetts
Scene of an accident at night with flashing lights from emergency vehicles.
– Drunken driving fatalities per 100k residents: 2.1 (150, 36% of all car crash fatalities)
– Fatalities involving driver with BAC 0.15 and above: 1.4 per 100K (95, 63.3% of all drunken driving fatalities)
– Change in drunken driving fatalities from 2012: 16.3% increase
Big Joe // Shutterstock
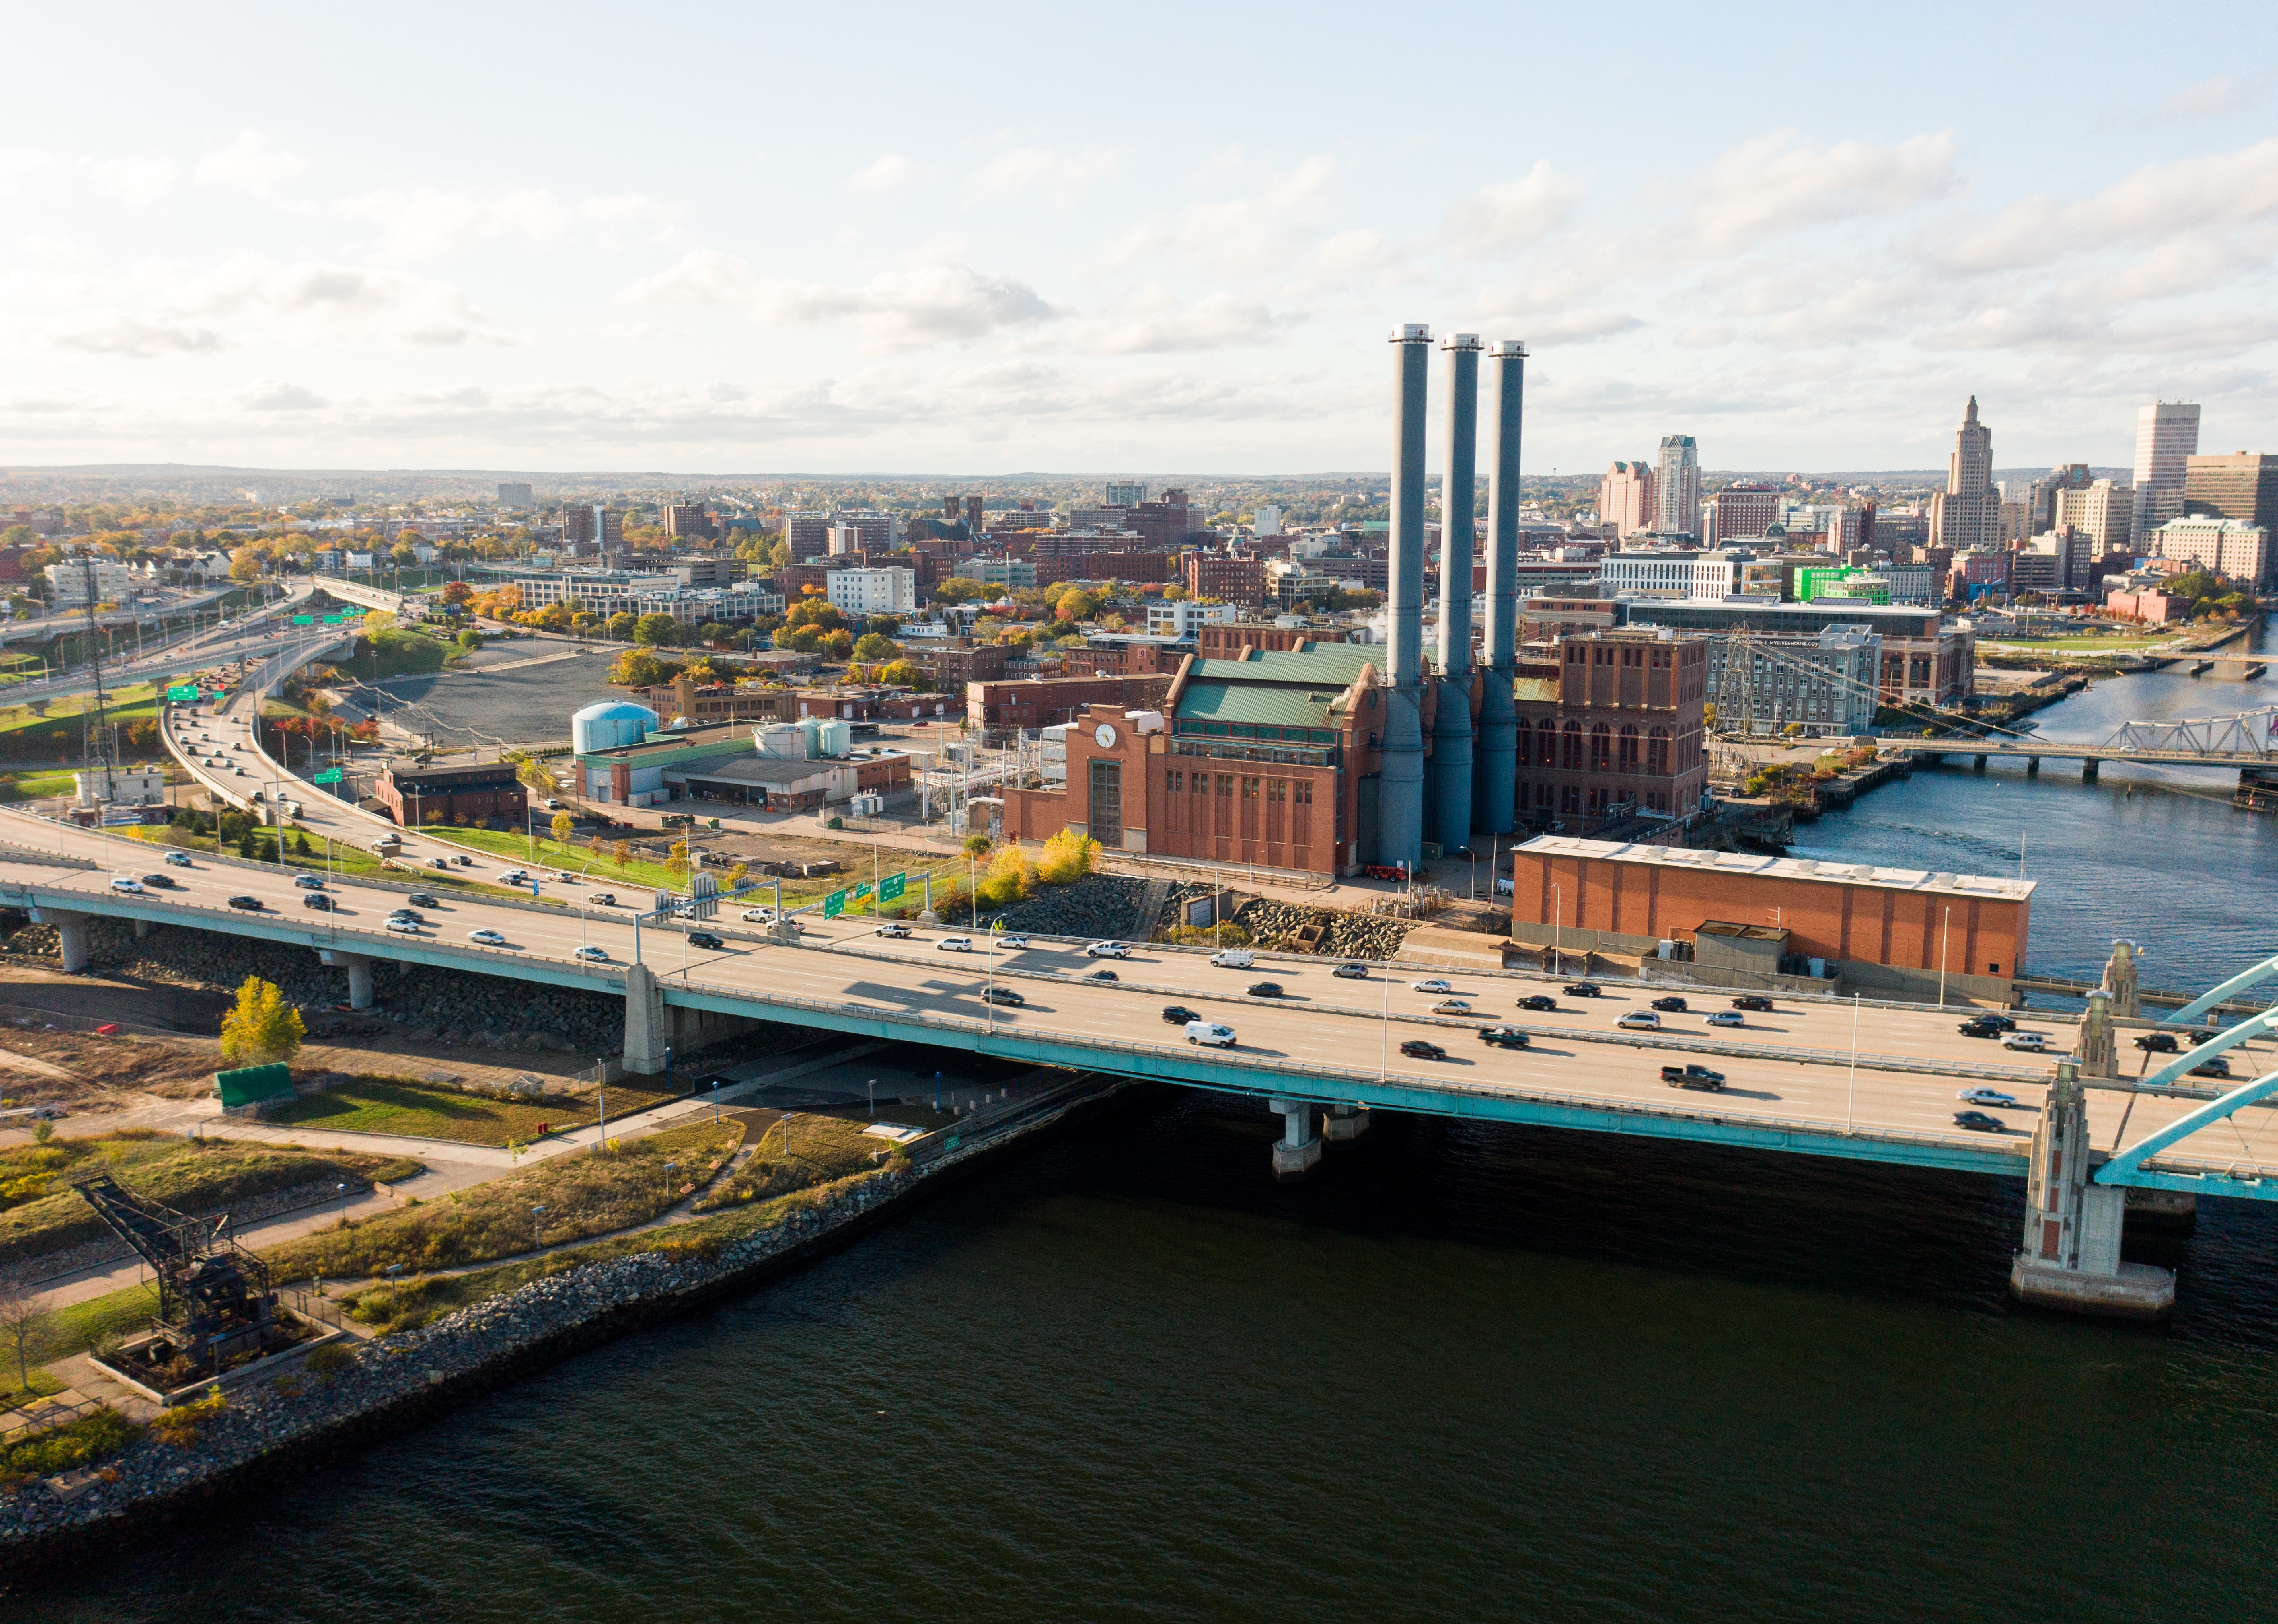
#47. Rhode Island
Aerial of a highway in Providence.
– Drunken driving fatalities per 100k residents: 2.2 (24, 39% of all car crash fatalities)
– Fatalities involving driver with BAC 0.15 and above: 1.6 per 100K (18, 75% of all drunken driving fatalities)
– Change in drunken driving fatalities from 2012: 14.3% decrease

Steve Skjold // Shutterstock
#46. Minnesota
Car damaged in an accident on a city street.
– Drunken driving fatalities per 100k residents: 2.3 (130, 27% of all car crash fatalities)
– Fatalities involving driver with BAC 0.15 and above: 1.6 per 100K (90, 69.2% of all drunken driving fatalities)
– Change in drunken driving fatalities from 2012: 14% increase

Bob Pool // Shutterstock
#45. Utah
Interstate Highway 15 in Provo with Mount Timpanogos in background.
– Drunken driving fatalities per 100k residents: 2.4 (79, 24% of all car crash fatalities)
– Fatalities involving driver with BAC 0.15 and above: 1.6 per 100K (52, 65.8% of all drunken driving fatalities)
– Change in drunken driving fatalities from 2012: 146.9% increase

Andriy Blokhin // Shutterstock
#44. Pennsylvania
Car accident on interstate highway road 83 with fire engine truck.
– Drunken driving fatalities per 100k residents: 2.6 (337, 27% of all car crash fatalities)
– Fatalities involving driver with BAC 0.15 and above: 1.7 per 100K (221, 65.6% of all drunken driving fatalities)
– Change in drunken driving fatalities from 2012: 17.2% decrease

O.C Ritz // Shutterstock
#43. Alaska
Wrecked car on the side of the road after collision in Alaska.
– Drunken driving fatalities per 100k residents: 3.0 (22, 33% of all car crash fatalities)
– Fatalities involving driver with BAC 0.15 and above: 1.9 per 100K (14, 63.6% of all drunken driving fatalities)
– Change in drunken driving fatalities from 2012: 46.7% increase
Sean Pavone // Shutterstock
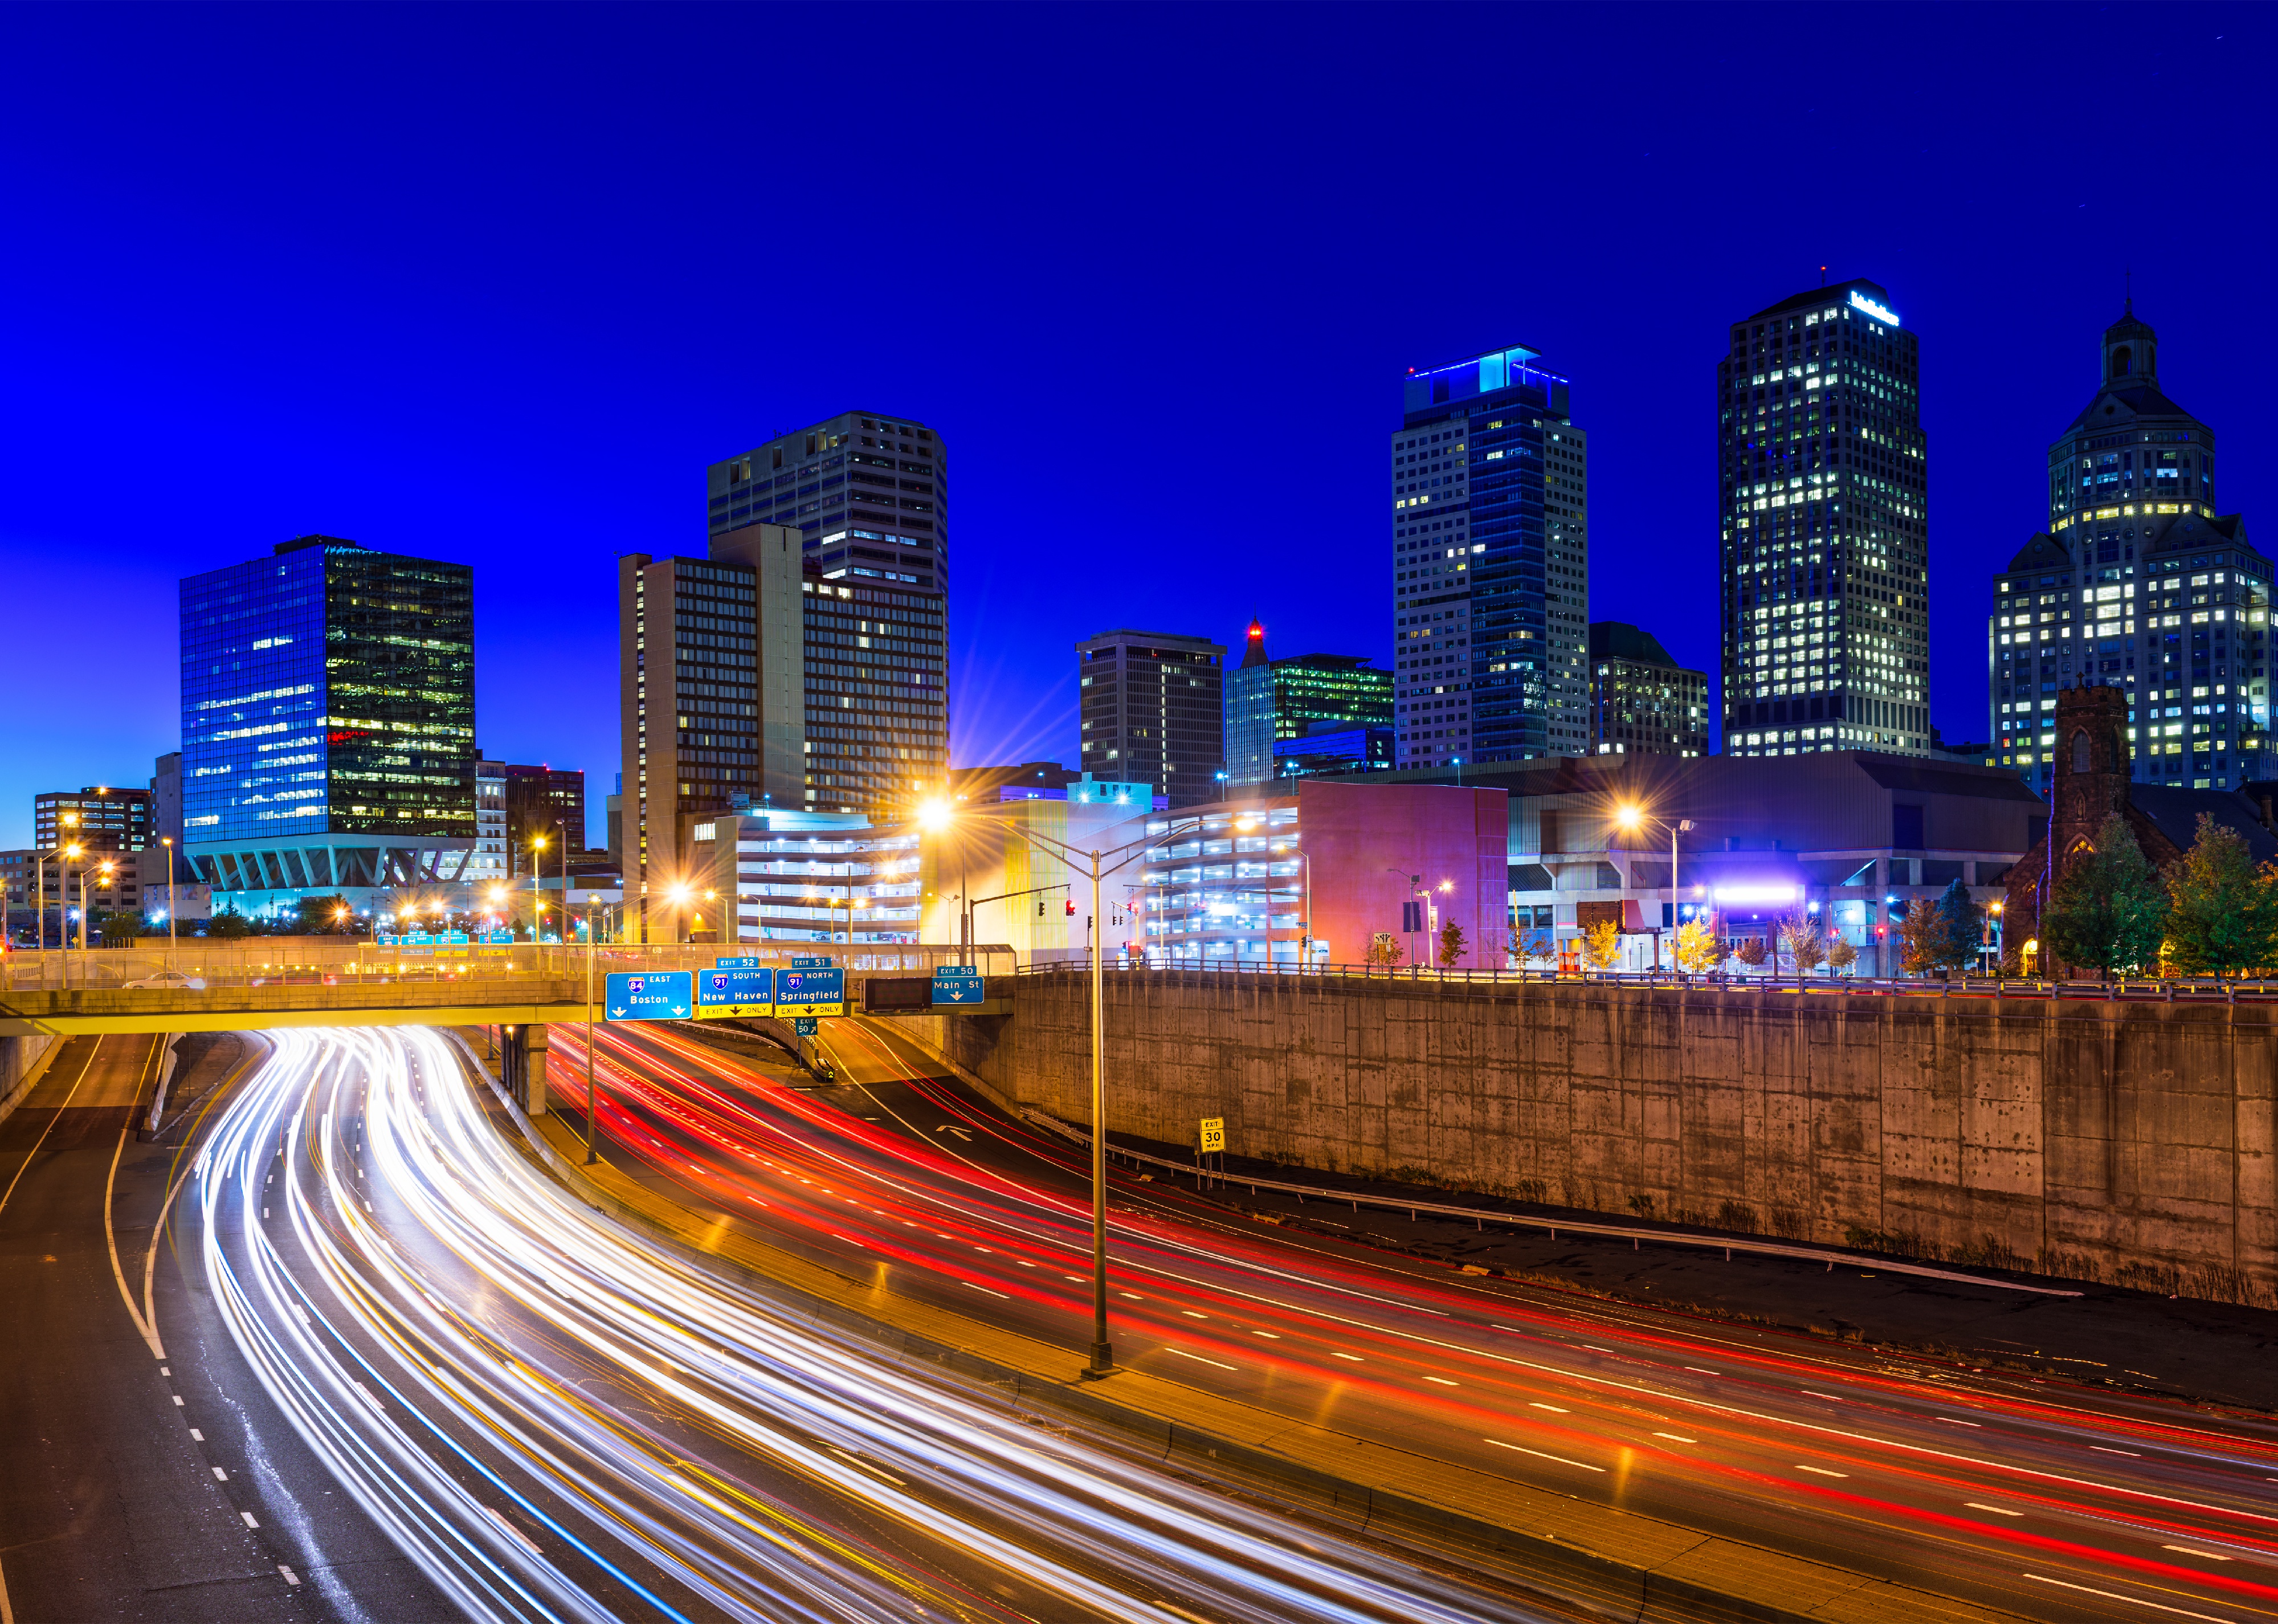
#42. Connecticut
Hartford highway and skyline.
– Drunken driving fatalities per 100k residents: 3.1 (112, 38% of all car crash fatalities)
– Fatalities involving driver with BAC 0.15 and above: 2.0 per 100K (73, 65.2% of all drunken driving fatalities)
– Change in drunken driving fatalities from 2012: 12% increase
Suraju Kehinde // Shutterstock
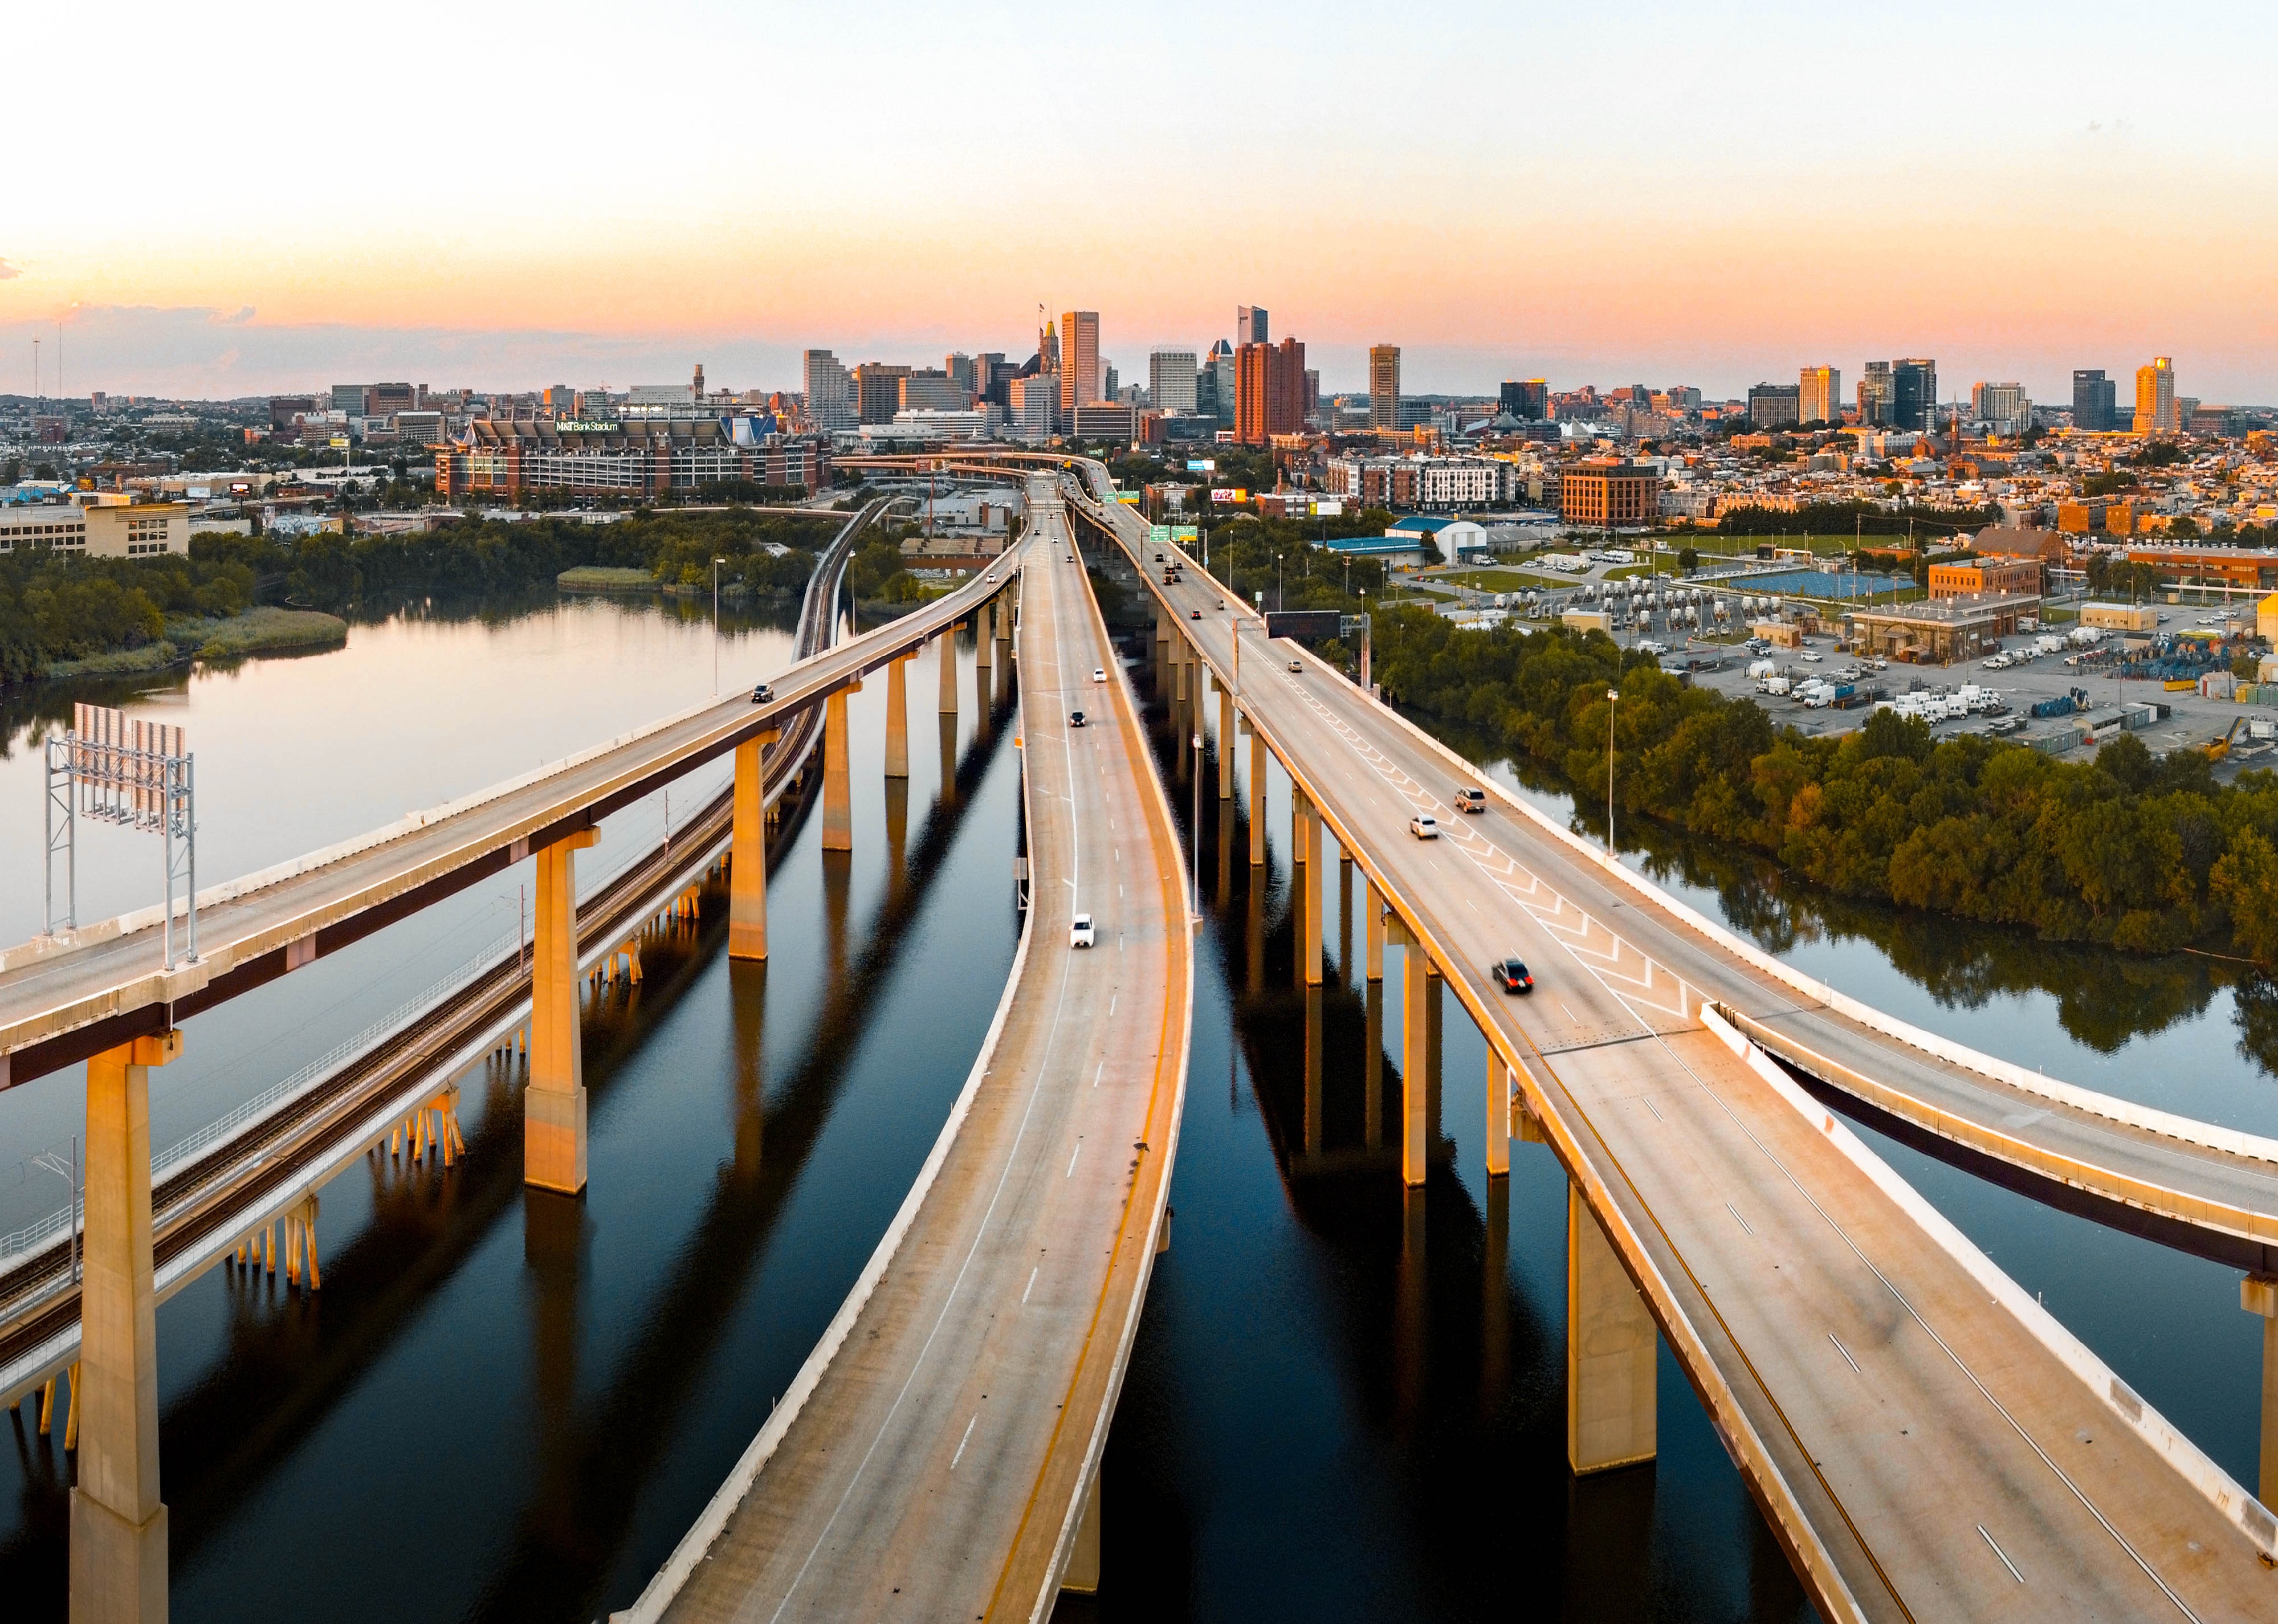
#41. Maryland
Baltimore City seen from the sky by the highway.
– Drunken driving fatalities per 100k residents: 3.2 (195, 35% of all car crash fatalities)
– Fatalities involving driver with BAC 0.15 and above: 2.0 per 100K (124, 63.6% of all drunken driving fatalities)
– Change in drunken driving fatalities from 2012: 19.6% increase
Real Window Creative // Shutterstock
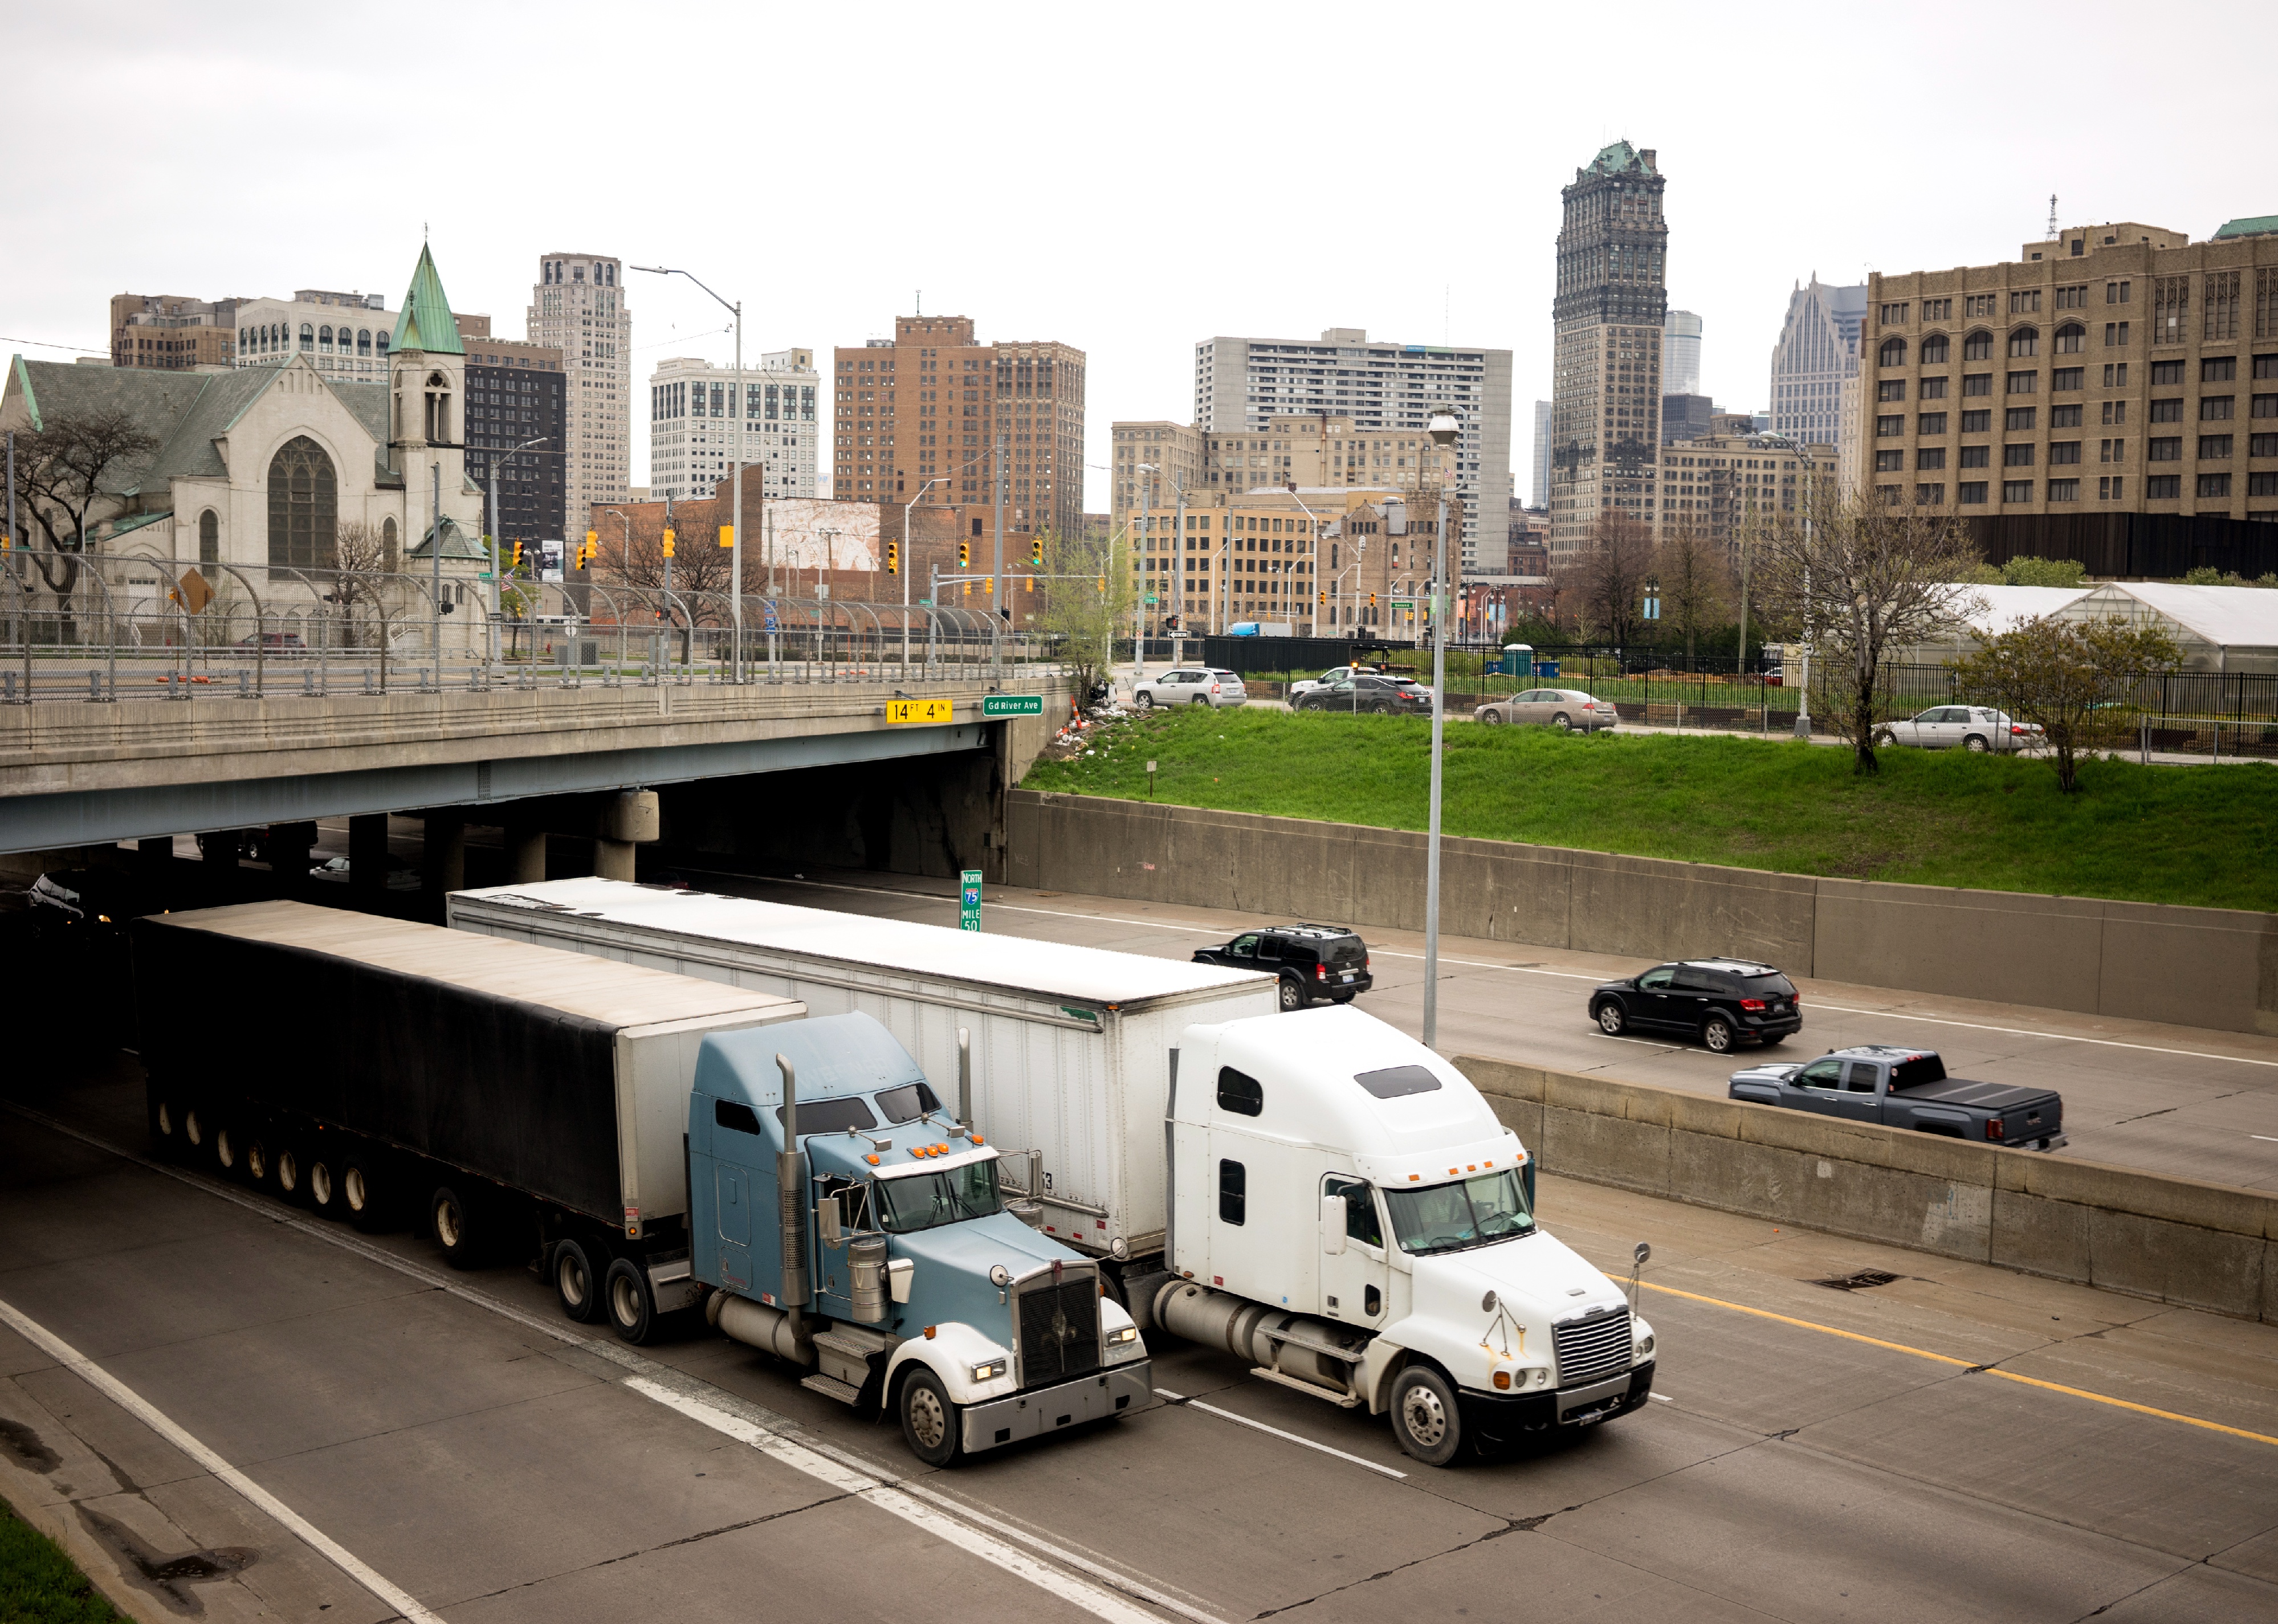
#40. Michigan
Interstate traffic in Detroit.
– Drunken driving fatalities per 100k residents: 3.2 (325, 29% of all car crash fatalities)
– Fatalities involving driver with BAC 0.15 and above: 2.2 per 100K (219, 67.4% of all drunken driving fatalities)
– Change in drunken driving fatalities from 2012: 24.5% increase
Alizada Studios // Shutterstock
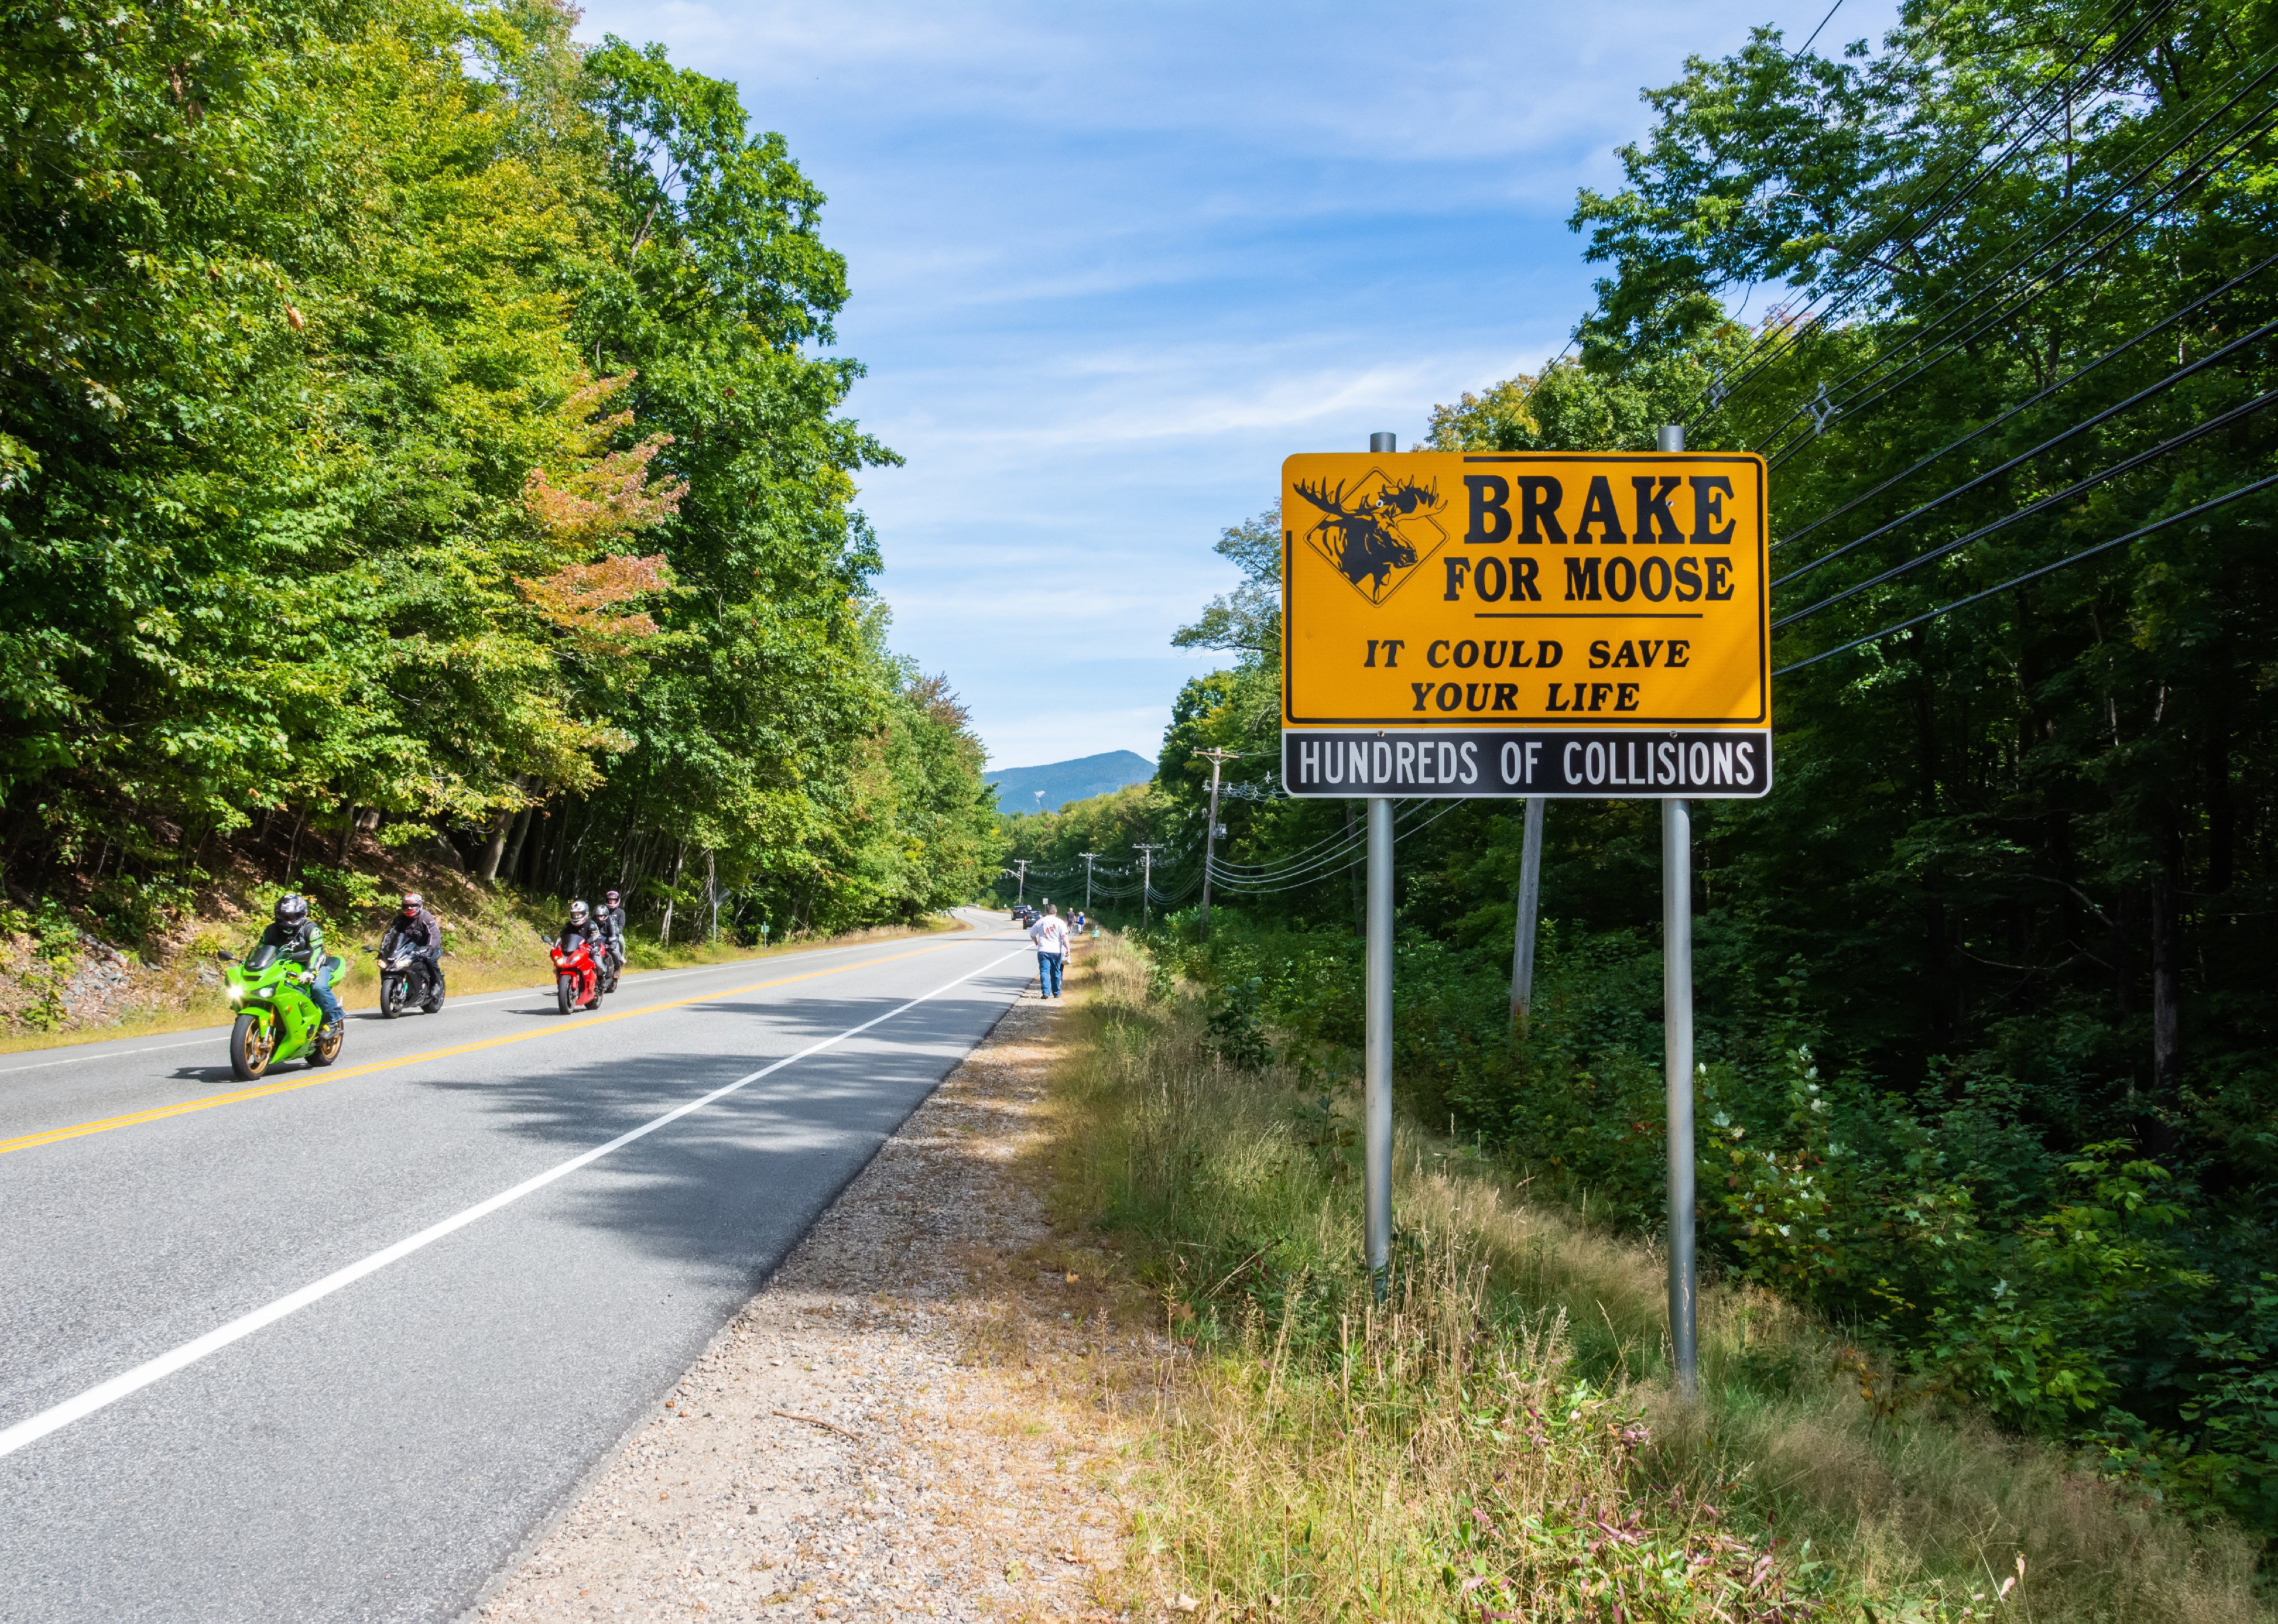
#39. New Hampshire
View along the Kancamagus Highway in the White Mountain National Forest.
– Drunken driving fatalities per 100k residents: 3.2 (45, 38% of all car crash fatalities)
– Fatalities involving driver with BAC 0.15 and above: 2.2 per 100K (31, 68.9% of all drunken driving fatalities)
– Change in drunken driving fatalities from 2012: 40.6% increase

Kristi Blokhin // Shutterstock
#38. Virginia
Traffic on interstate highway I-66 in Virginia.
– Drunken driving fatalities per 100k residents: 3.2 (281, 29% of all car crash fatalities)
– Fatalities involving driver with BAC 0.15 and above: 2.2 per 100K (187, 66.5% of all drunken driving fatalities)
– Change in drunken driving fatalities from 2012: 34.4% increase

Ronald Rampsch // Shutterstock
#37. Maine
Traffic accident at an intersection.
– Drunken driving fatalities per 100k residents: 3.3 (45, 29% of all car crash fatalities)
– Fatalities involving driver with BAC 0.15 and above: 2.5 per 100K (35, 77.8% of all drunken driving fatalities)
– Change in drunken driving fatalities from 2012: 10% decrease

Sandra Foyt // Shutterstock
#36. Nebraska
Interstate 80 highway seen from overlook at Great Platte River Road Archway Monument Museum.
– Drunken driving fatalities per 100k residents: 3.3 (65, 29% of all car crash fatalities)
– Fatalities involving driver with BAC 0.15 and above: 2.2 per 100K (44, 67.7% of all drunken driving fatalities)
– Change in drunken driving fatalities from 2012: 11% decrease
Khairil Azhar Junos // Shutterstock
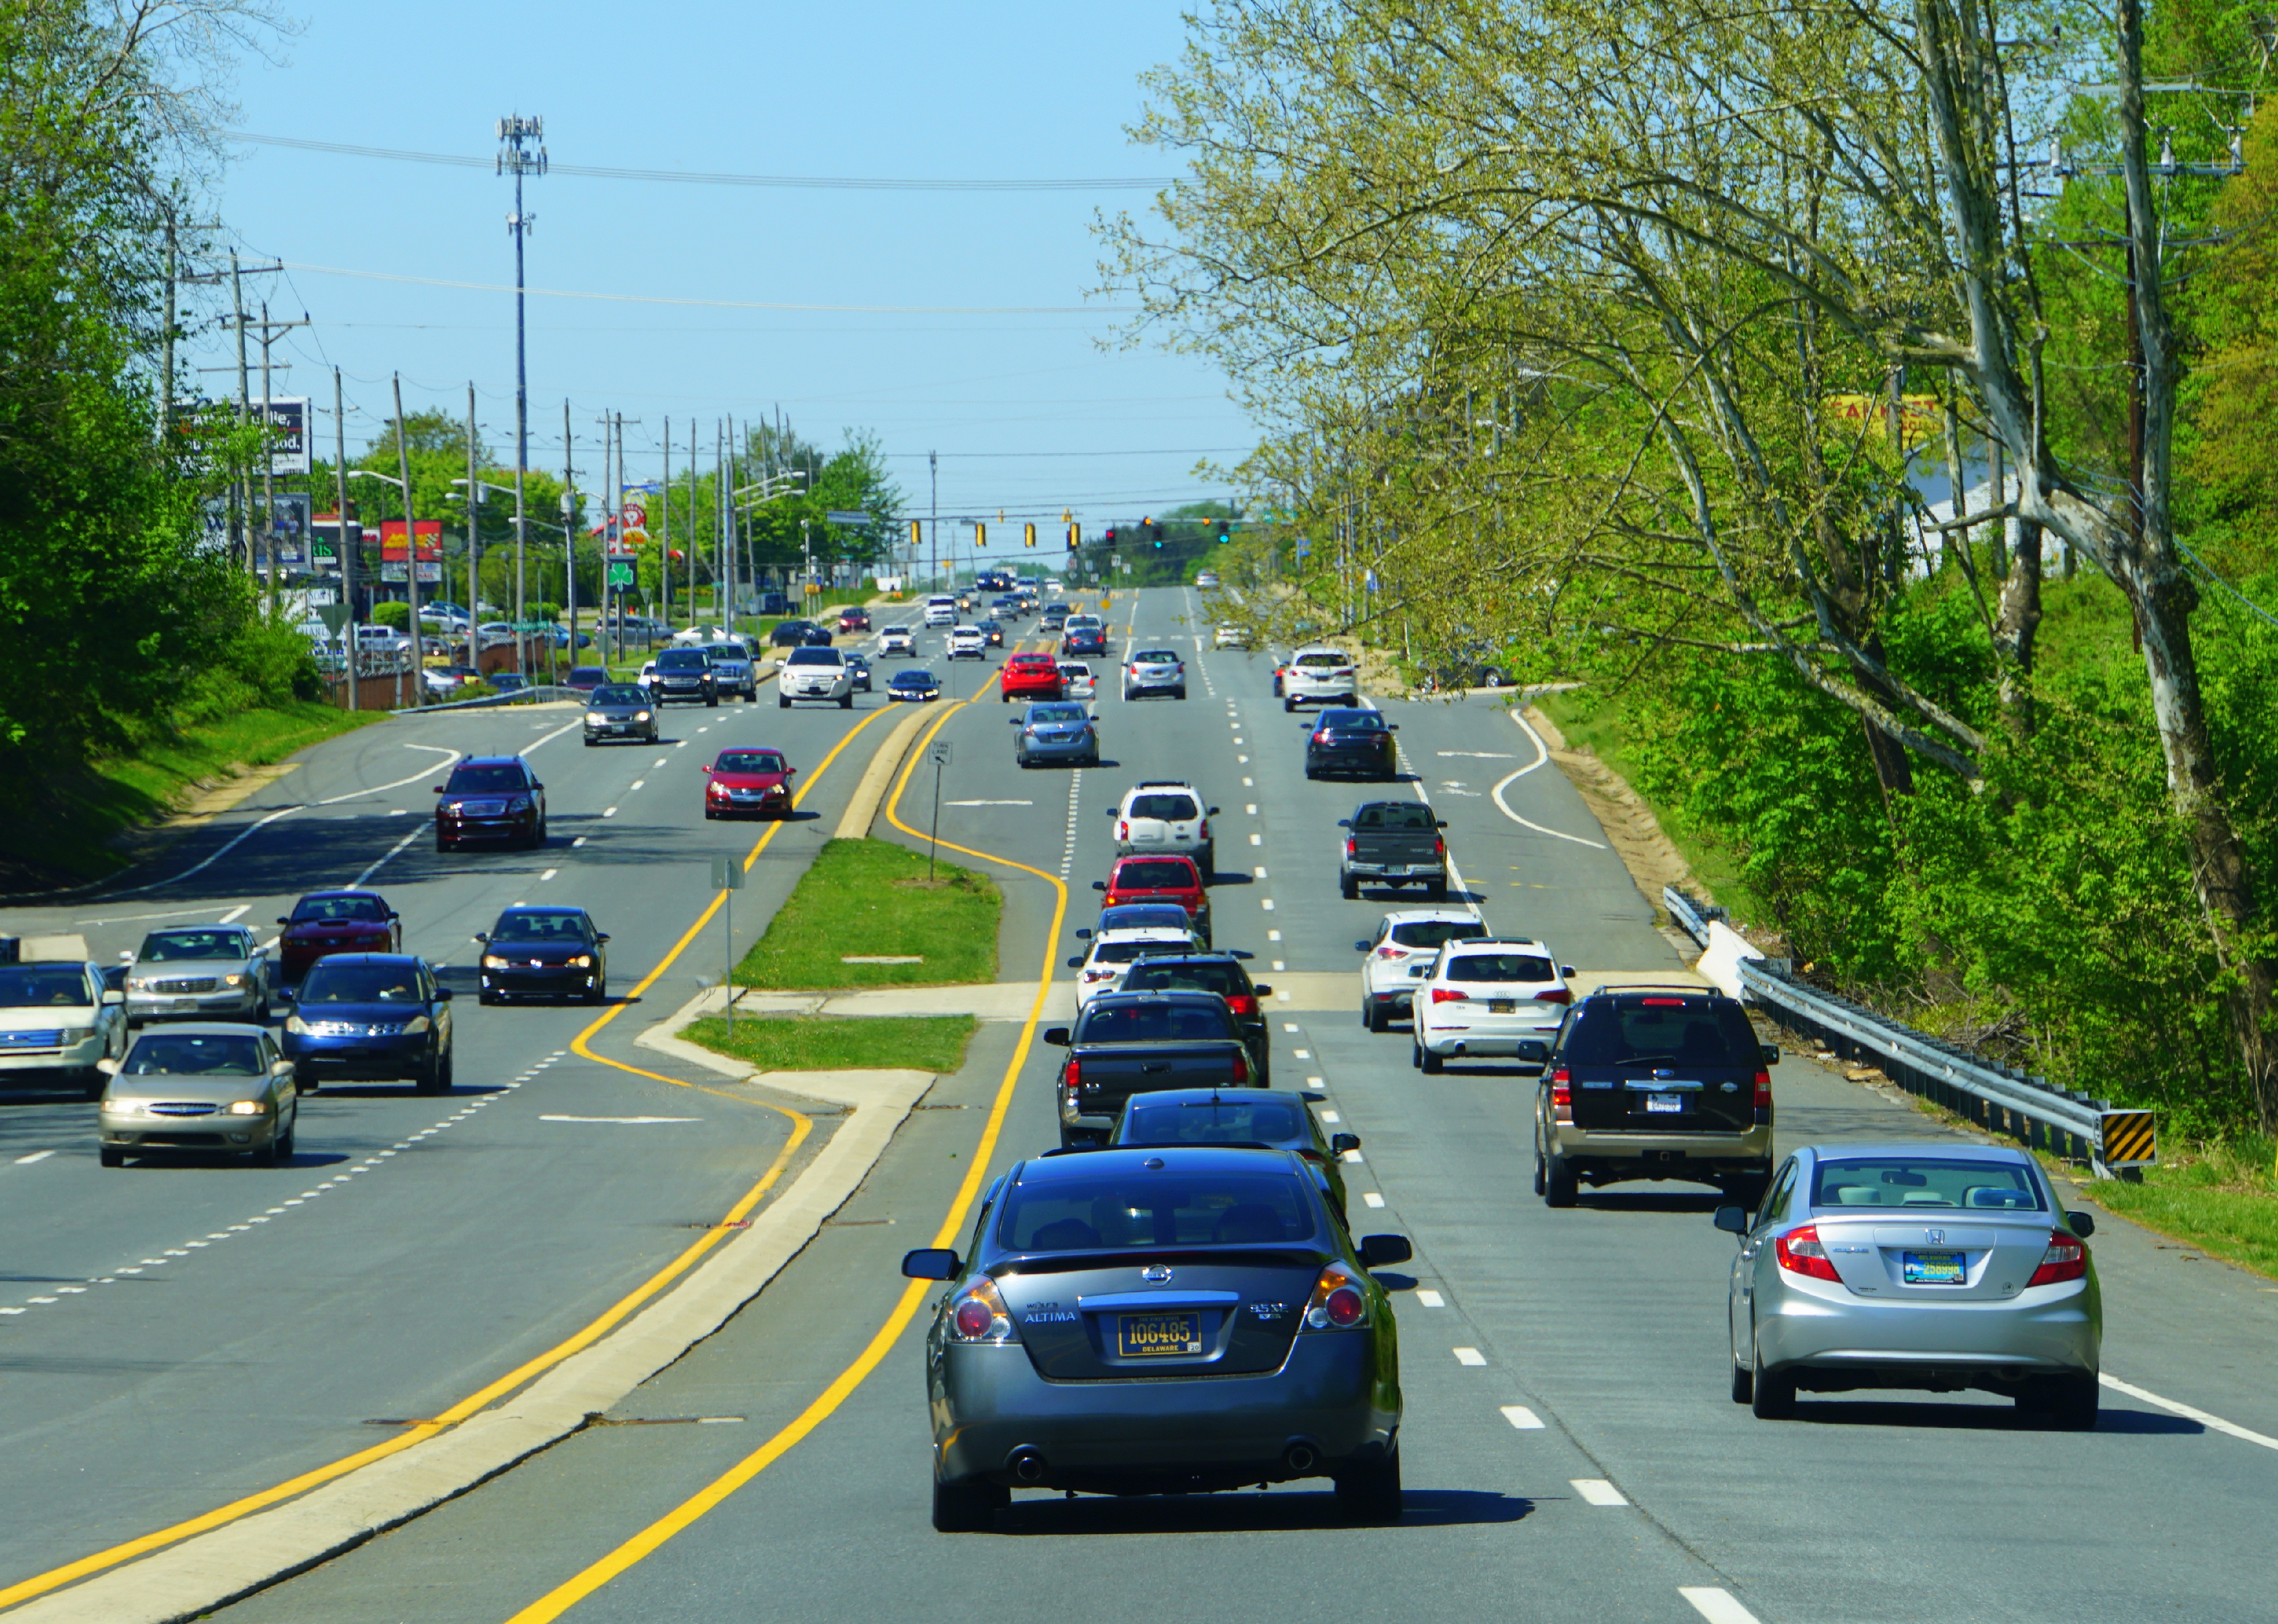
#35. Delaware
Traffic on Kirkwood Highway towards Newark.
– Drunken driving fatalities per 100k residents: 3.4 (34, 25% of all car crash fatalities)
– Fatalities involving driver with BAC 0.15 and above: 2.1 per 100K (21, 61.8% of all drunken driving fatalities)
– Change in drunken driving fatalities from 2012: 2.9% decrease

DavidCarpio // Shutterstock
#34. Wisconsin
Police car flashing lights close up.
– Drunken driving fatalities per 100k residents: 3.4 (199, 32% of all car crash fatalities)
– Fatalities involving driver with BAC 0.15 and above: 2.1 per 100K (125, 62.8% of all drunken driving fatalities)
– Change in drunken driving fatalities from 2012: 1.5% decrease
Ceri Breeze // Shutterstock
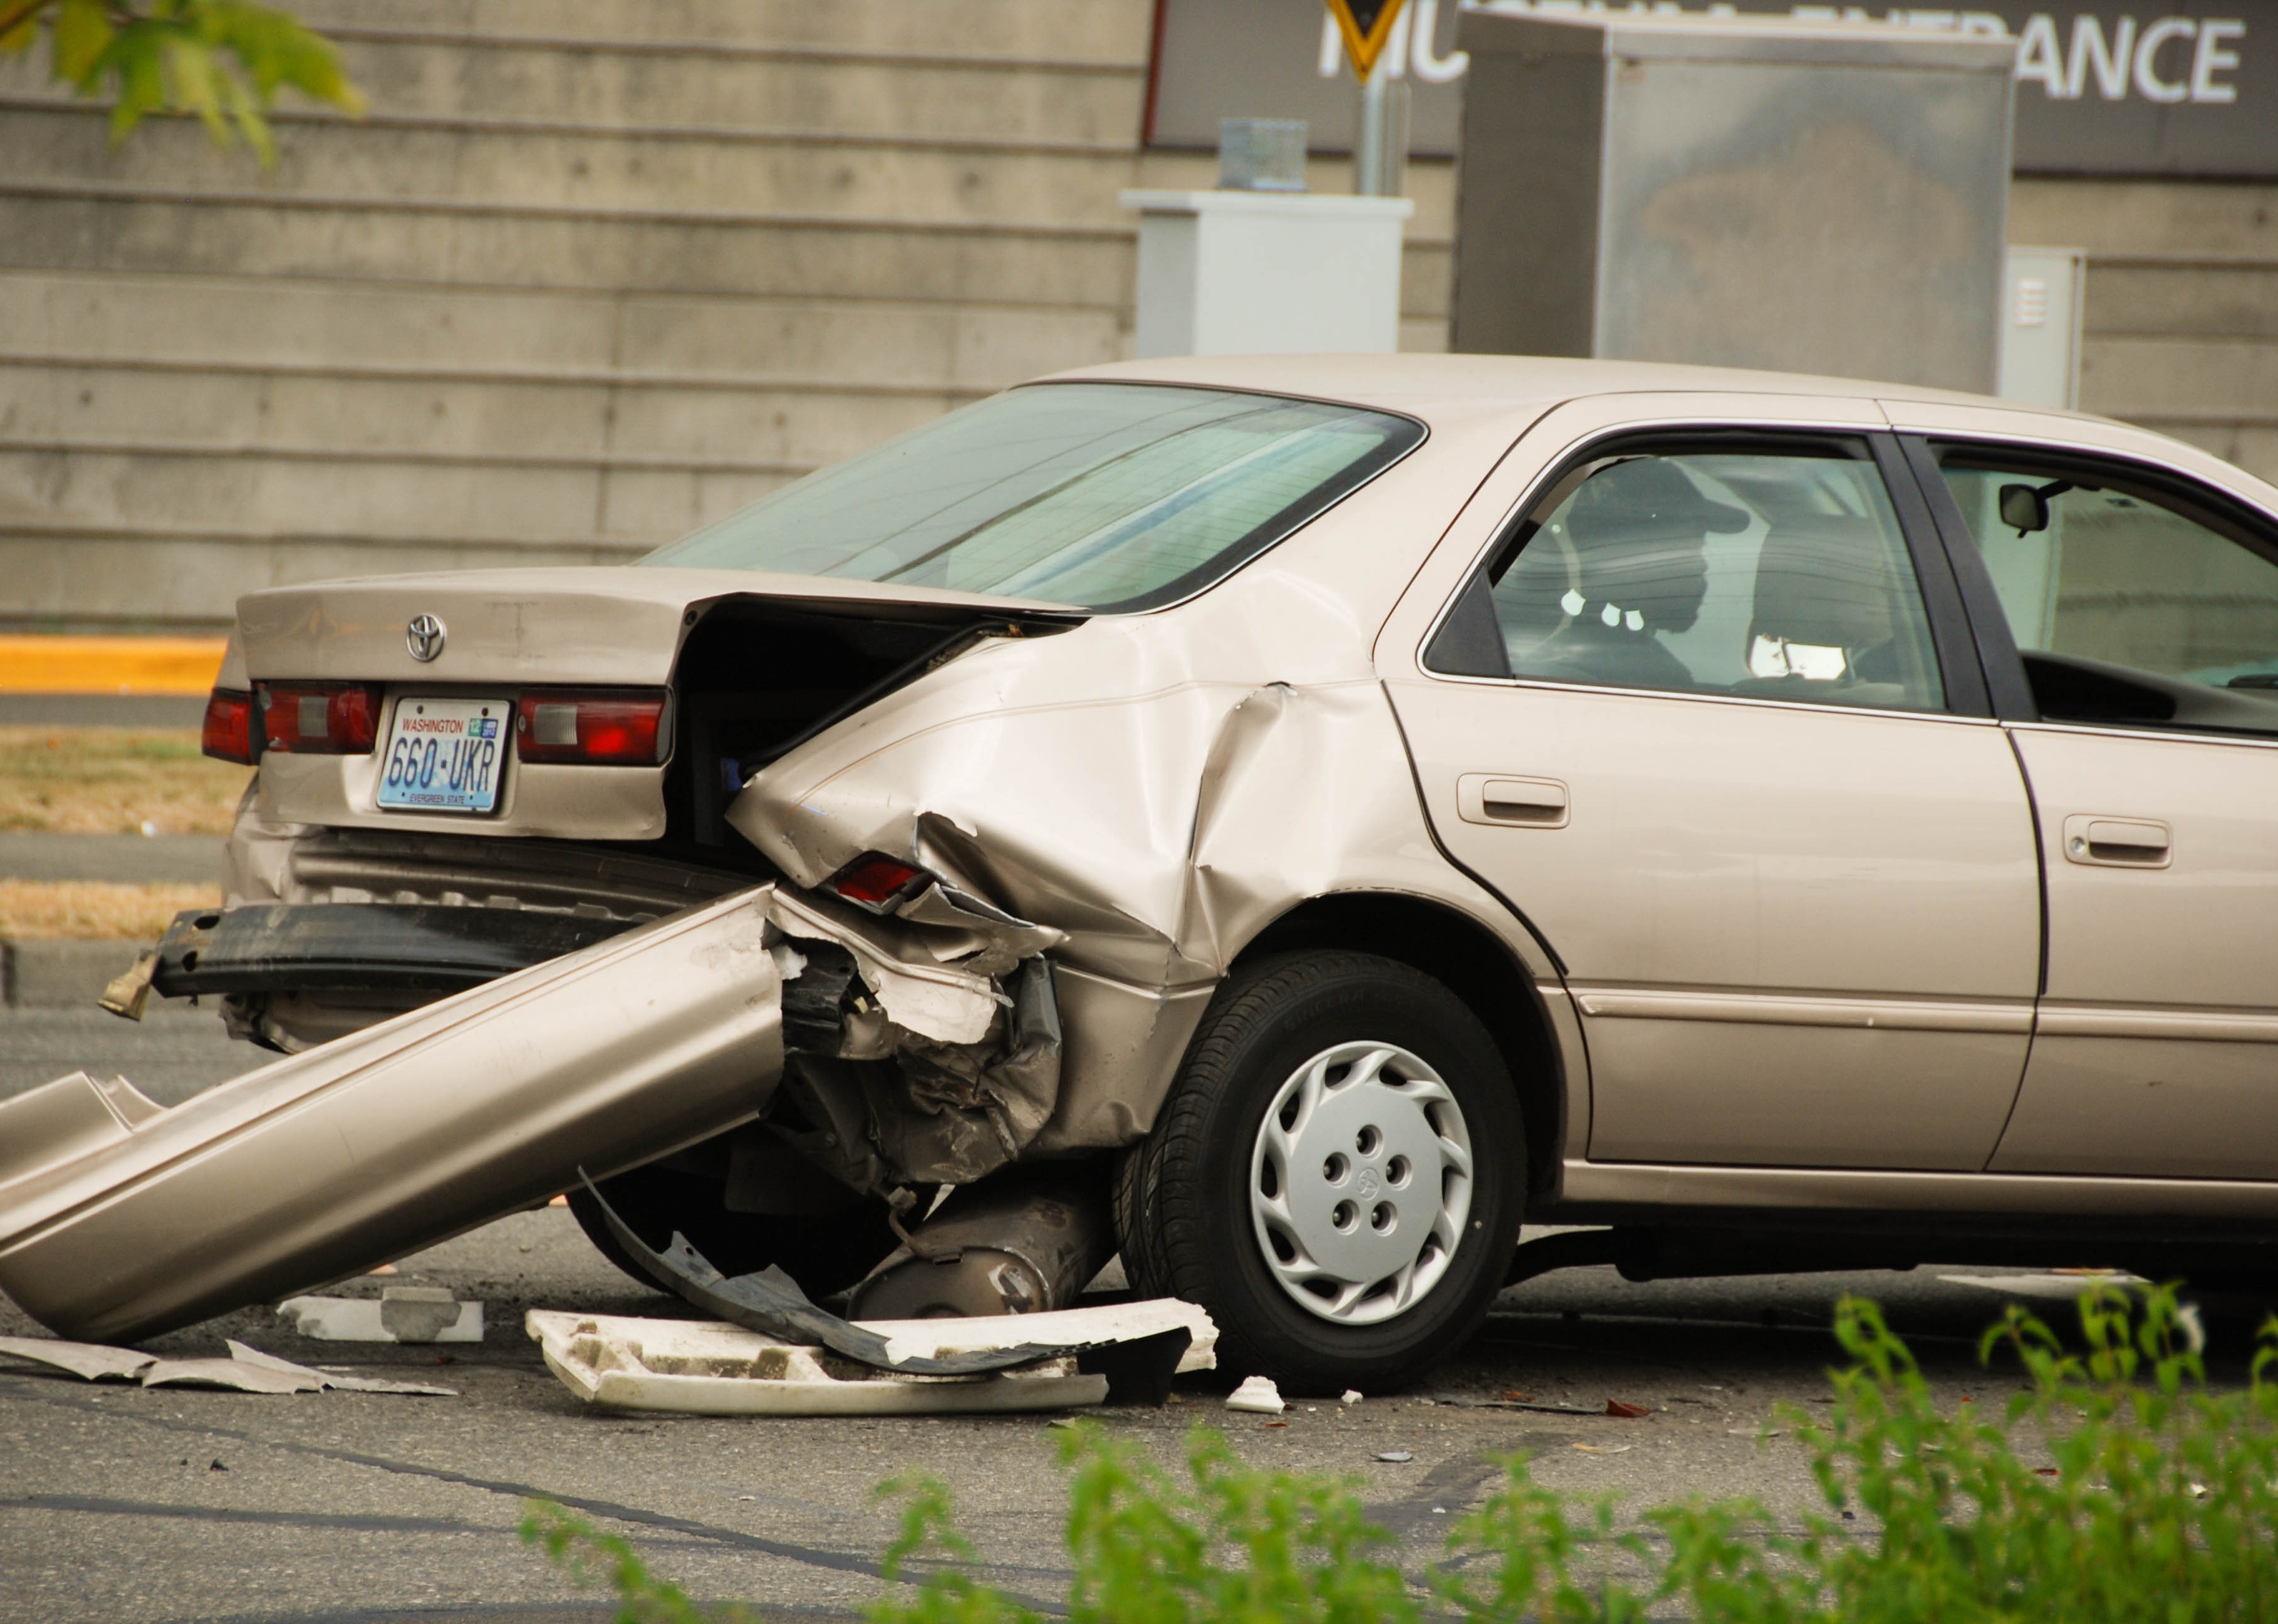
#33. Washington
The damaged rear of a car as a result of an accident.
– Drunken driving fatalities per 100k residents: 3.4 (262, 39% of all car crash fatalities)
– Fatalities involving driver with BAC 0.15 and above: 2.3 per 100K (181, 69.1% of all drunken driving fatalities)
– Change in drunken driving fatalities from 2012: 83.2% increase
Shadowspeeder // Shutterstock
#32. Indiana
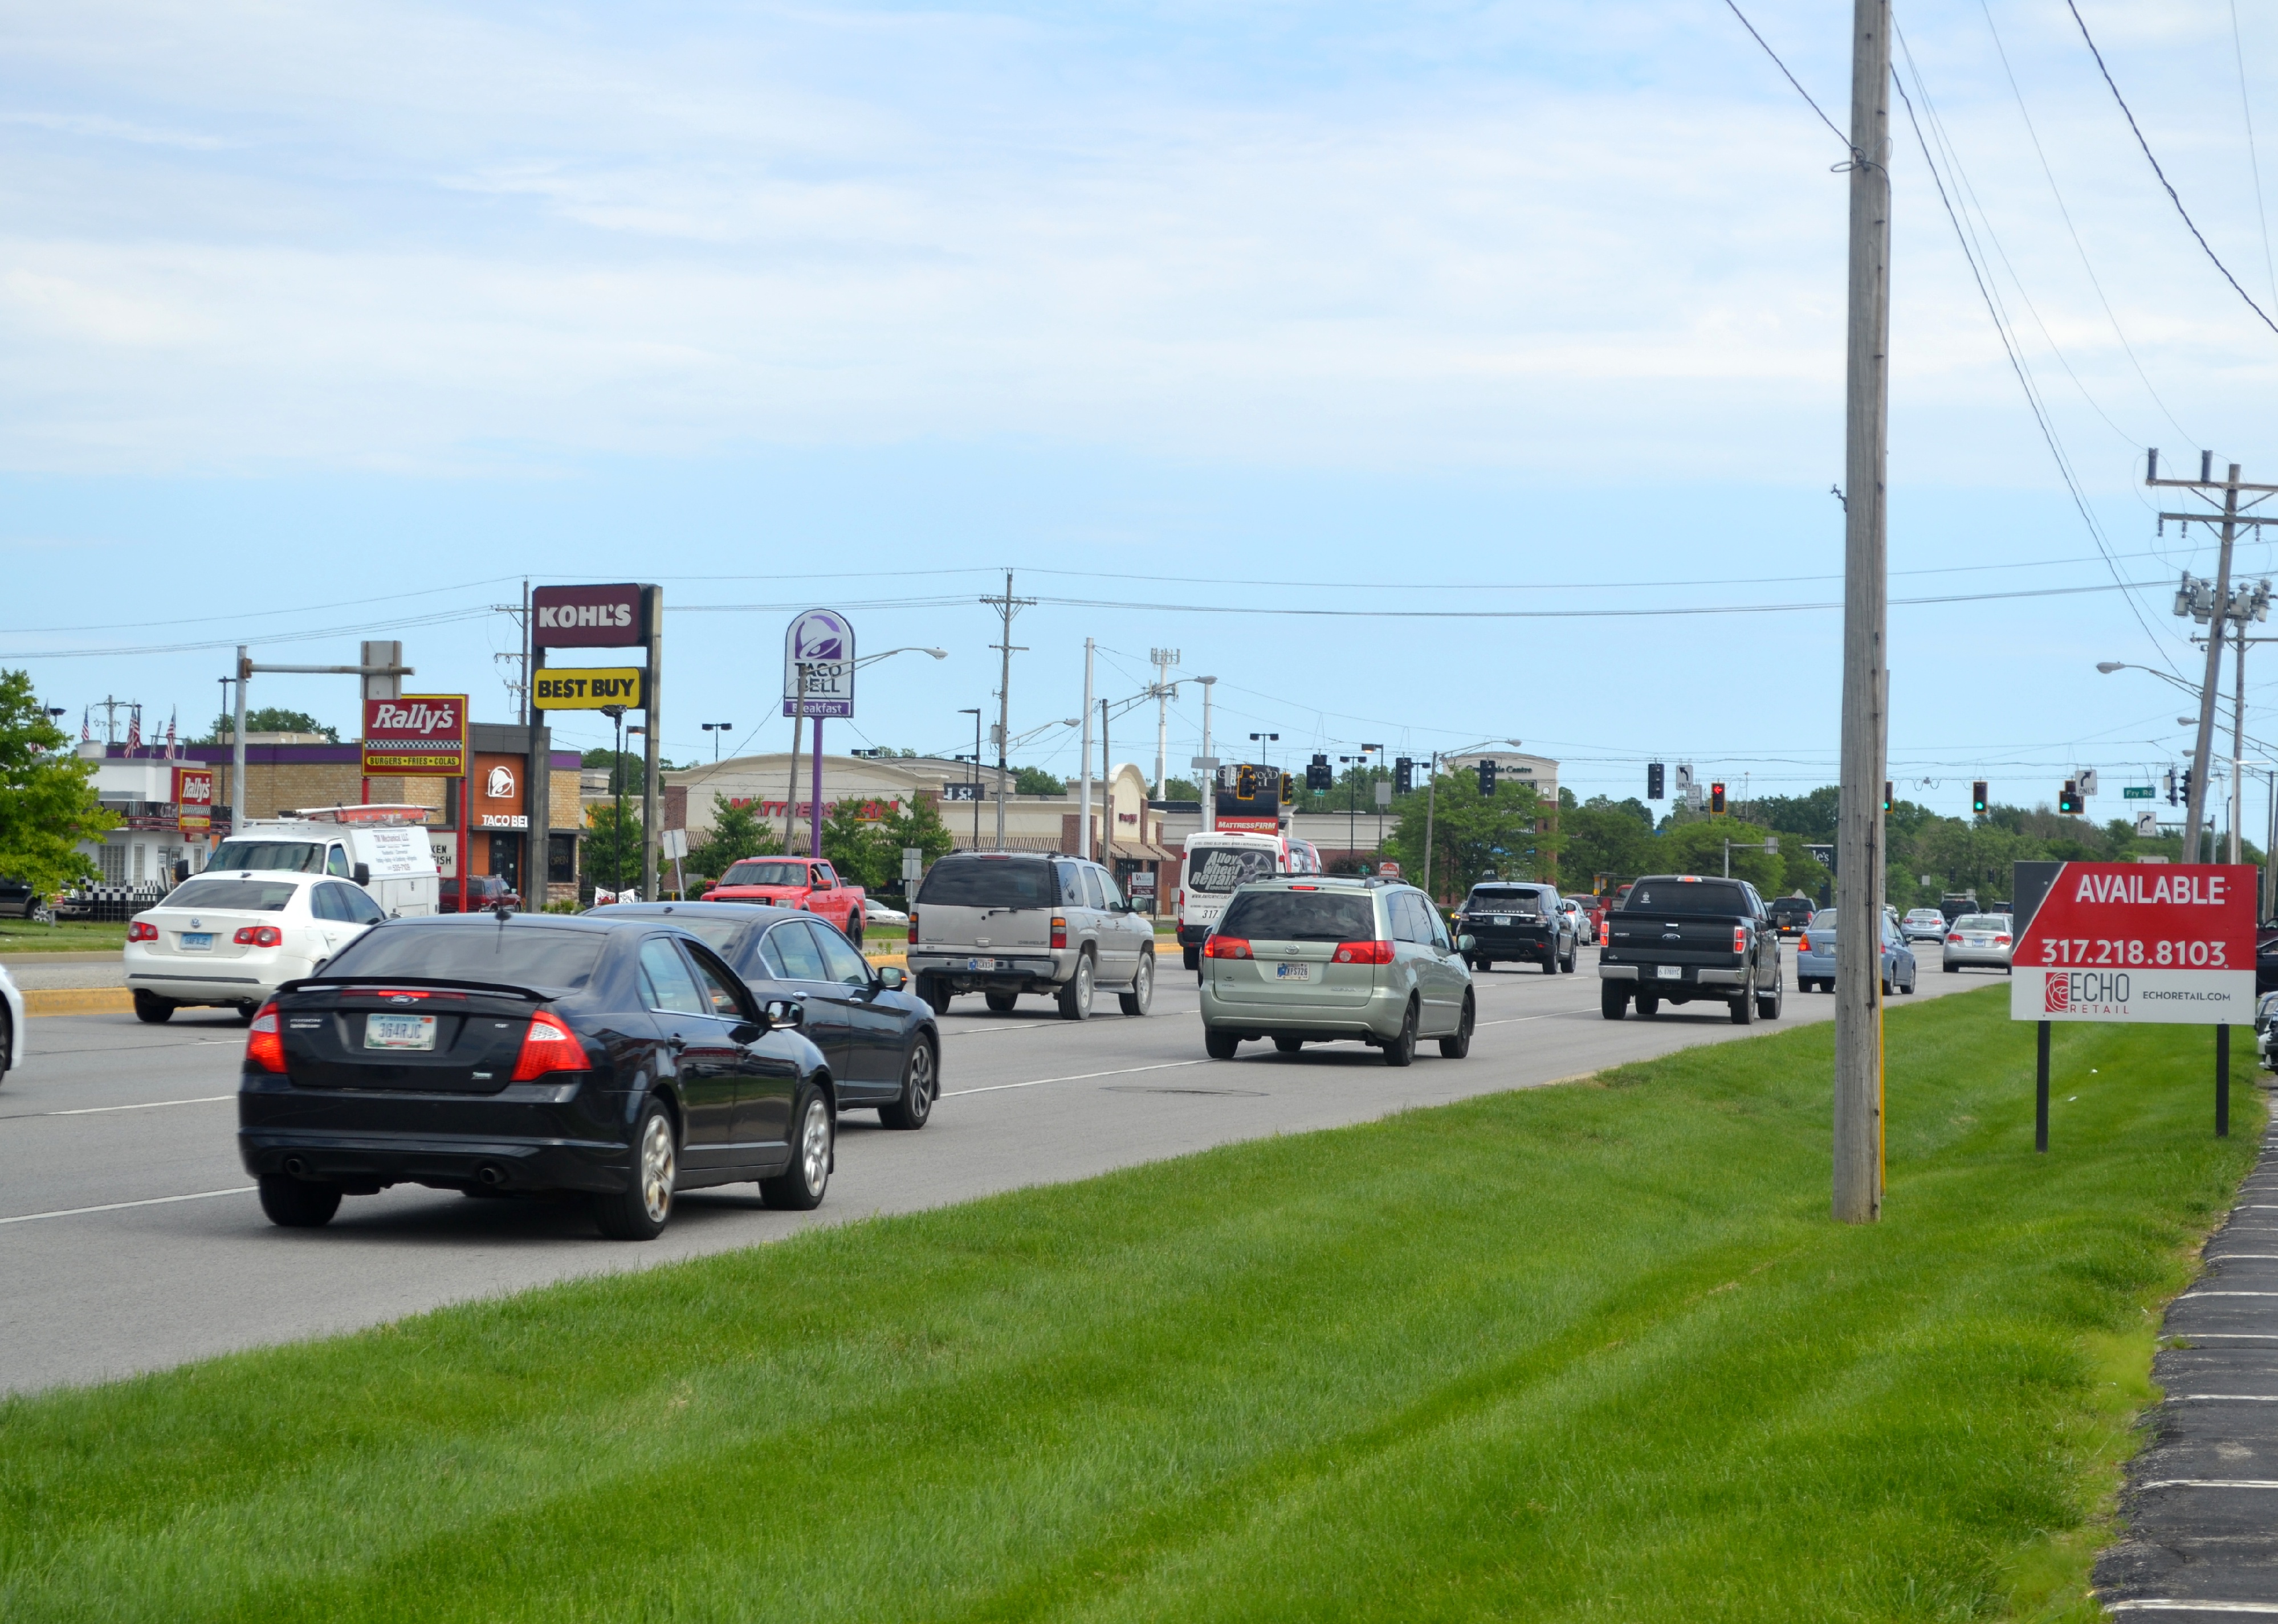
Traffic in a mall area in Indiana.
– Drunken driving fatalities per 100k residents: 3.4 (234, 25% of all car crash fatalities)
– Fatalities involving driver with BAC 0.15 and above: 2.2 per 100K (153, 65.4% of all drunken driving fatalities)
– Change in drunken driving fatalities from 2012: 1.7% increase
David A Litman // Shutterstock
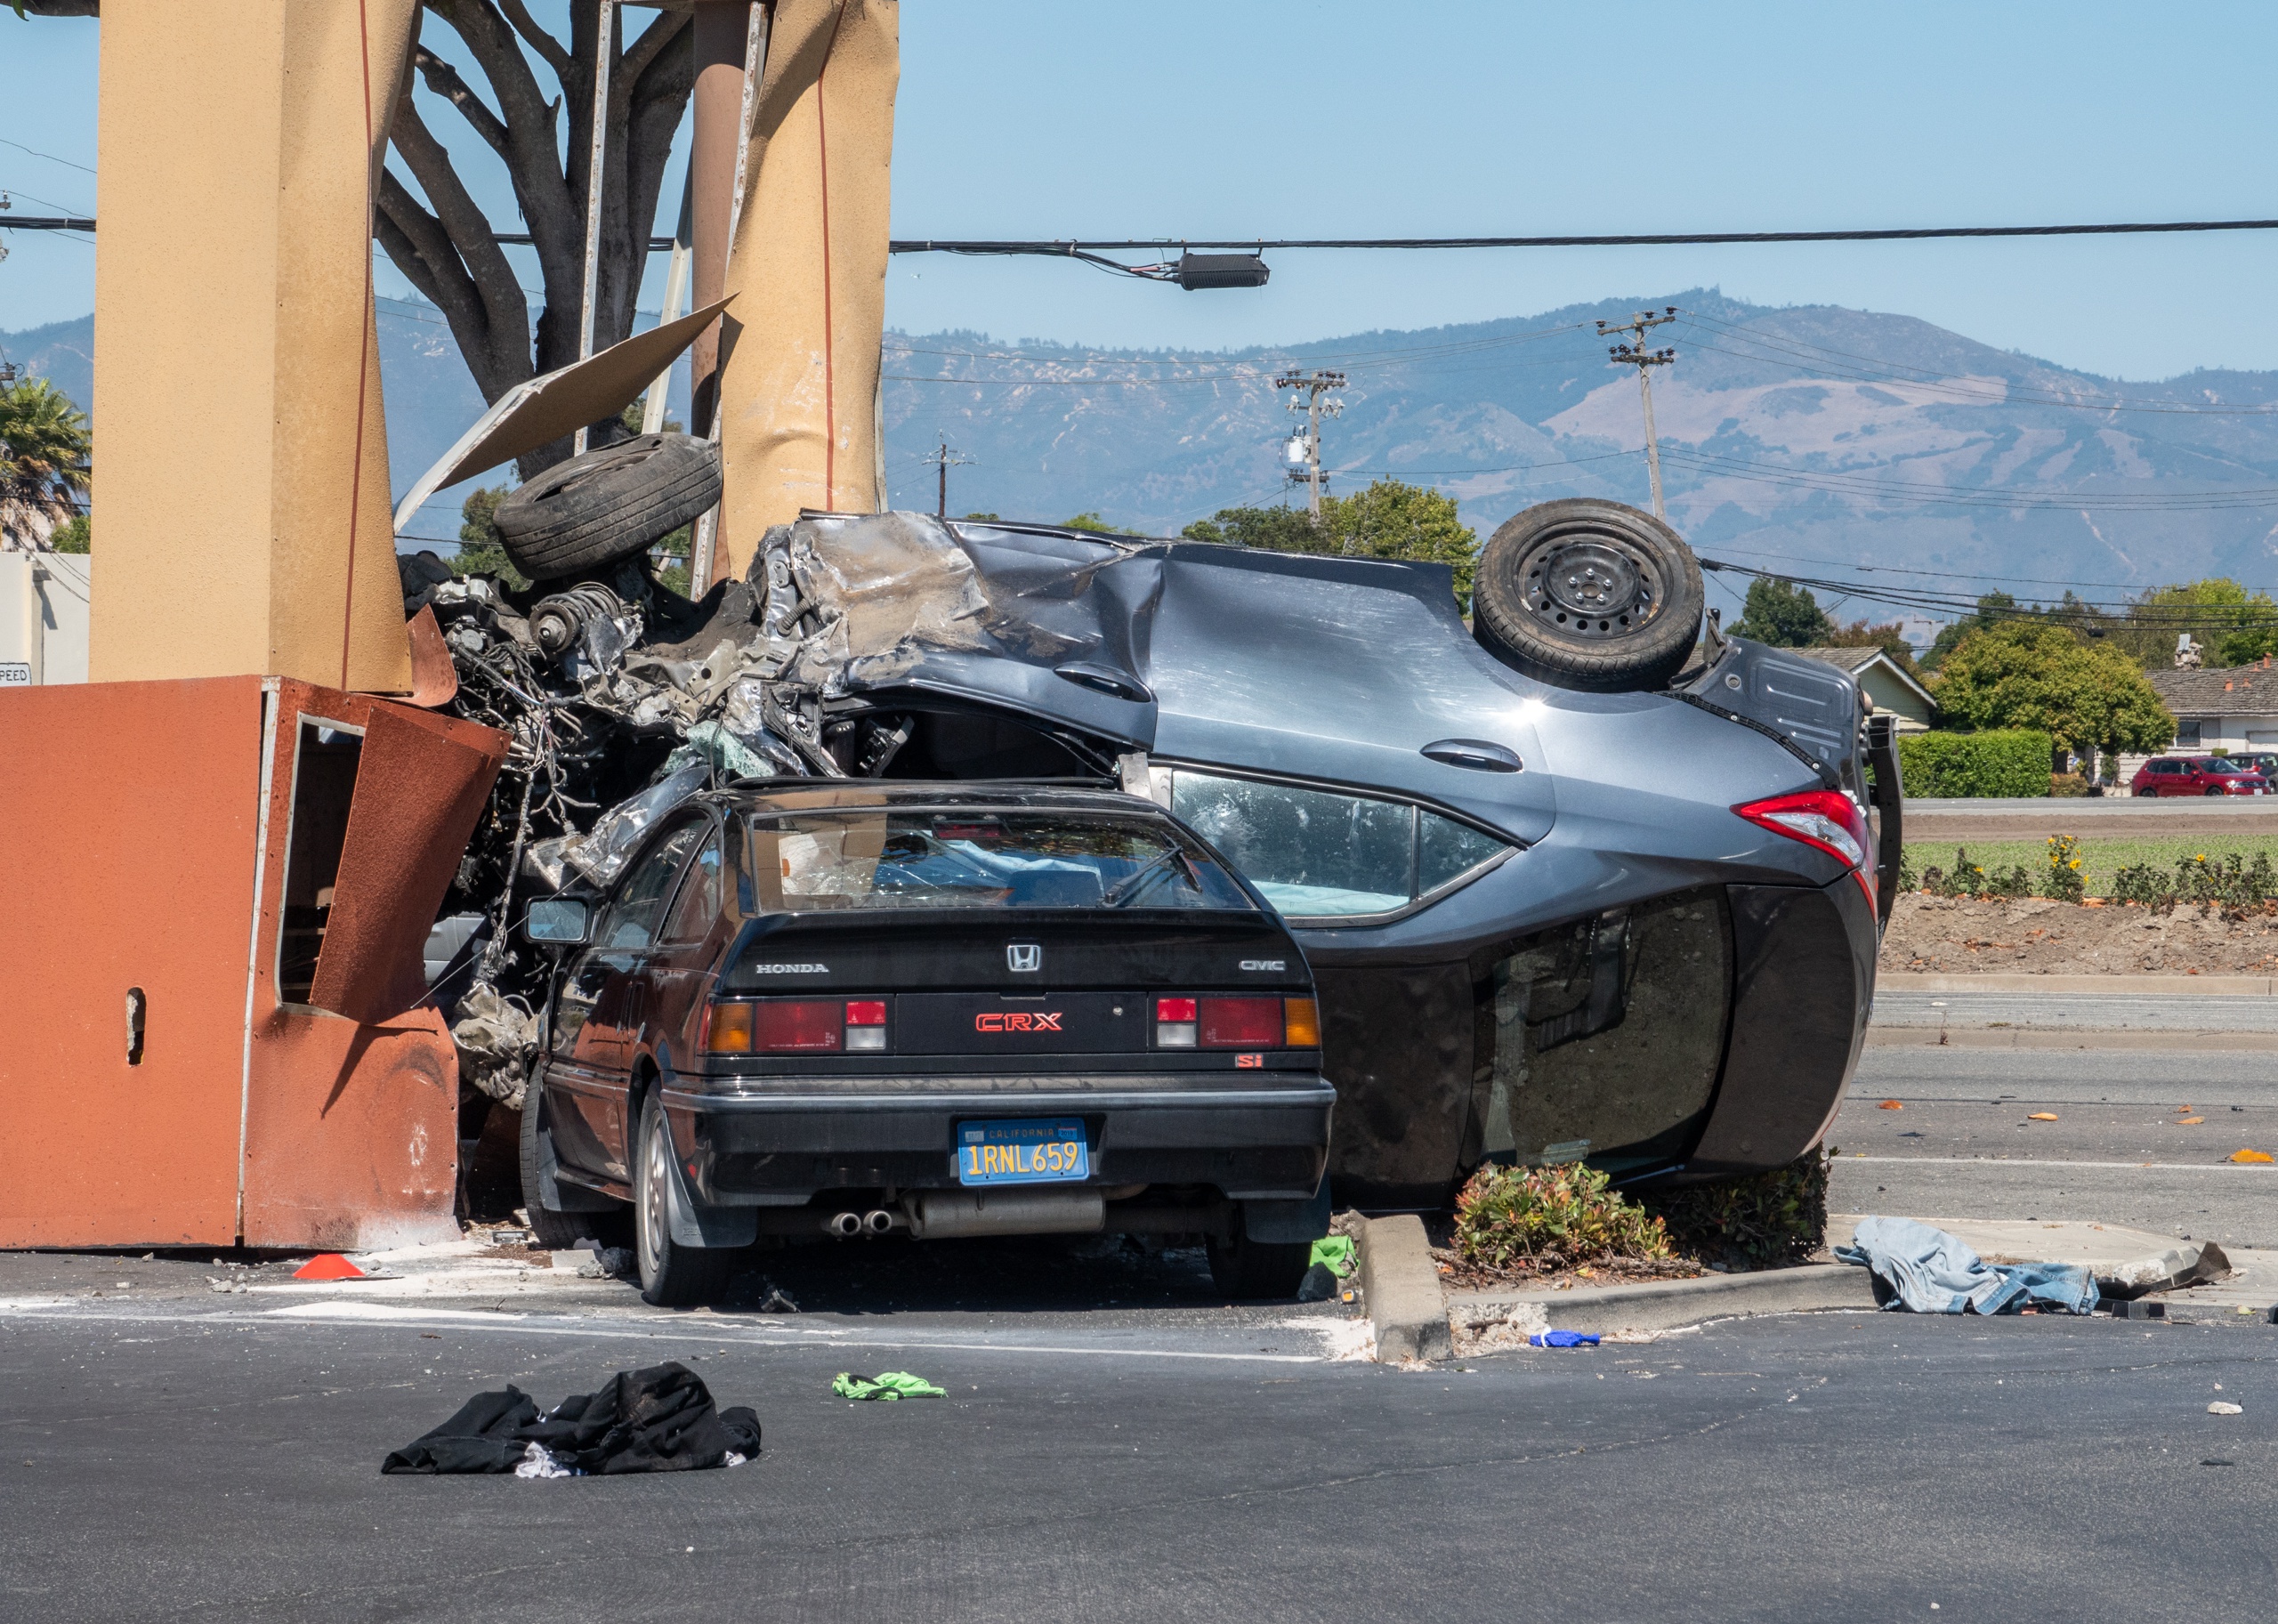
#31. California
A wrecked car upside down on top of a parked car.
– Drunken driving fatalities per 100k residents: 3.5 (1,370, 32% of all car crash fatalities)
– Fatalities involving driver with BAC 0.15 and above: 2.2 per 100K (880, 64.2% of all drunken driving fatalities)
– Change in drunken driving fatalities from 2012: 65.3% increase

Christian Ouellet // Shutterstock
#30. Puerto Rico
Vehicles drive on the highway in Sanjuan.
– Drunken driving fatalities per 100k residents: 3.6 (116, 34% of all car crash fatalities)
– Fatalities involving driver with BAC 0.15 and above: 2.2 per 100K (73, 62.9% of all drunken driving fatalities)
– Change in drunken driving fatalities from 2012: 6.5% decrease
SNEHIT PHOTO // Shutterstock
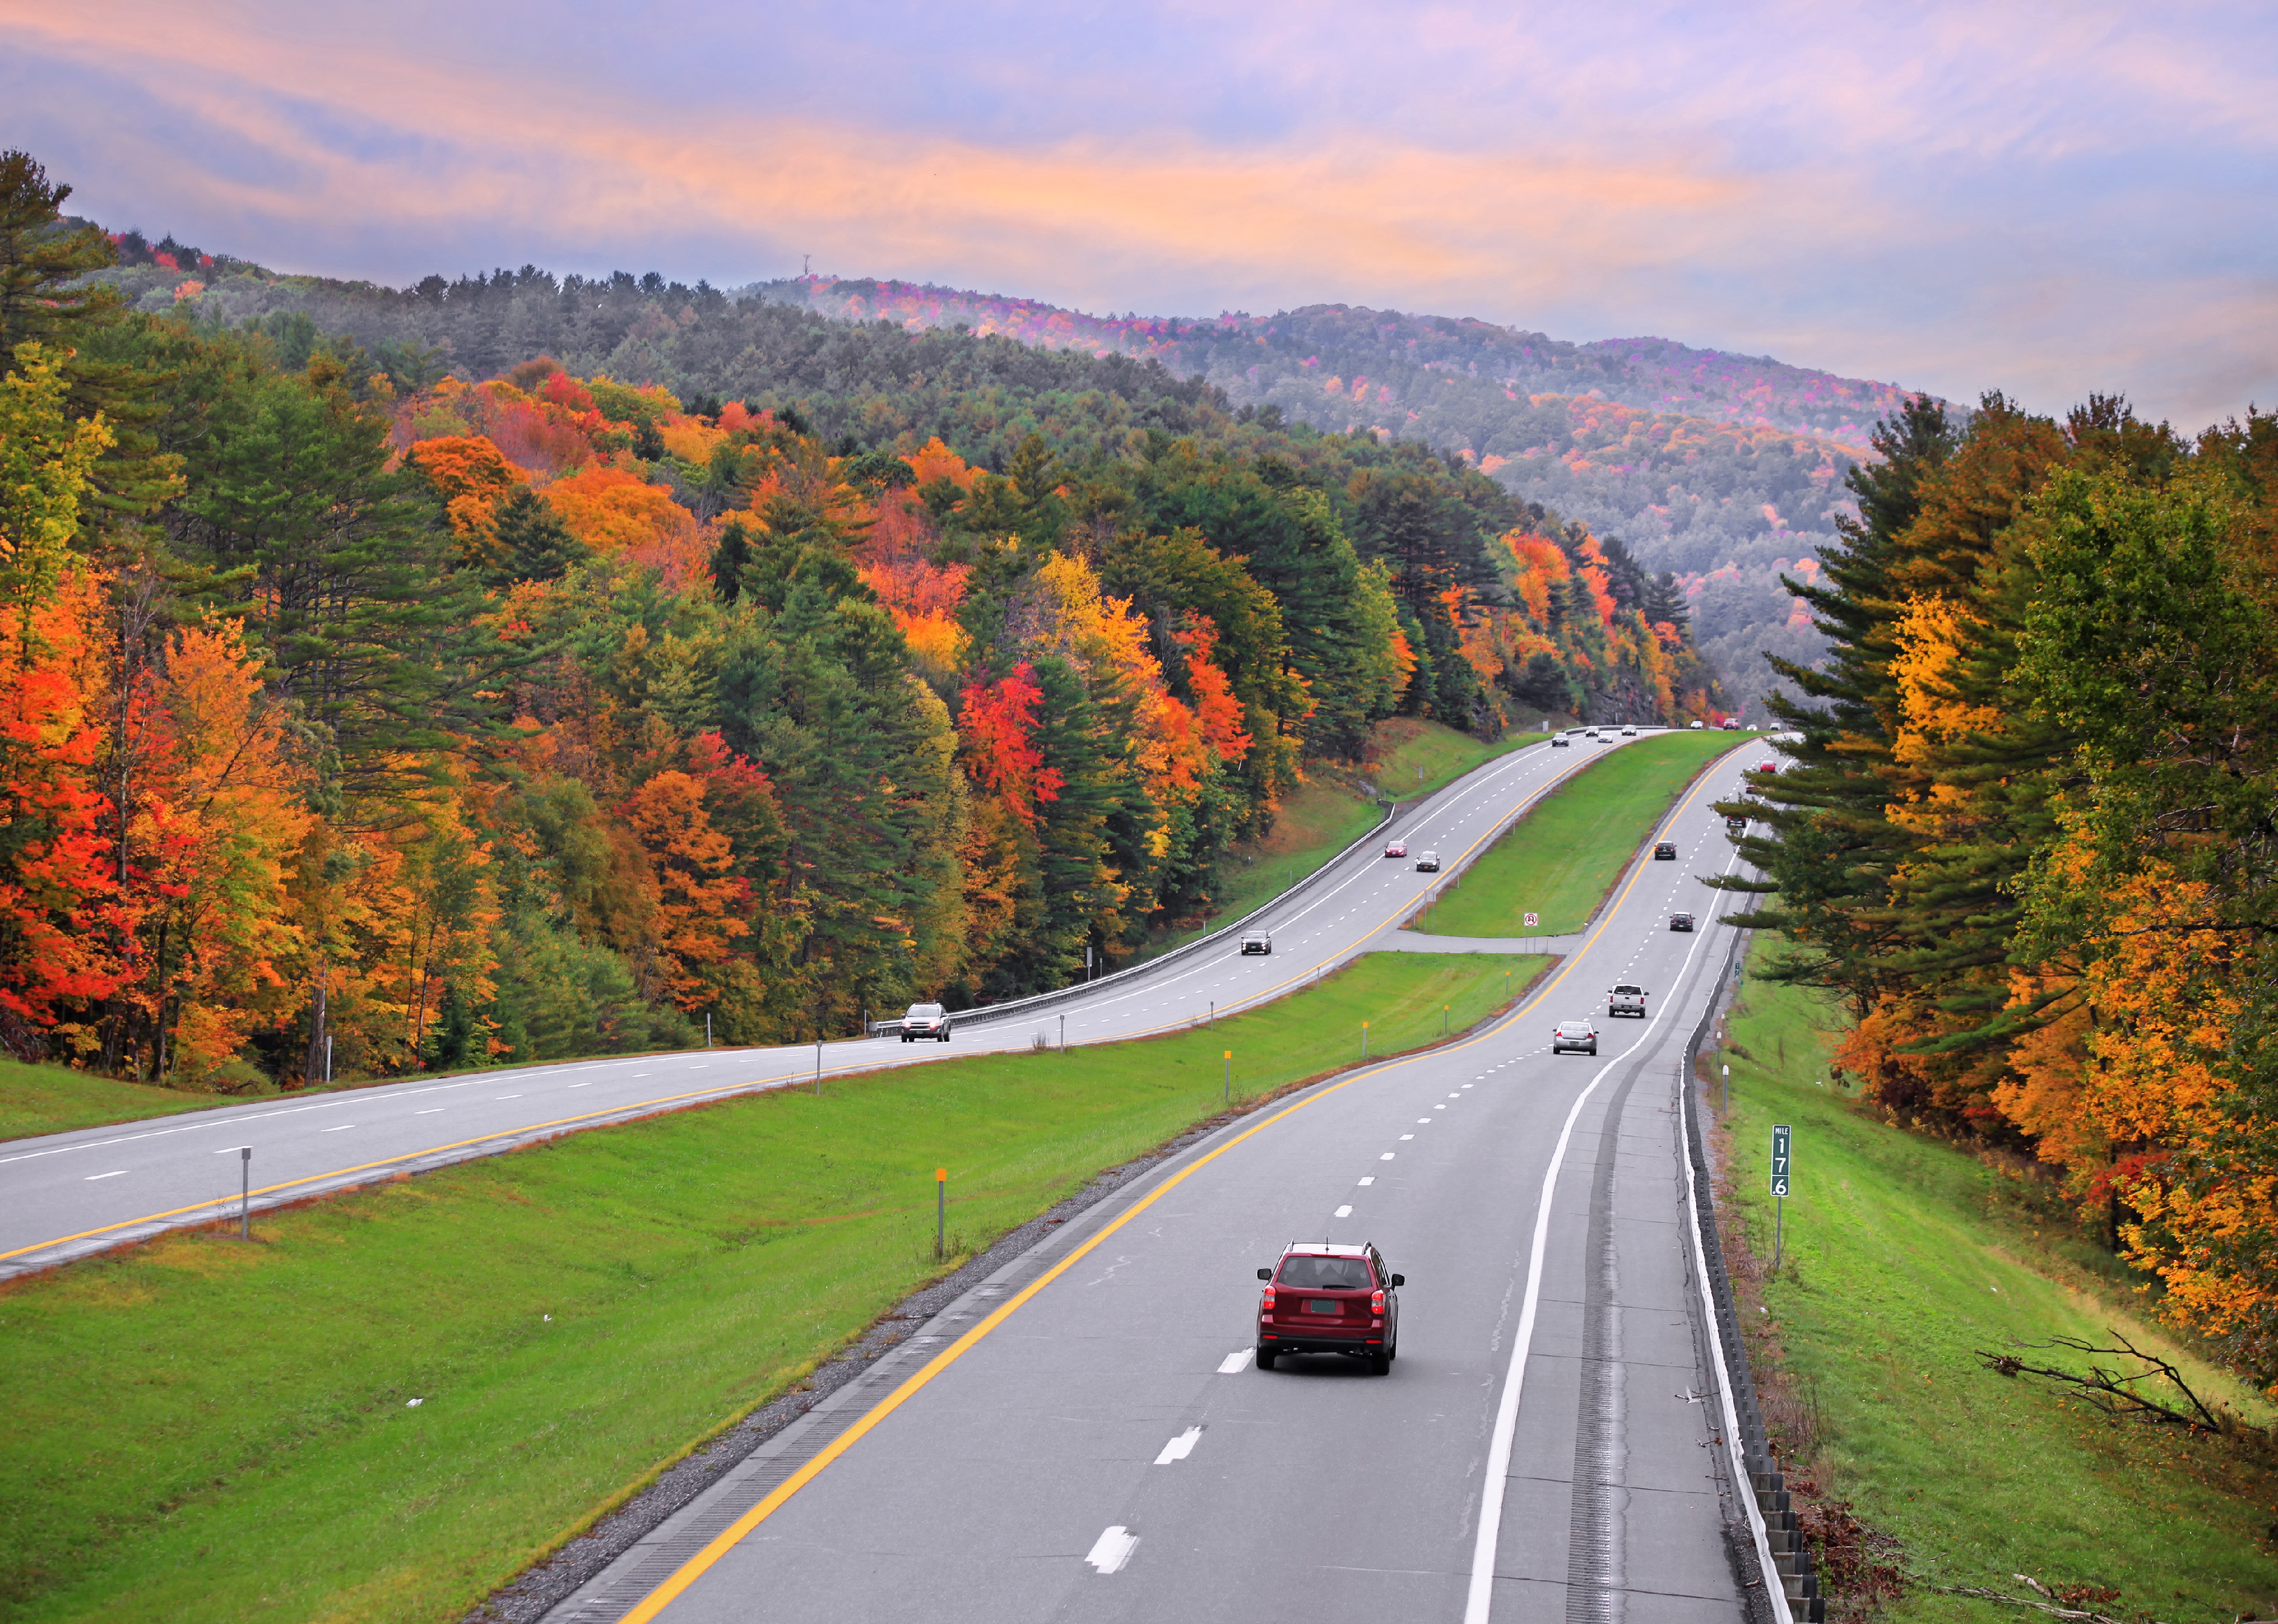
#29. Vermont
Scenic highway 89 in Vermont during autumn.
– Drunken driving fatalities per 100k residents: 3.6 (23, 31% of all car crash fatalities)
– Fatalities involving driver with BAC 0.15 and above: 2.2 per 100K (14, 60.9% of all drunken driving fatalities)
– Change in drunken driving fatalities from 2012: 4.2% decrease

New Visions Media // Shutterstock
#28. Georgia
Car accident on city street in Atlanta.
– Drunken driving fatalities per 100k residents: 3.6 (391, 22% of all car crash fatalities)
– Fatalities involving driver with BAC 0.15 and above: 2.5 per 100K (272, 69.6% of all drunken driving fatalities)
– Change in drunken driving fatalities from 2012: 32.5% increase
Matt Gush // Shutterstock
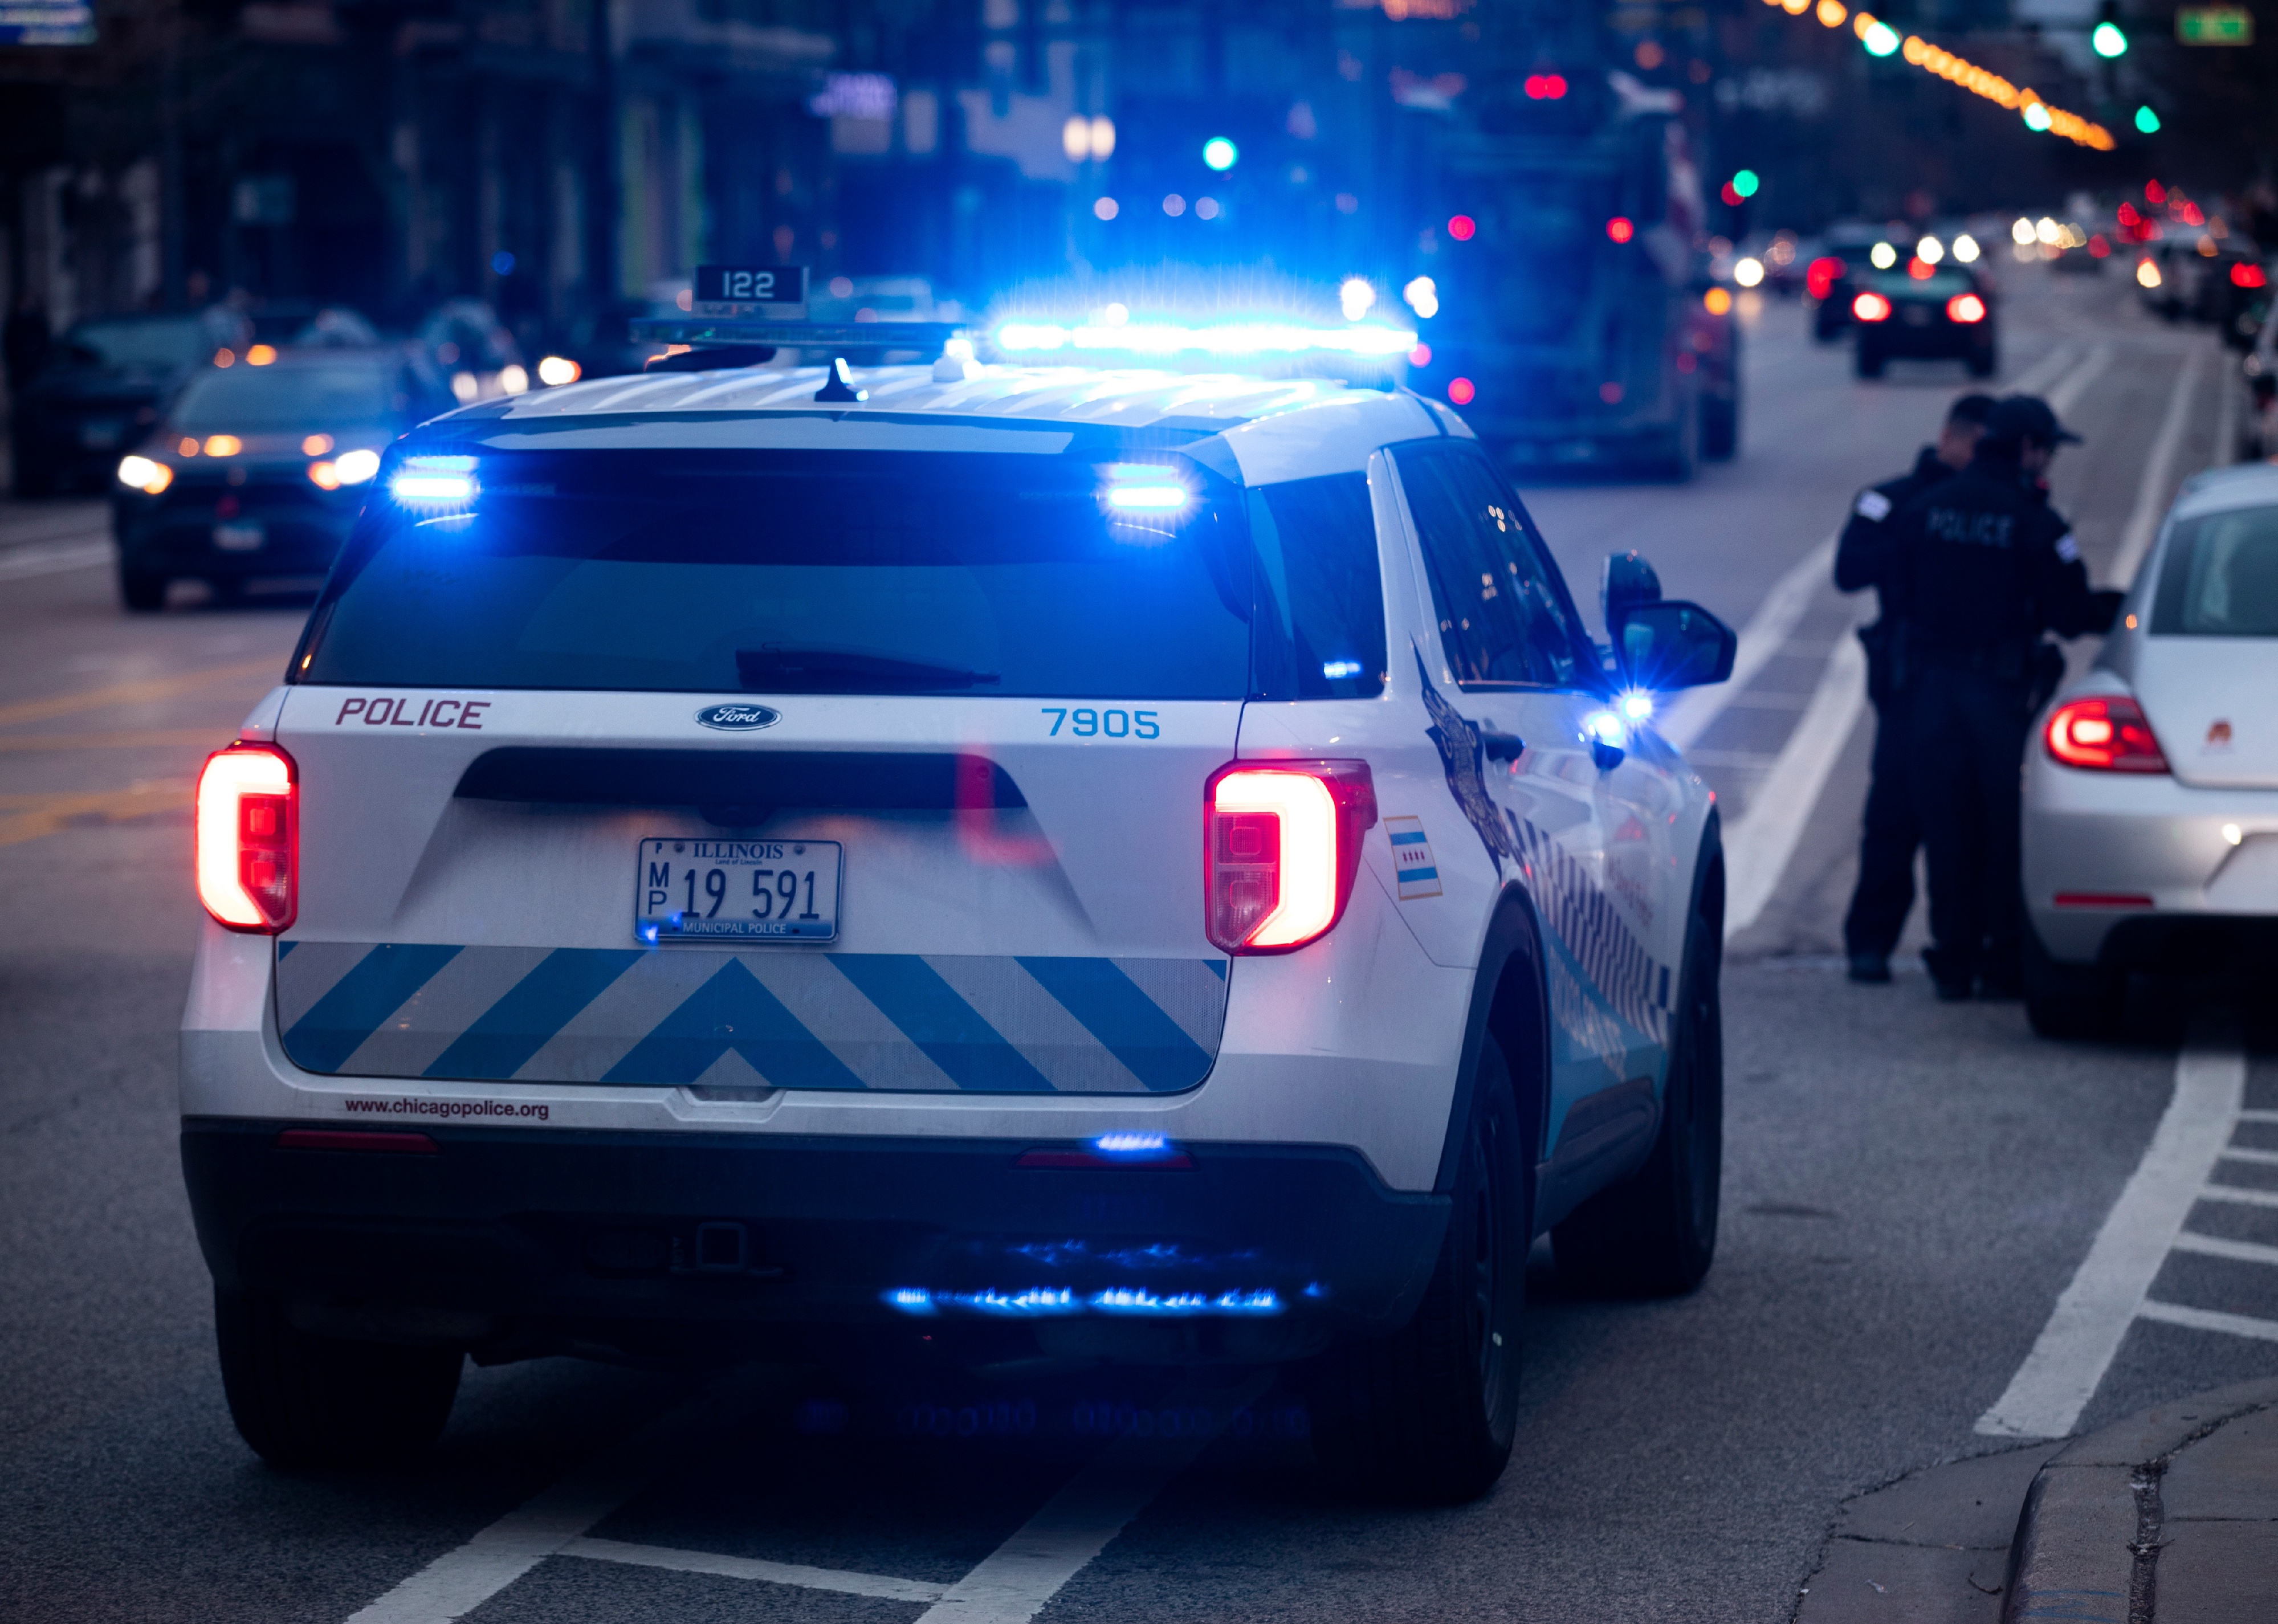
#27. Illinois
Chicago Police Department officers respond to the scene of an incident.
– Drunken driving fatalities per 100k residents: 3.6 (461, 35% of all car crash fatalities)
– Fatalities involving driver with BAC 0.15 and above: 2.6 per 100K (332, 72% of all drunken driving fatalities)
– Change in drunken driving fatalities from 2012: 43.2% increase
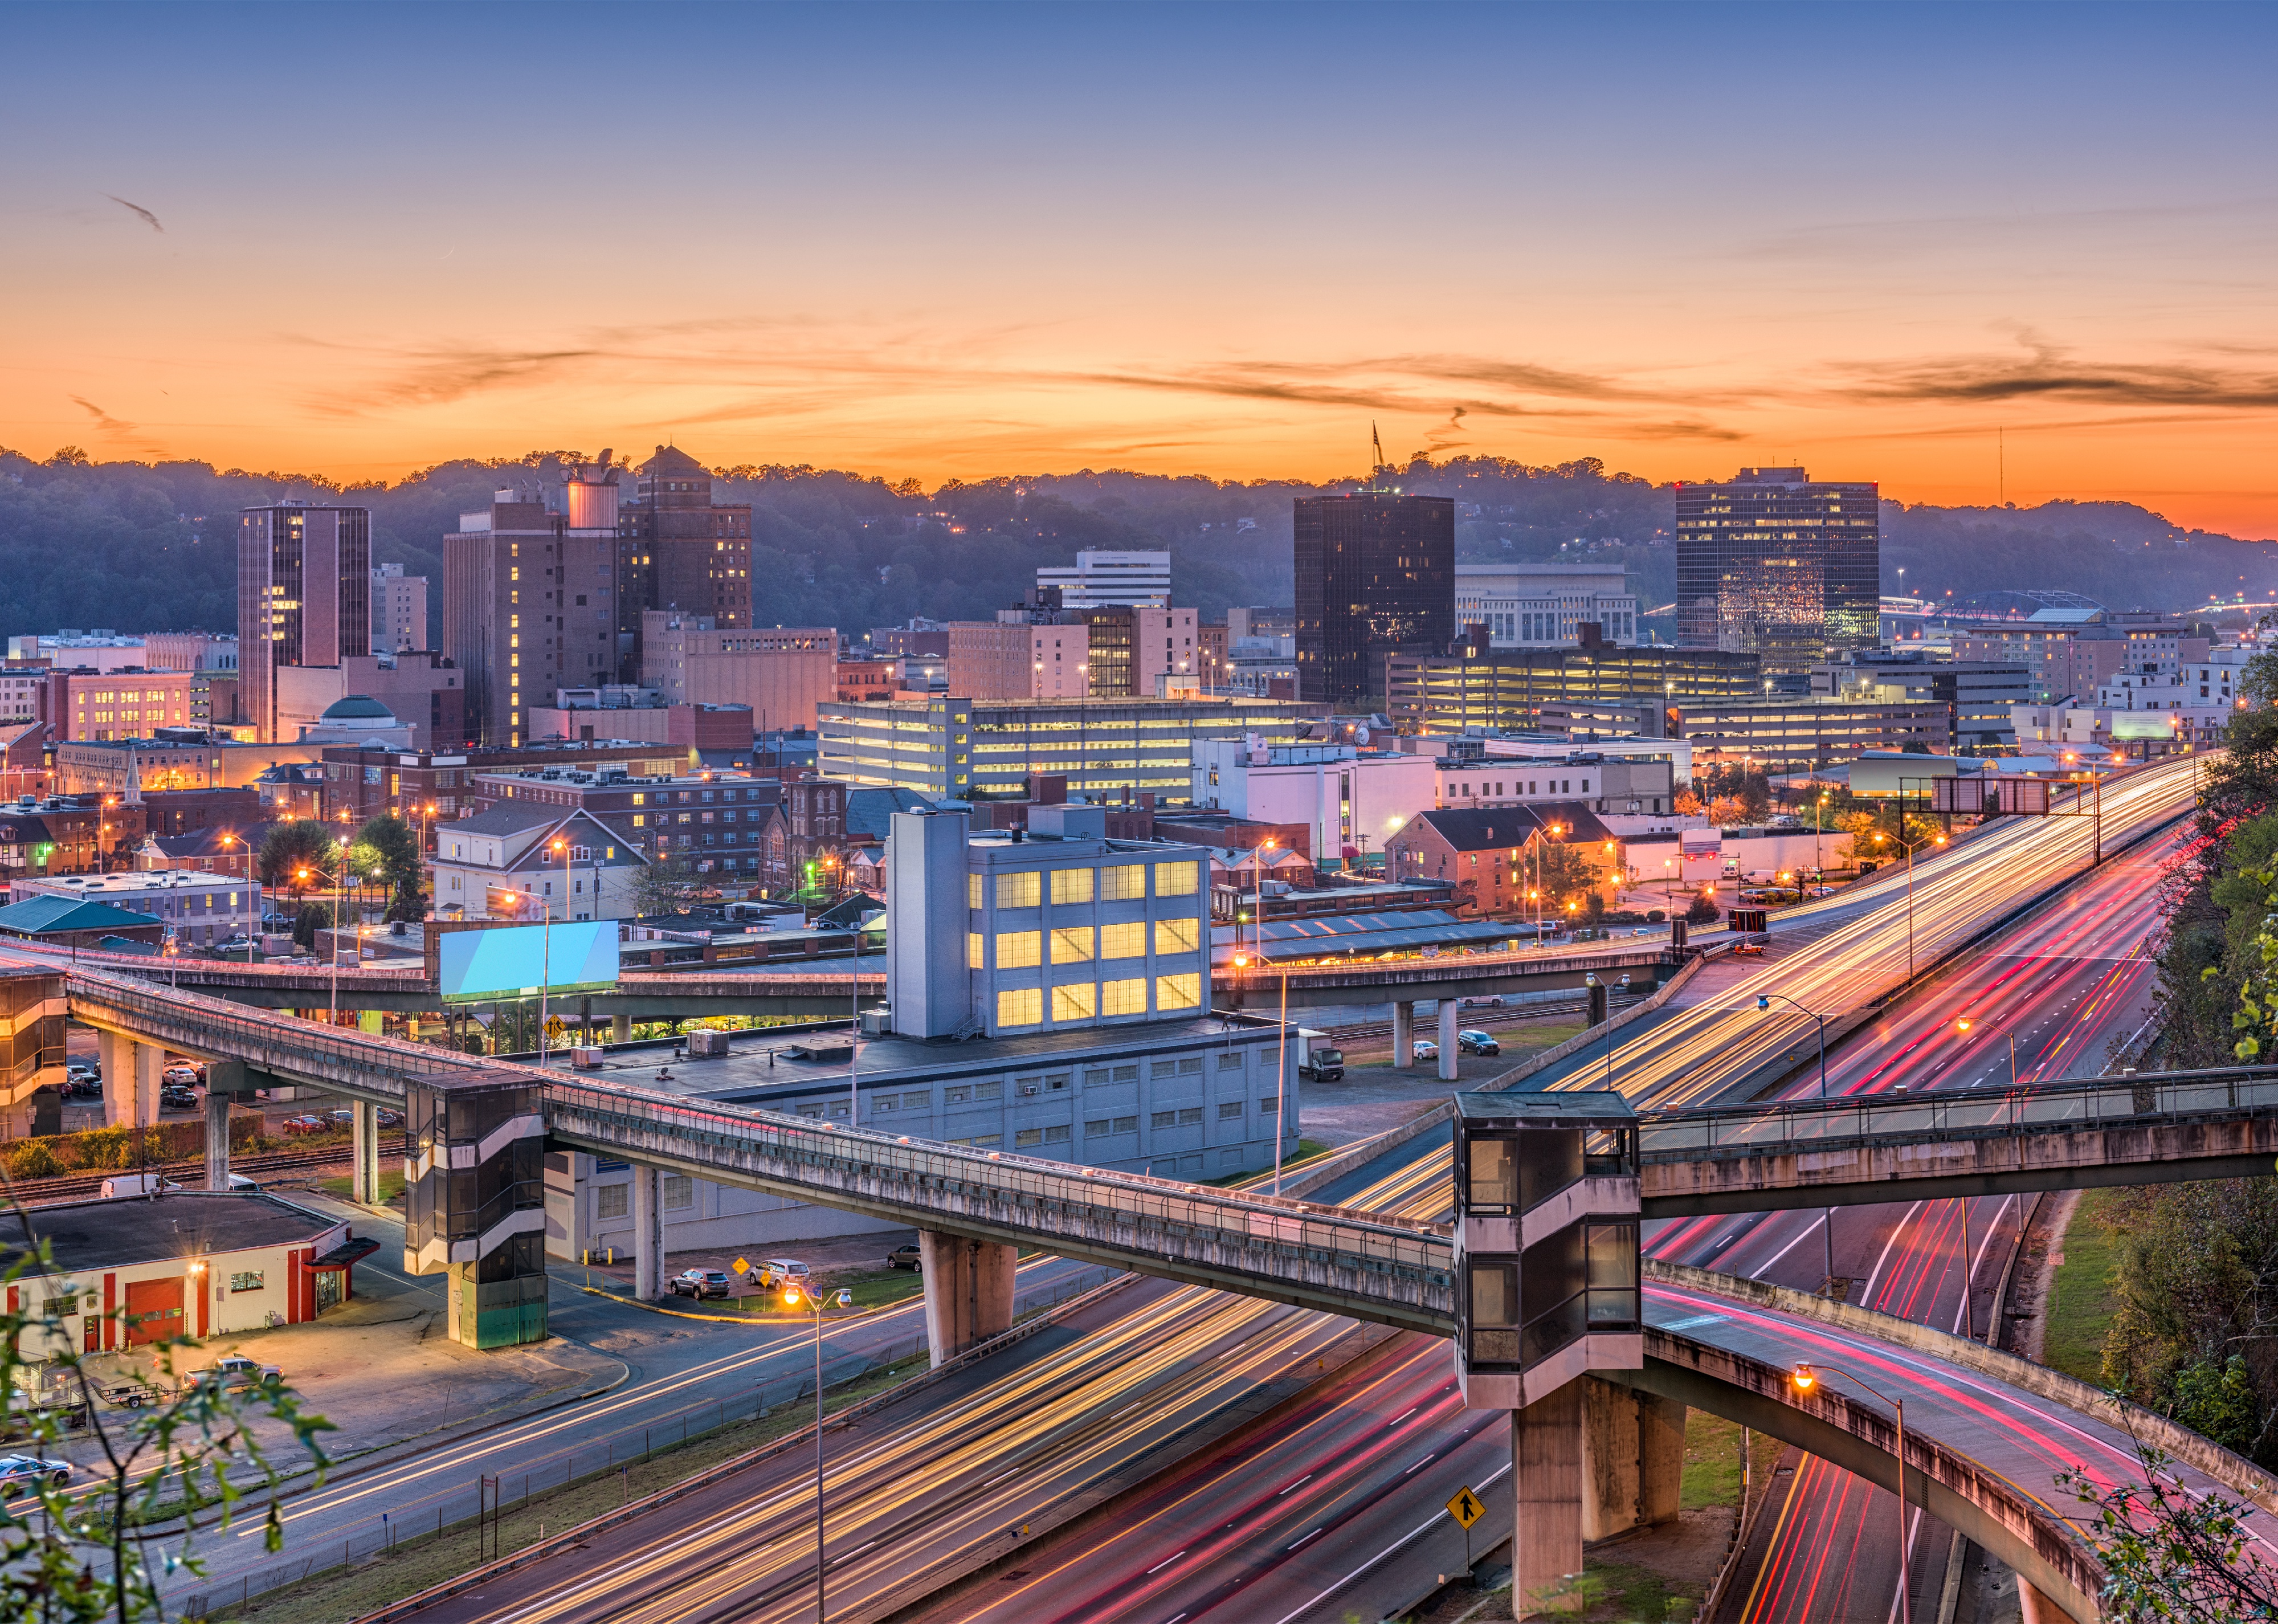
Sean Pavone // Shutterstock
#26. West Virginia
Charleston skyline at twilight.
– Drunken driving fatalities per 100k residents: 3.6 (65, 23% of all car crash fatalities)
– Fatalities involving driver with BAC 0.15 and above: 2.6 per 100K (47, 72.3% of all drunken driving fatalities)
– Change in drunken driving fatalities from 2012: 30.9% decrease

Trevor Bexon // Shutterstock
#25. Nevada
A vehicle crash on the side of the freeway including a black jeep as firefighters assess the damage.
– Drunken driving fatalities per 100k residents: 3.7 (116, 30% of all car crash fatalities)
– Fatalities involving driver with BAC 0.15 and above: 2.5 per 100K (80, 69% of all drunken driving fatalities)
– Change in drunken driving fatalities from 2012: 36.5% increase
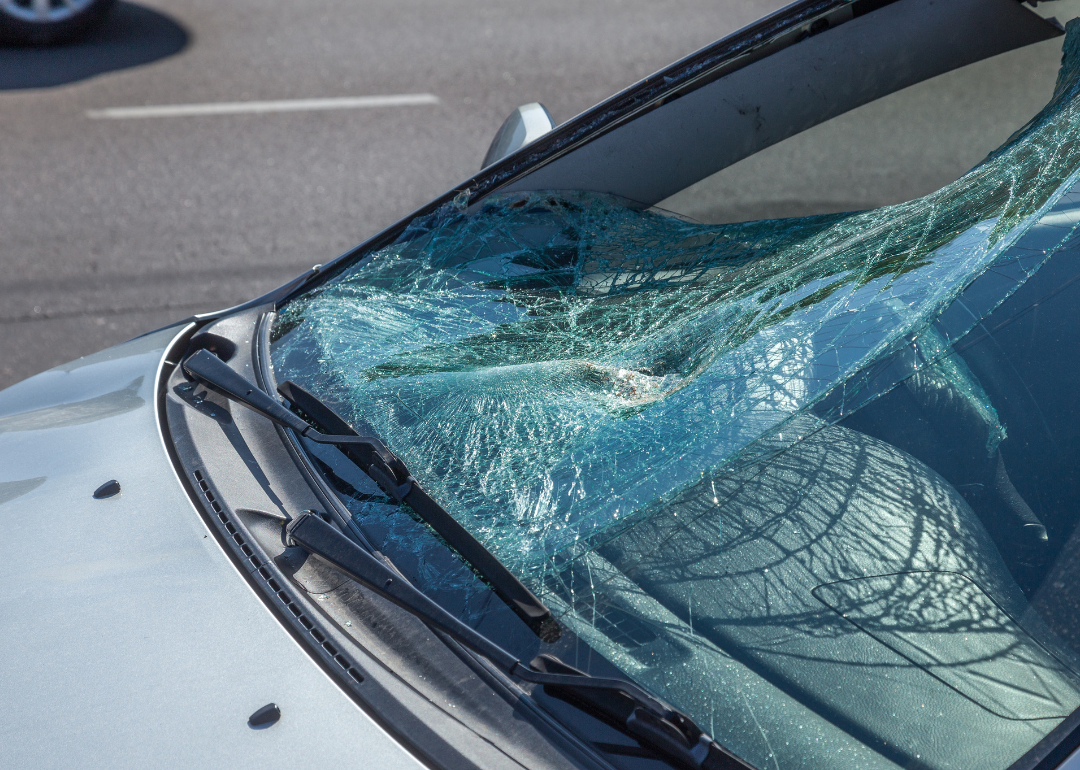
A_Lesik // Shutterstock
#24. Iowa
Close up of a broken windshield.
– Drunken driving fatalities per 100k residents: 3.7 (118, 33% of all car crash fatalities)
– Fatalities involving driver with BAC 0.15 and above: 2.4 per 100K (78, 66.1% of all drunken driving fatalities)
– Change in drunken driving fatalities from 2012: 22.9% increase

barteverett // Shutterstock
#23. Kansas
Highway at the state line in western Kansas.
– Drunken driving fatalities per 100k residents: 3.7 (109, 26% of all car crash fatalities)
– Fatalities involving driver with BAC 0.15 and above: 2.6 per 100K (76, 69.7% of all drunken driving fatalities)
– Change in drunken driving fatalities from 2012: 4.8% increase
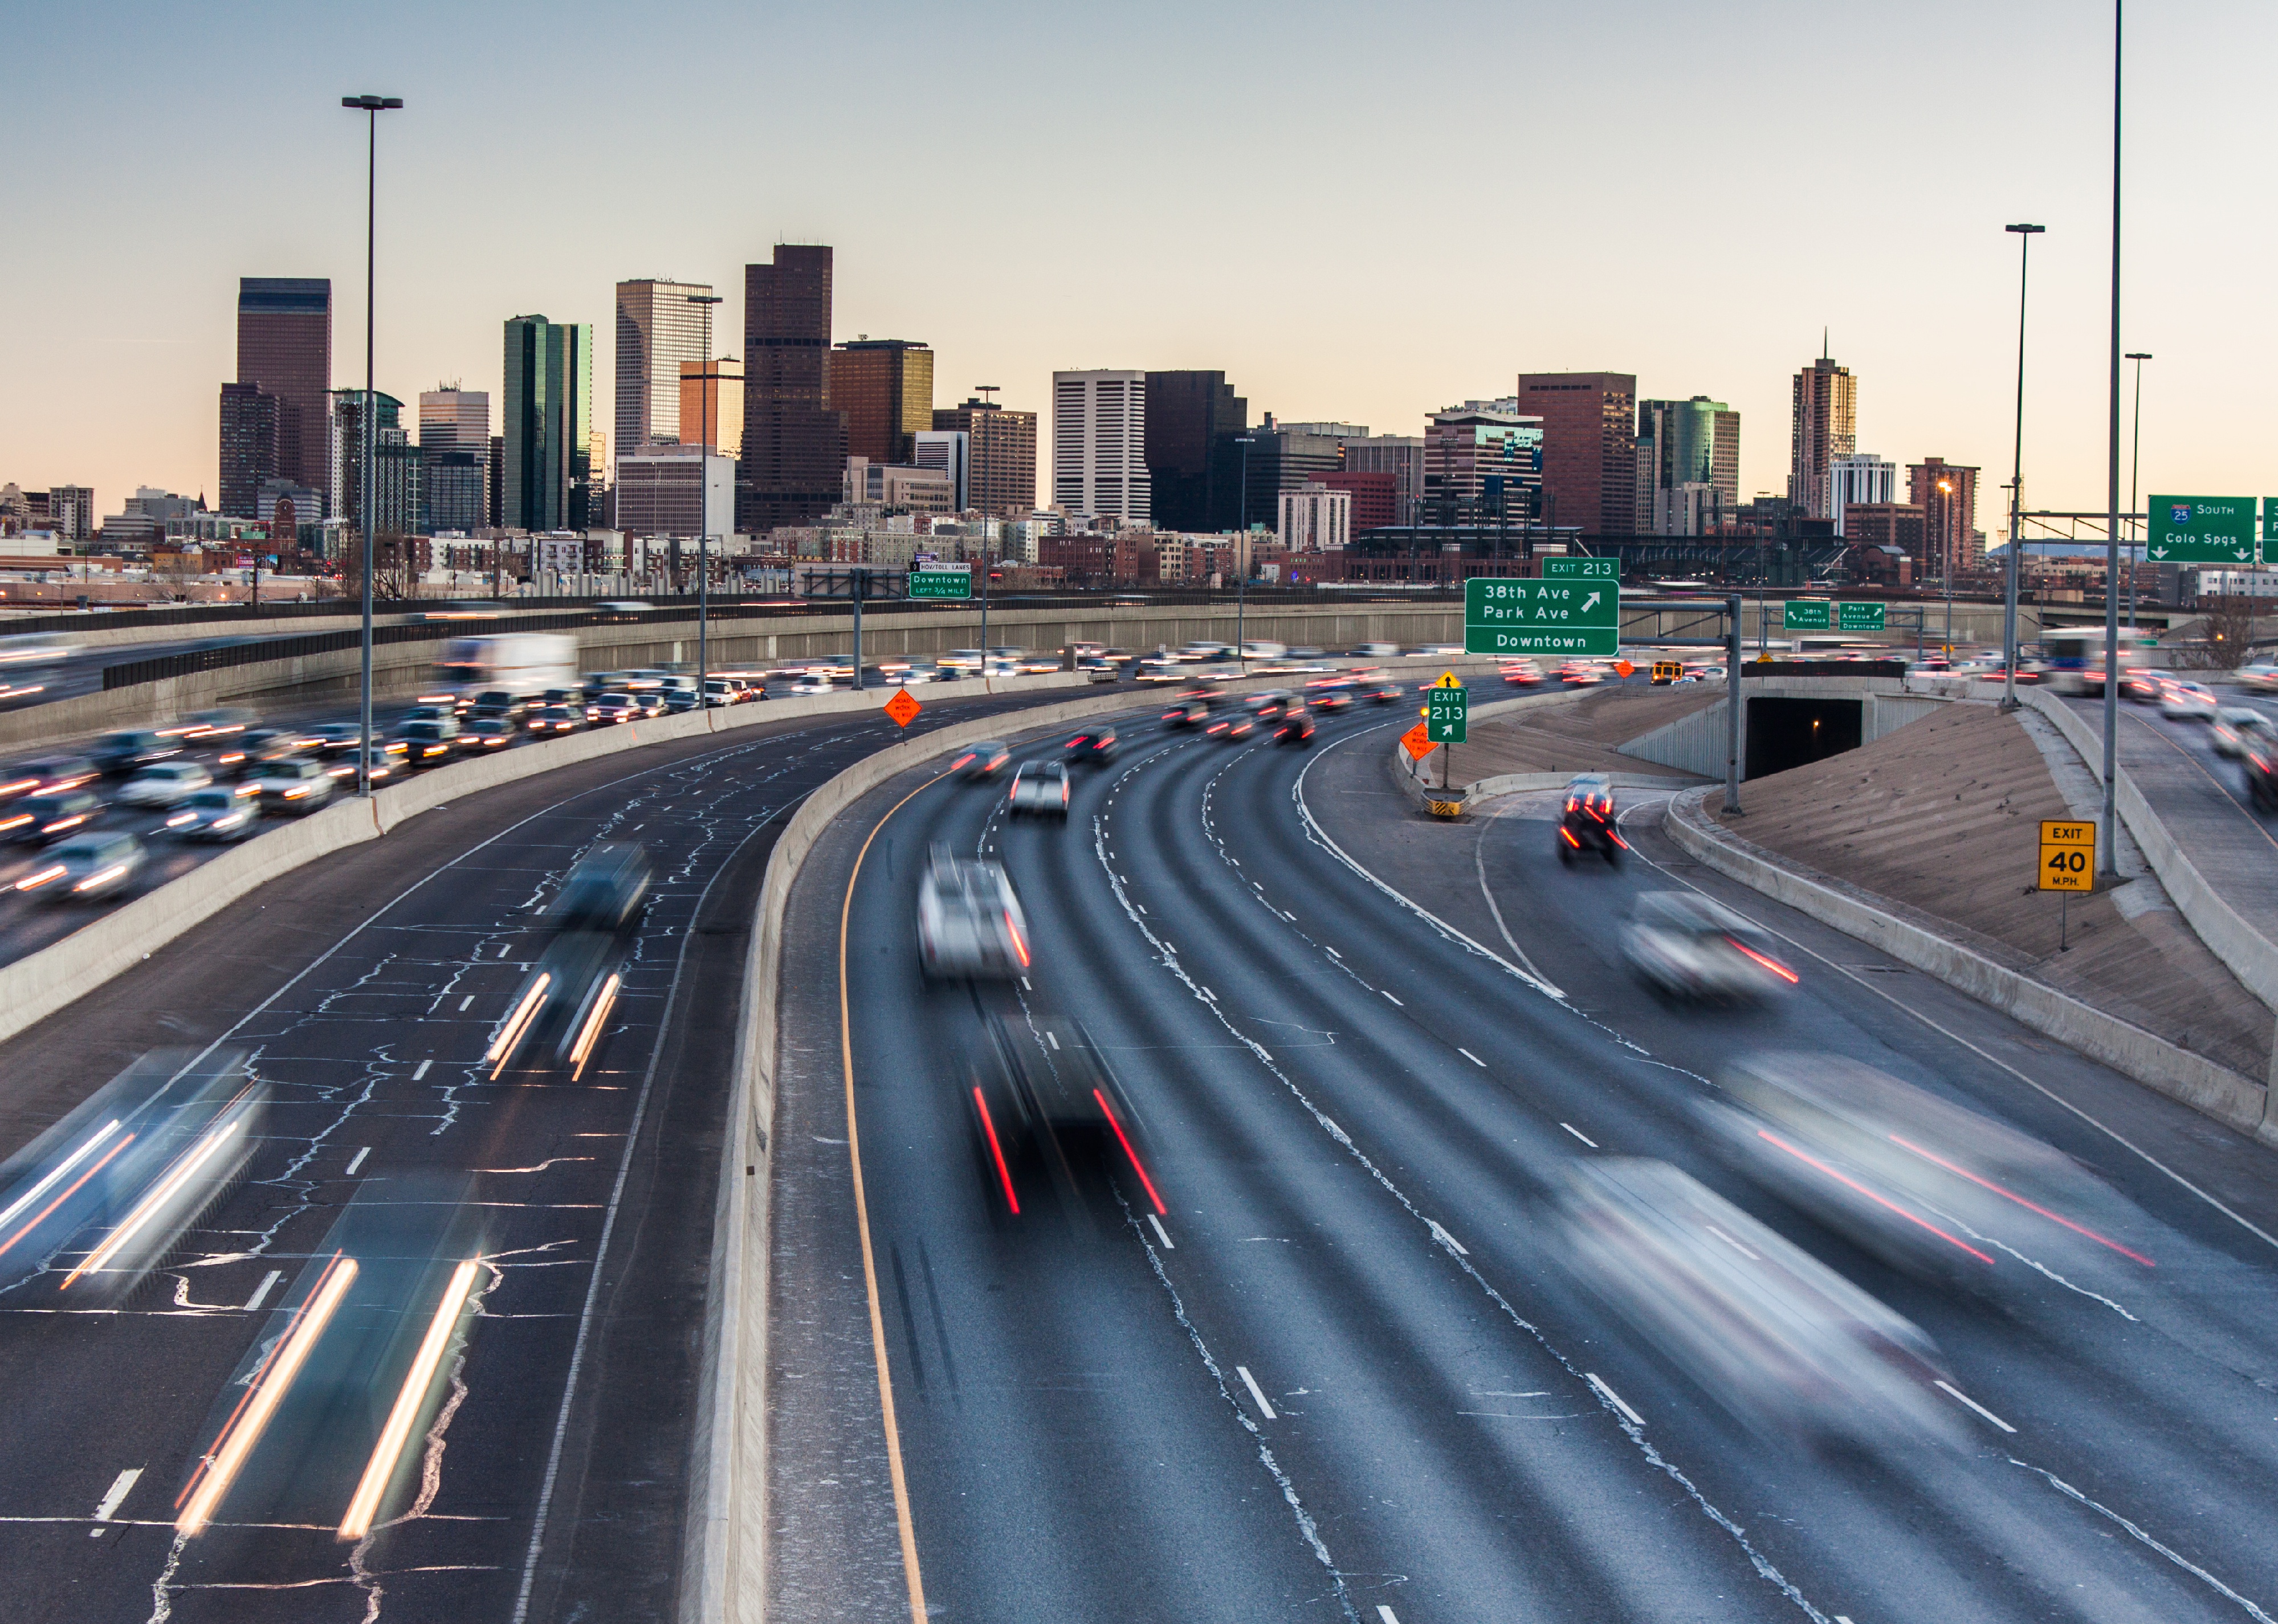
Paul Gana // Shutterstock
#22. Colorado
Rush hour traffic on I-25 looking toward downtown Denver.
– Drunken driving fatalities per 100k residents: 3.7 (216, 31% of all car crash fatalities)
– Fatalities involving driver with BAC 0.15 and above: 2.7 per 100K (158, 73.1% of all drunken driving fatalities)
– Change in drunken driving fatalities from 2012: 61.2% increase
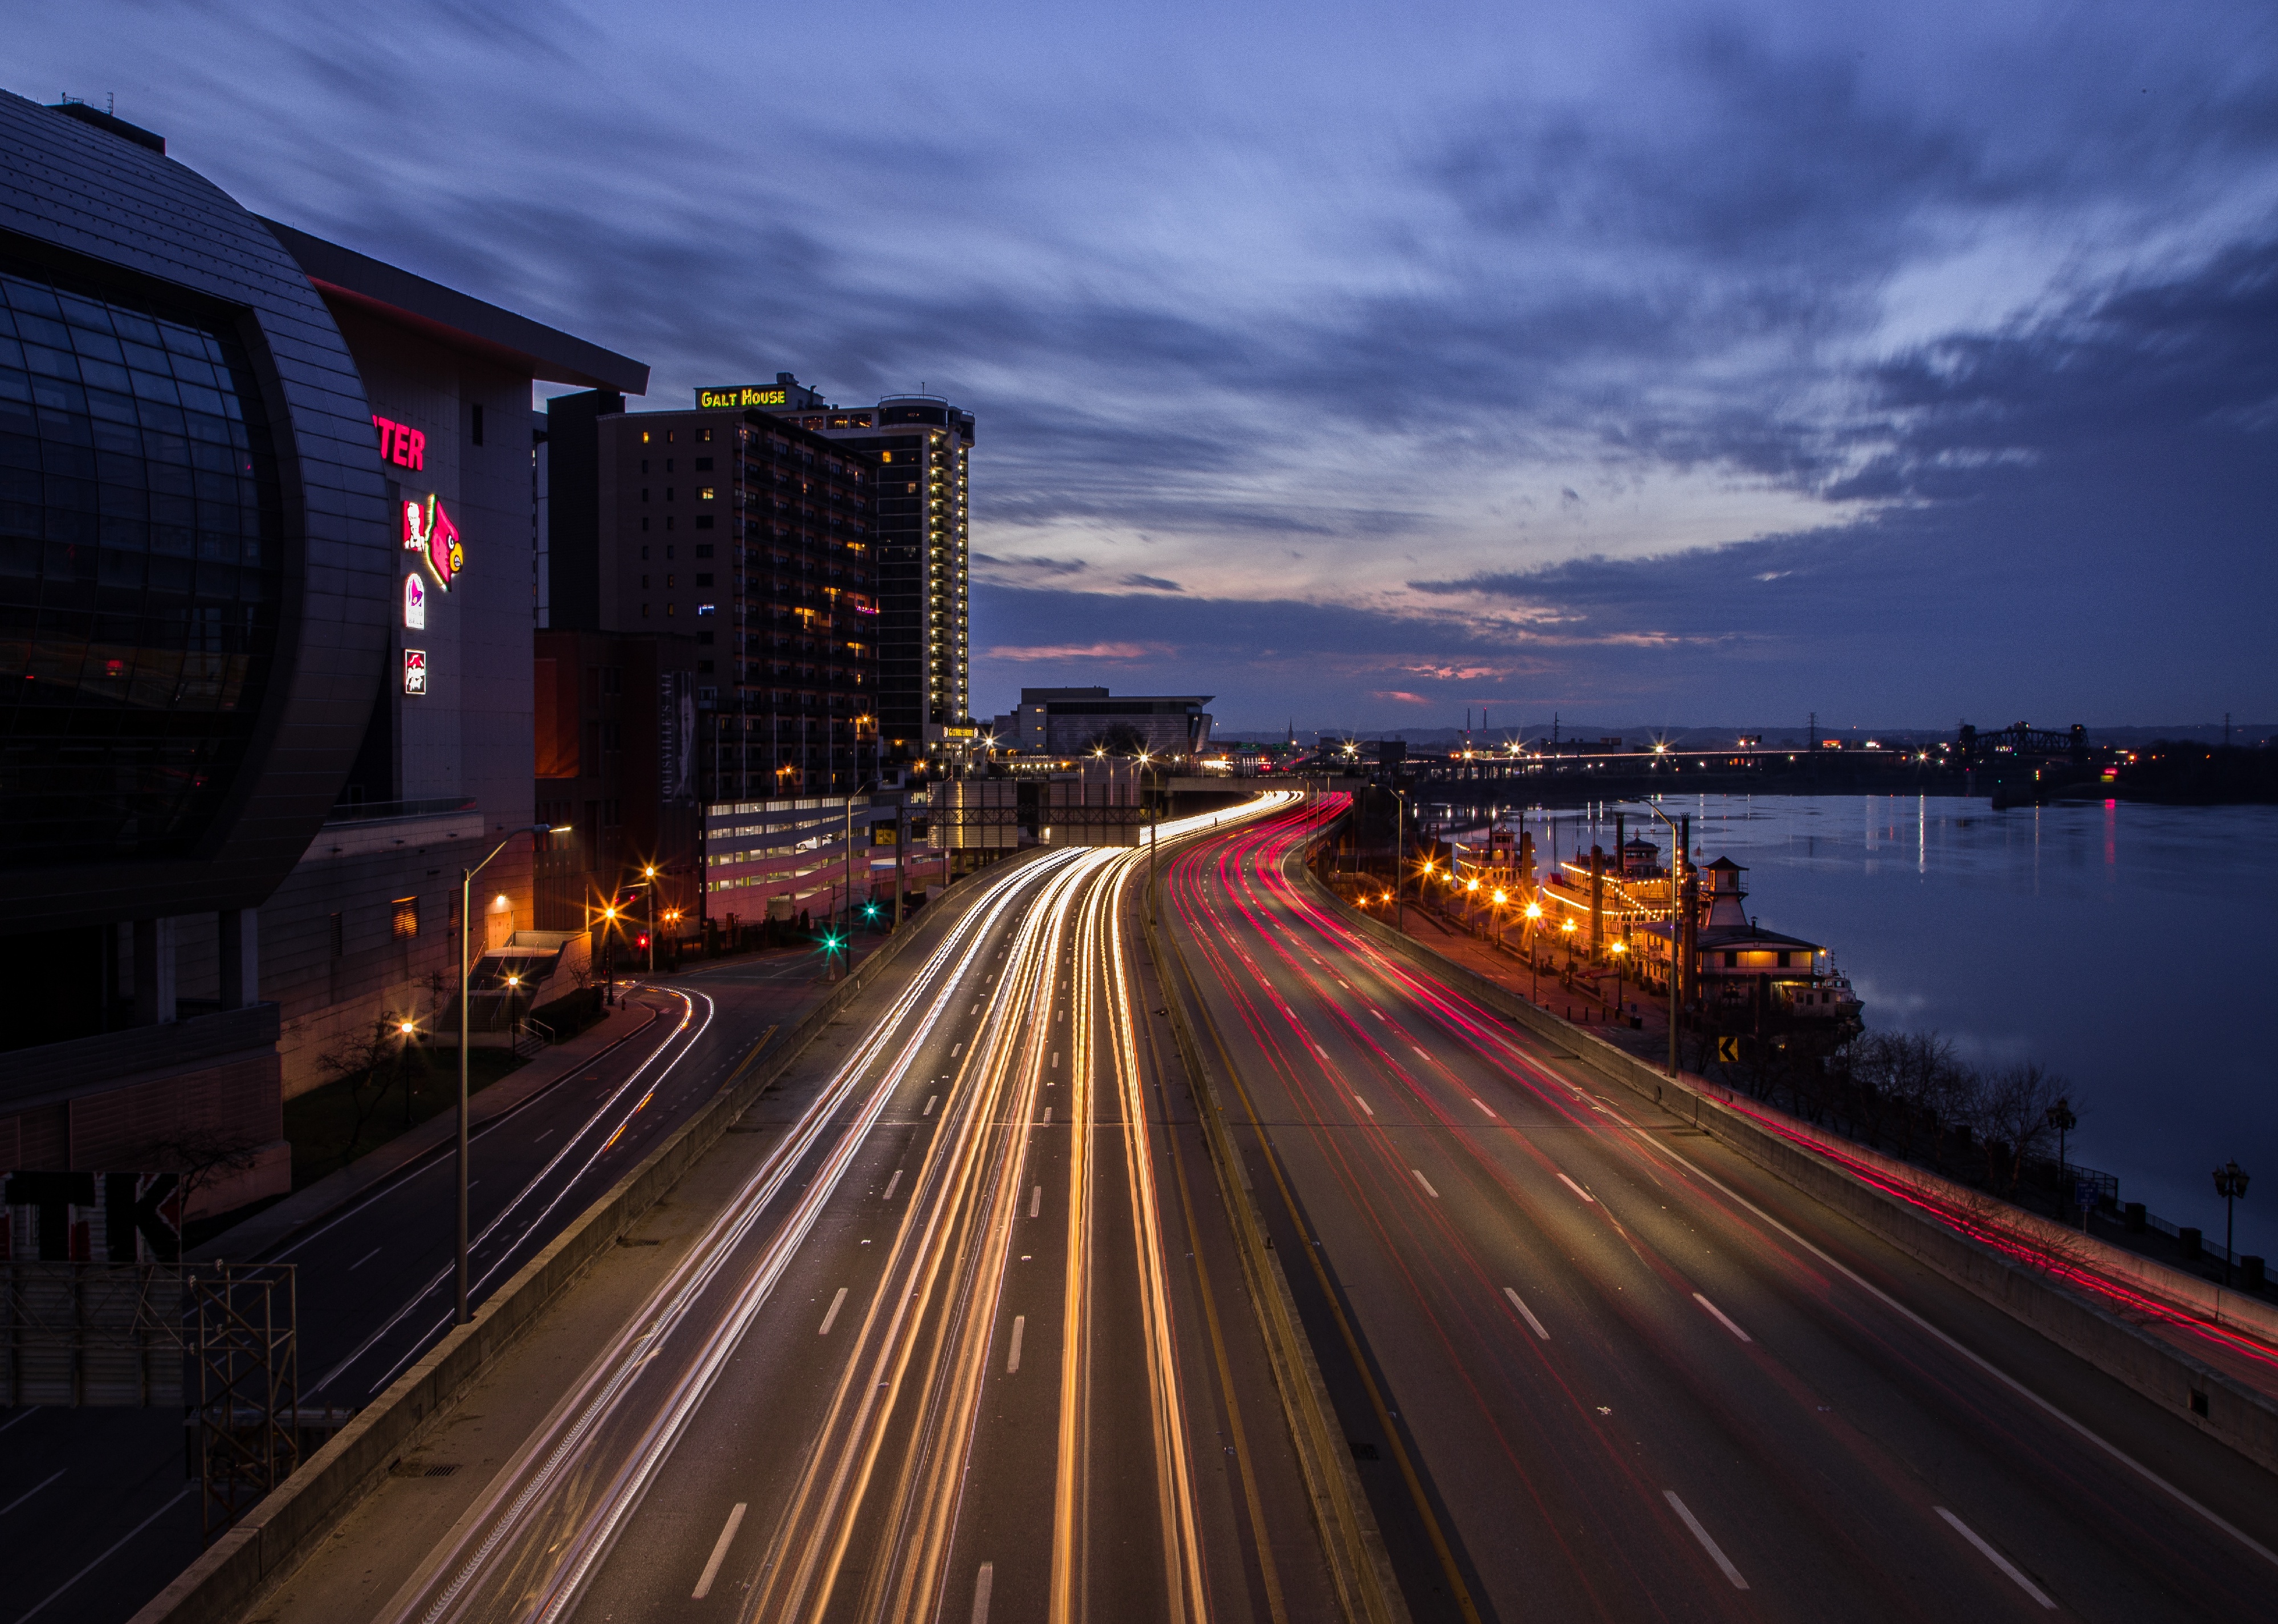
Wirestock Creators // Shutterstock
#21. Kentucky
A long exposure shot of car headlights at night on the interstate in Louisville.
– Drunken driving fatalities per 100k residents: 4.2 (190, 24% of all car crash fatalities)
– Fatalities involving driver with BAC 0.15 and above: 3.0 per 100K (136, 71.6% of all drunken driving fatalities)
– Change in drunken driving fatalities from 2012: 12.4% increase
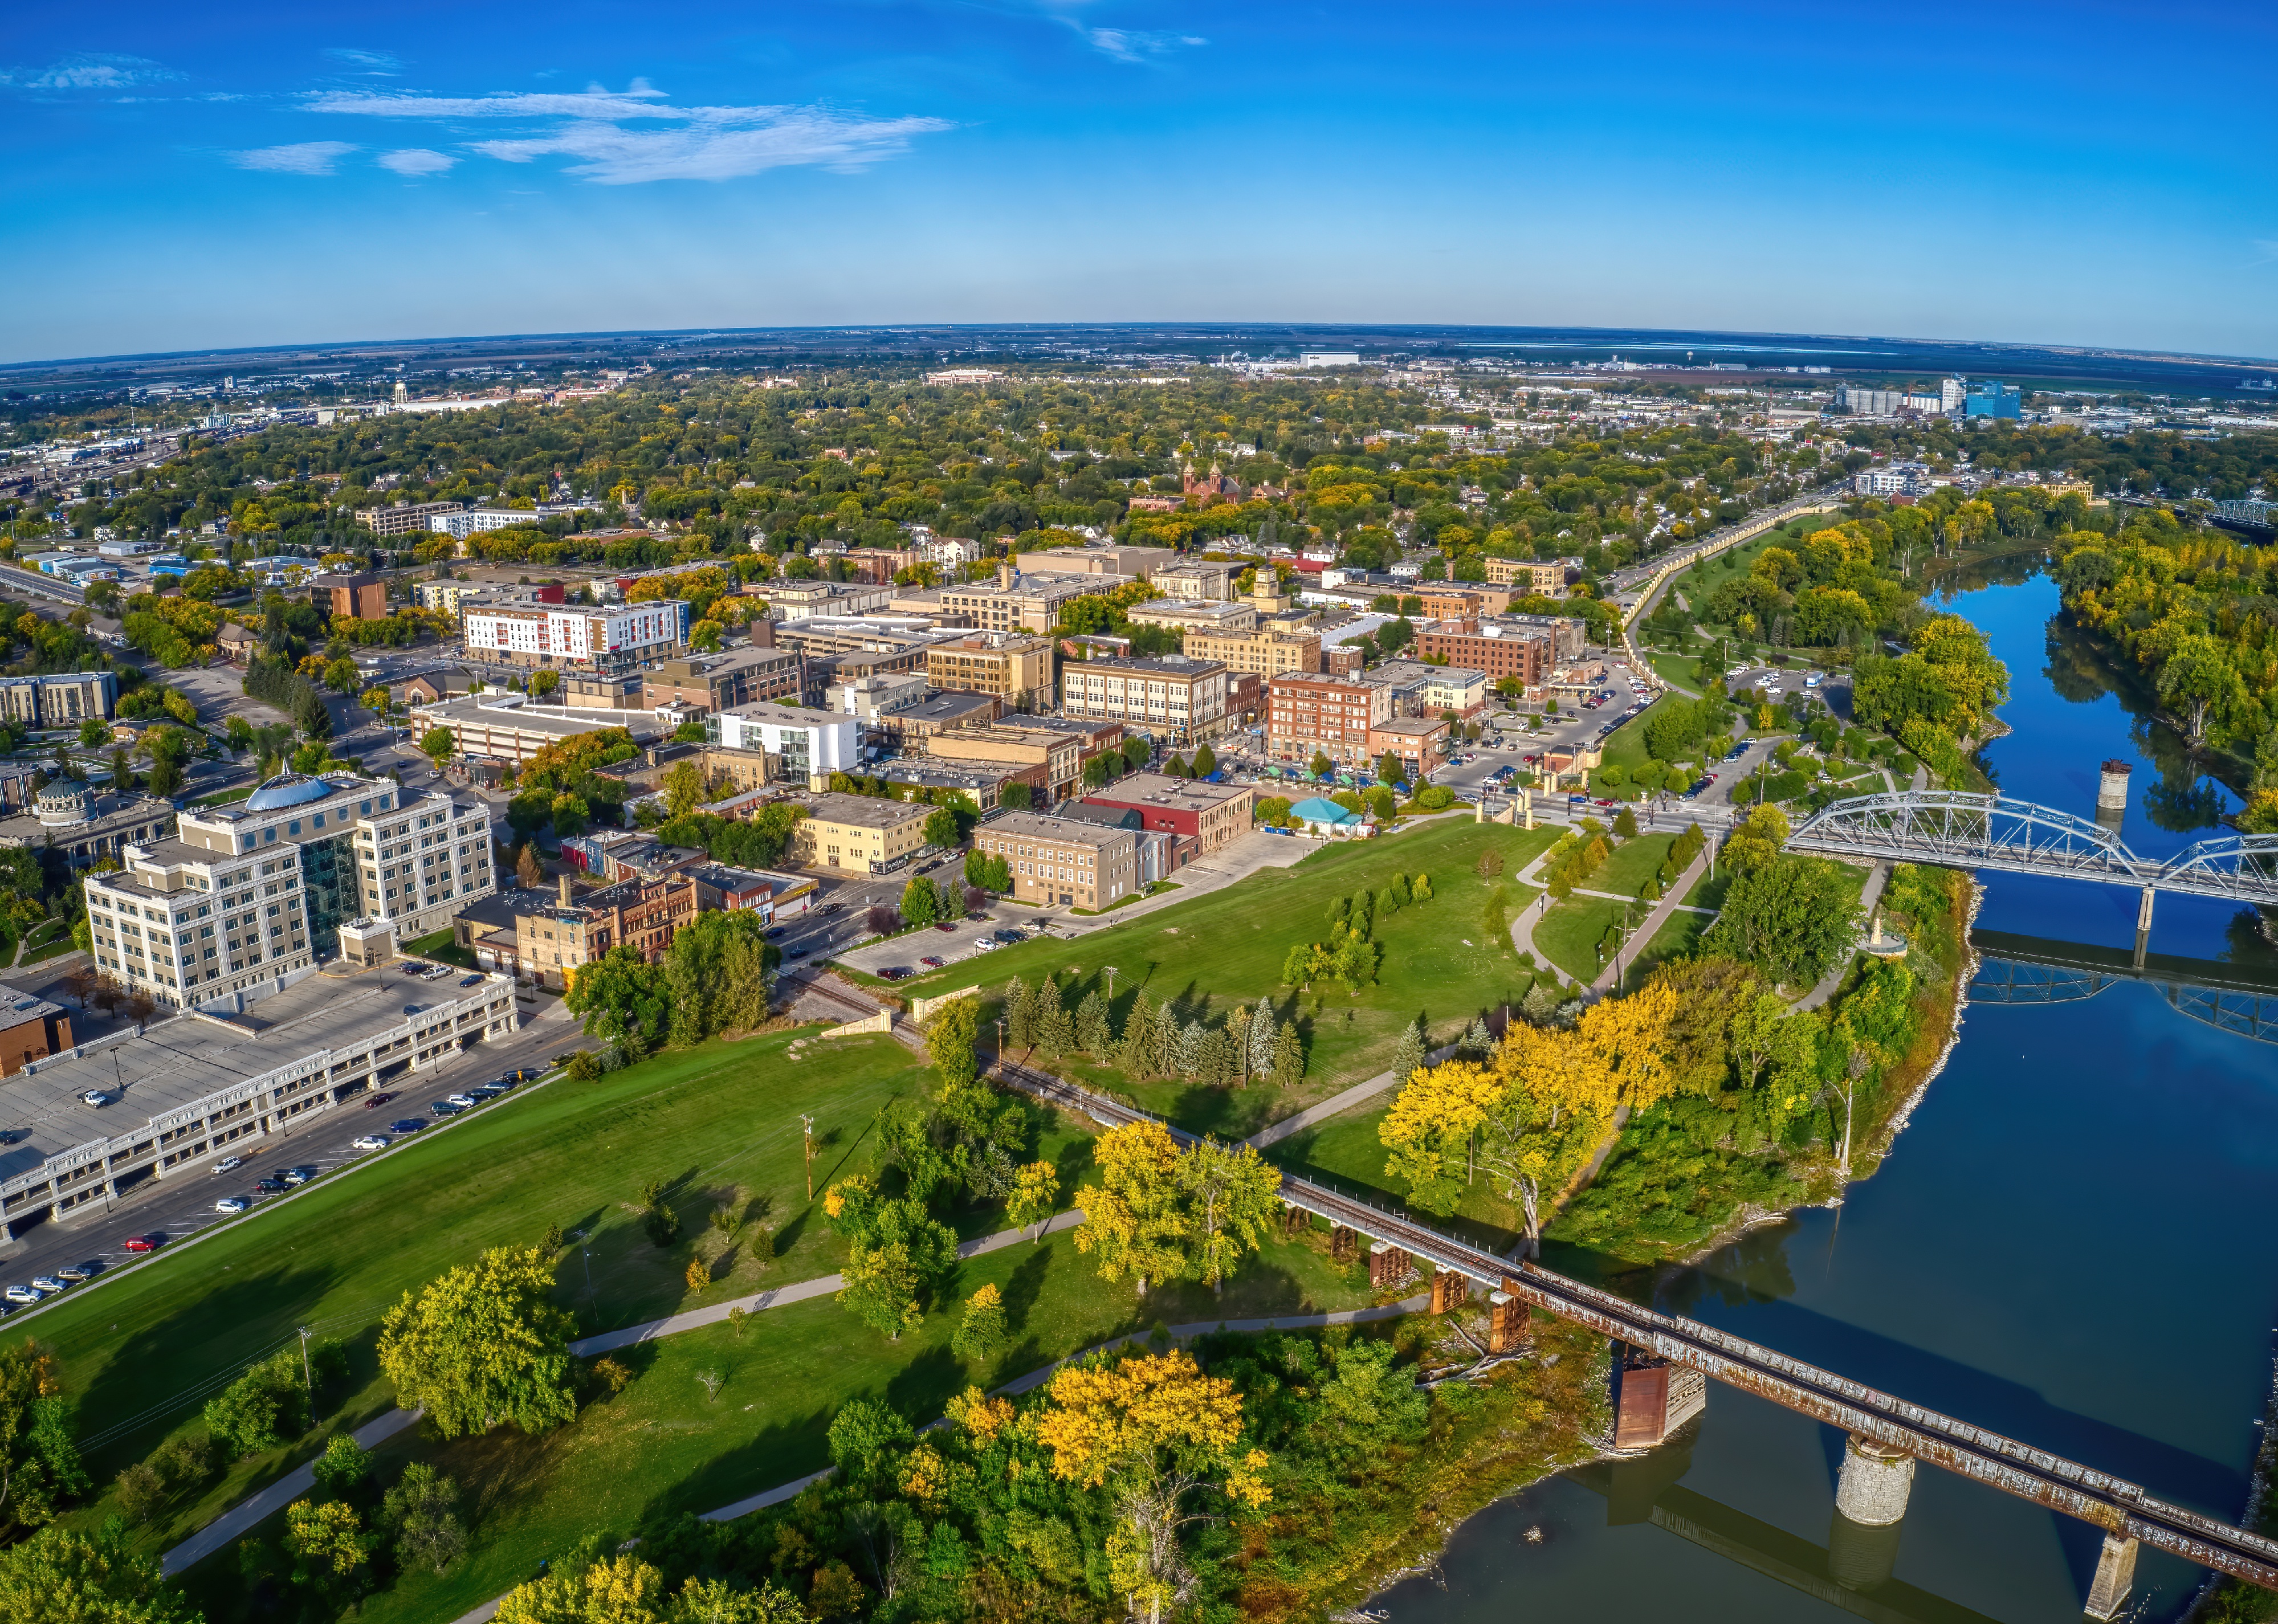
Jacob Boomsma // Shutterstock
#20. North Dakota
Aerial view of Grand Forks in autumn.
– Drunken driving fatalities per 100k residents: 4.2 (33, 33% of all car crash fatalities)
– Fatalities involving driver with BAC 0.15 and above: 3.3 per 100K (26, 78.8% of all drunken driving fatalities)
– Change in drunken driving fatalities from 2012: 54.2% decrease
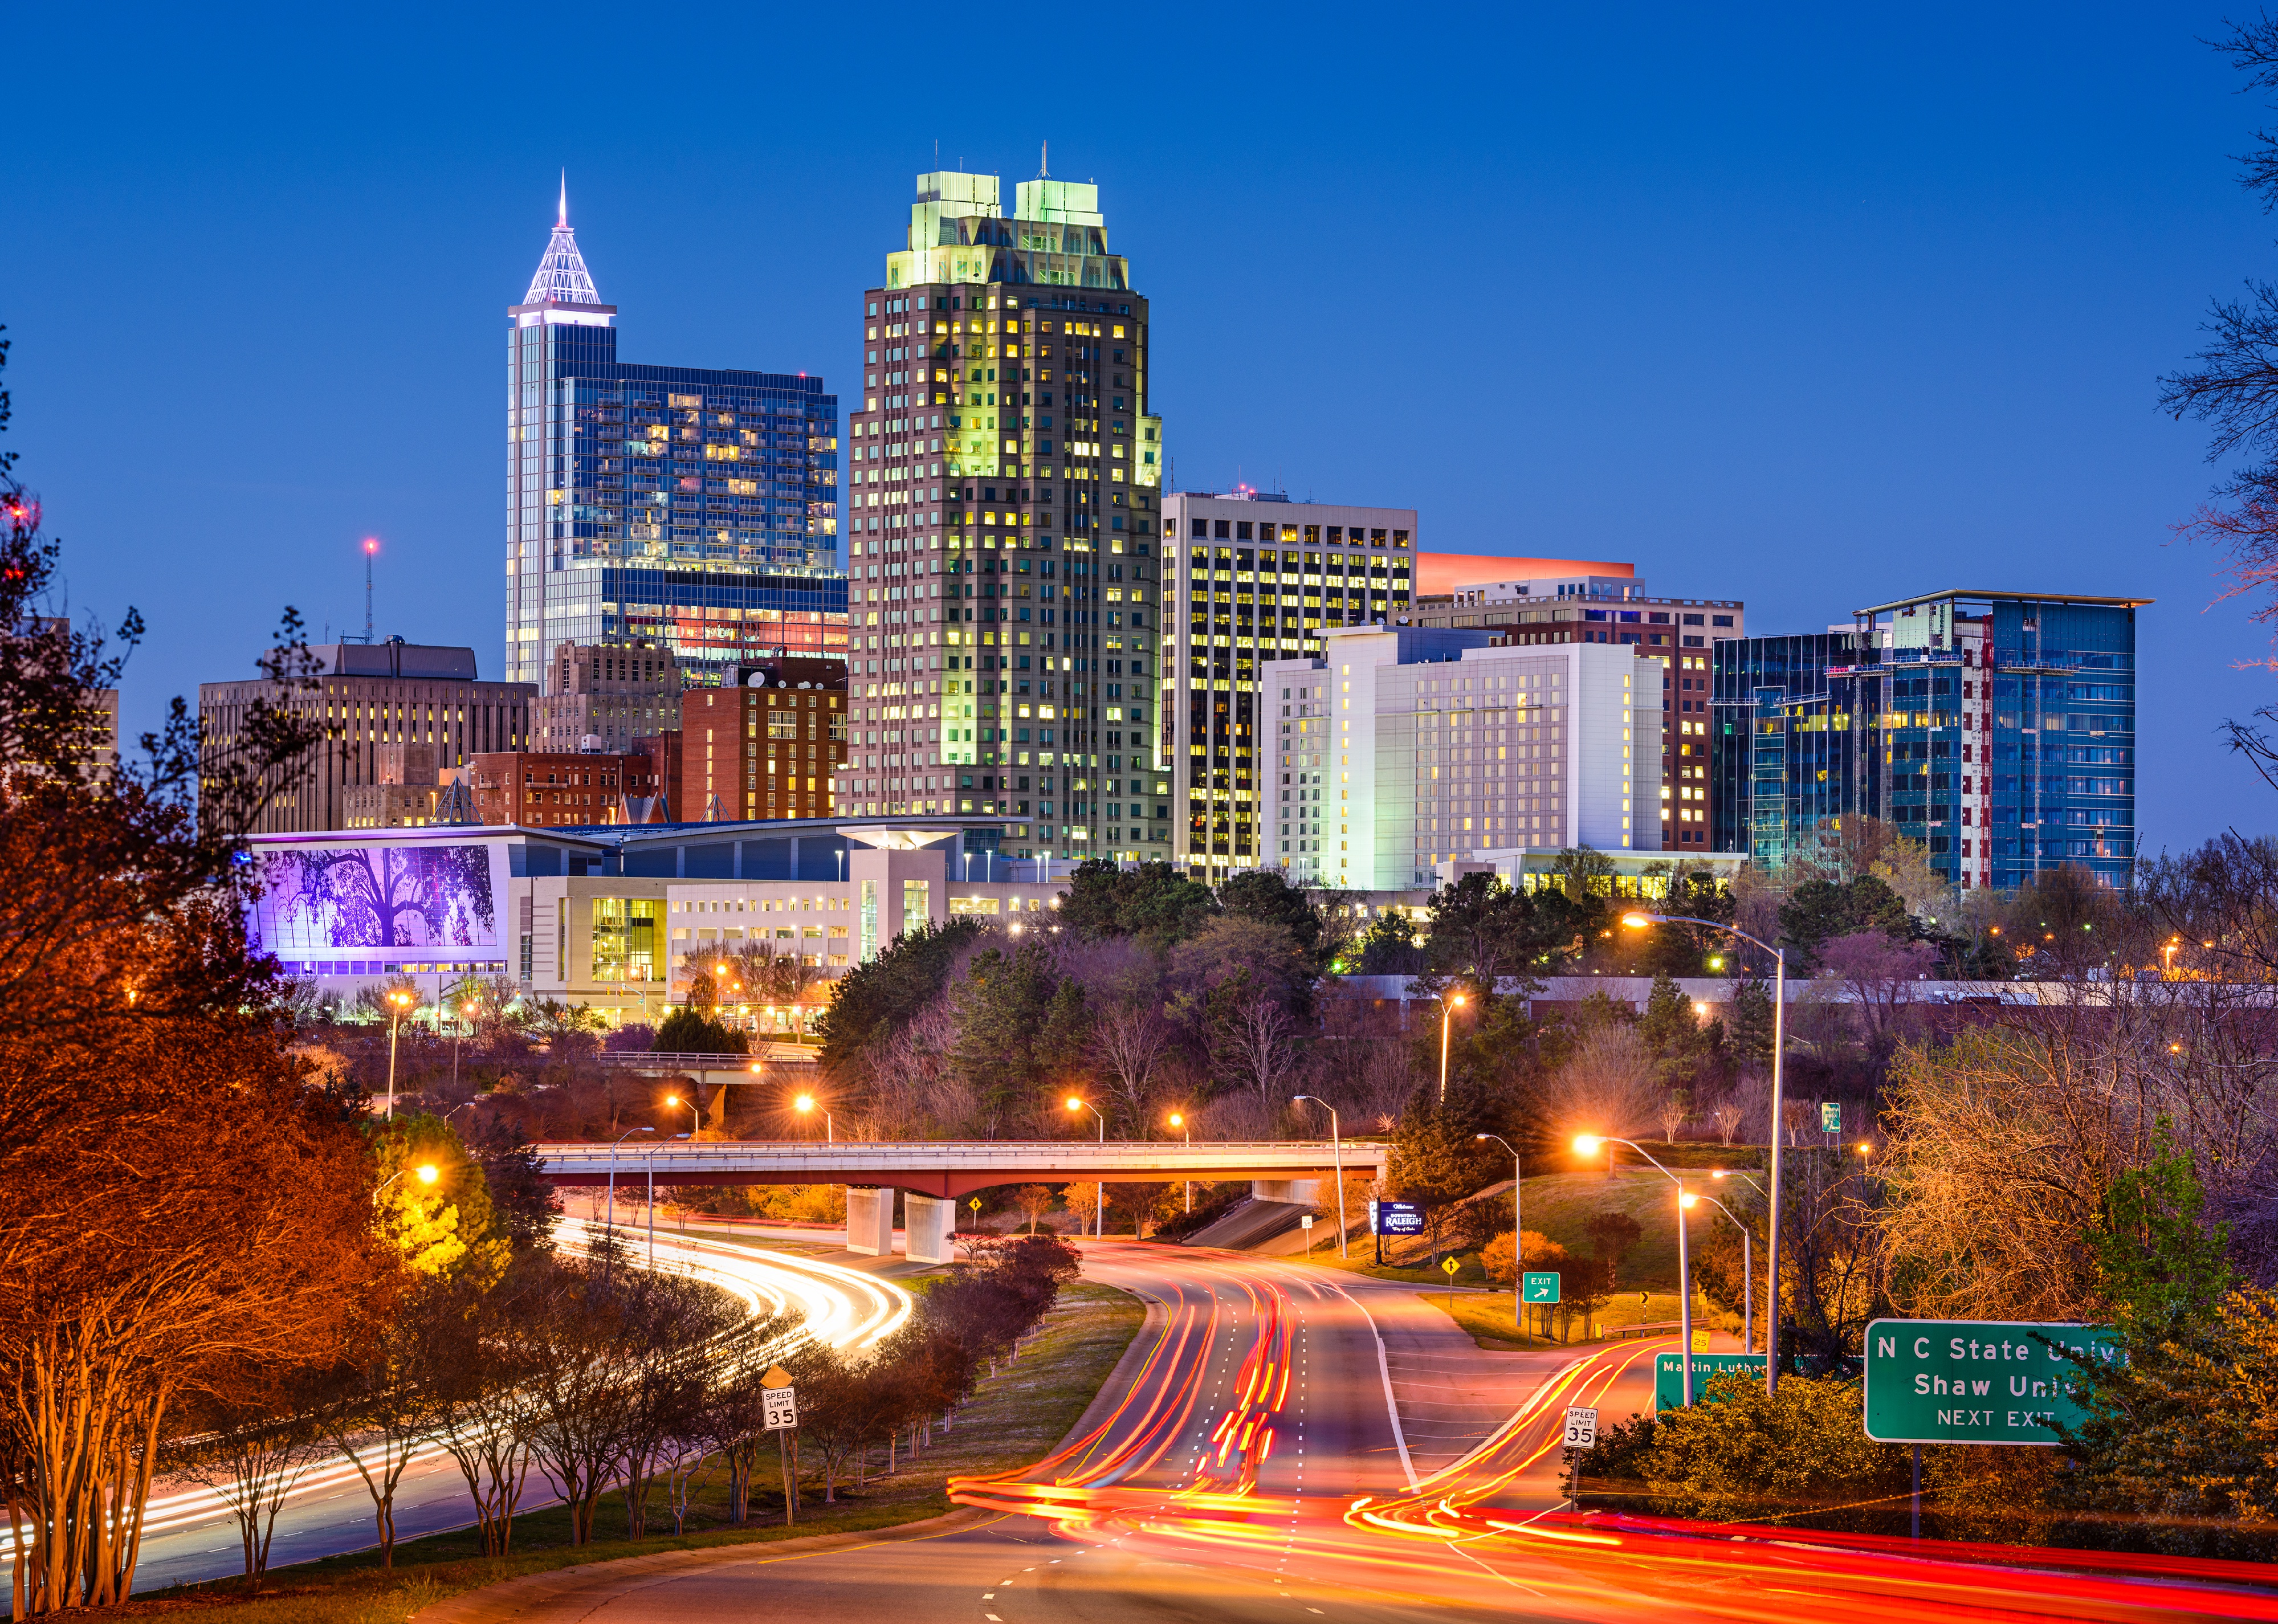
ESB Professional // Shutterstock
#19. North Carolina
Raleigh downtown city skyline.
– Drunken driving fatalities per 100k residents: 4.4 (466, 28% of all car crash fatalities)
– Fatalities involving driver with BAC 0.15 and above: 2.8 per 100K (300, 64.4% of all drunken driving fatalities)
– Change in drunken driving fatalities from 2012: 25.3% increase

steve estvanik // Shutterstock
#18. Idaho
Traffic accident on an icy Idaho mountain highway.
– Drunken driving fatalities per 100k residents: 4.5 (85, 31% of all car crash fatalities)
– Fatalities involving driver with BAC 0.15 and above: 3.4 per 100K (65, 76.5% of all drunken driving fatalities)
– Change in drunken driving fatalities from 2012: 63.5% increase
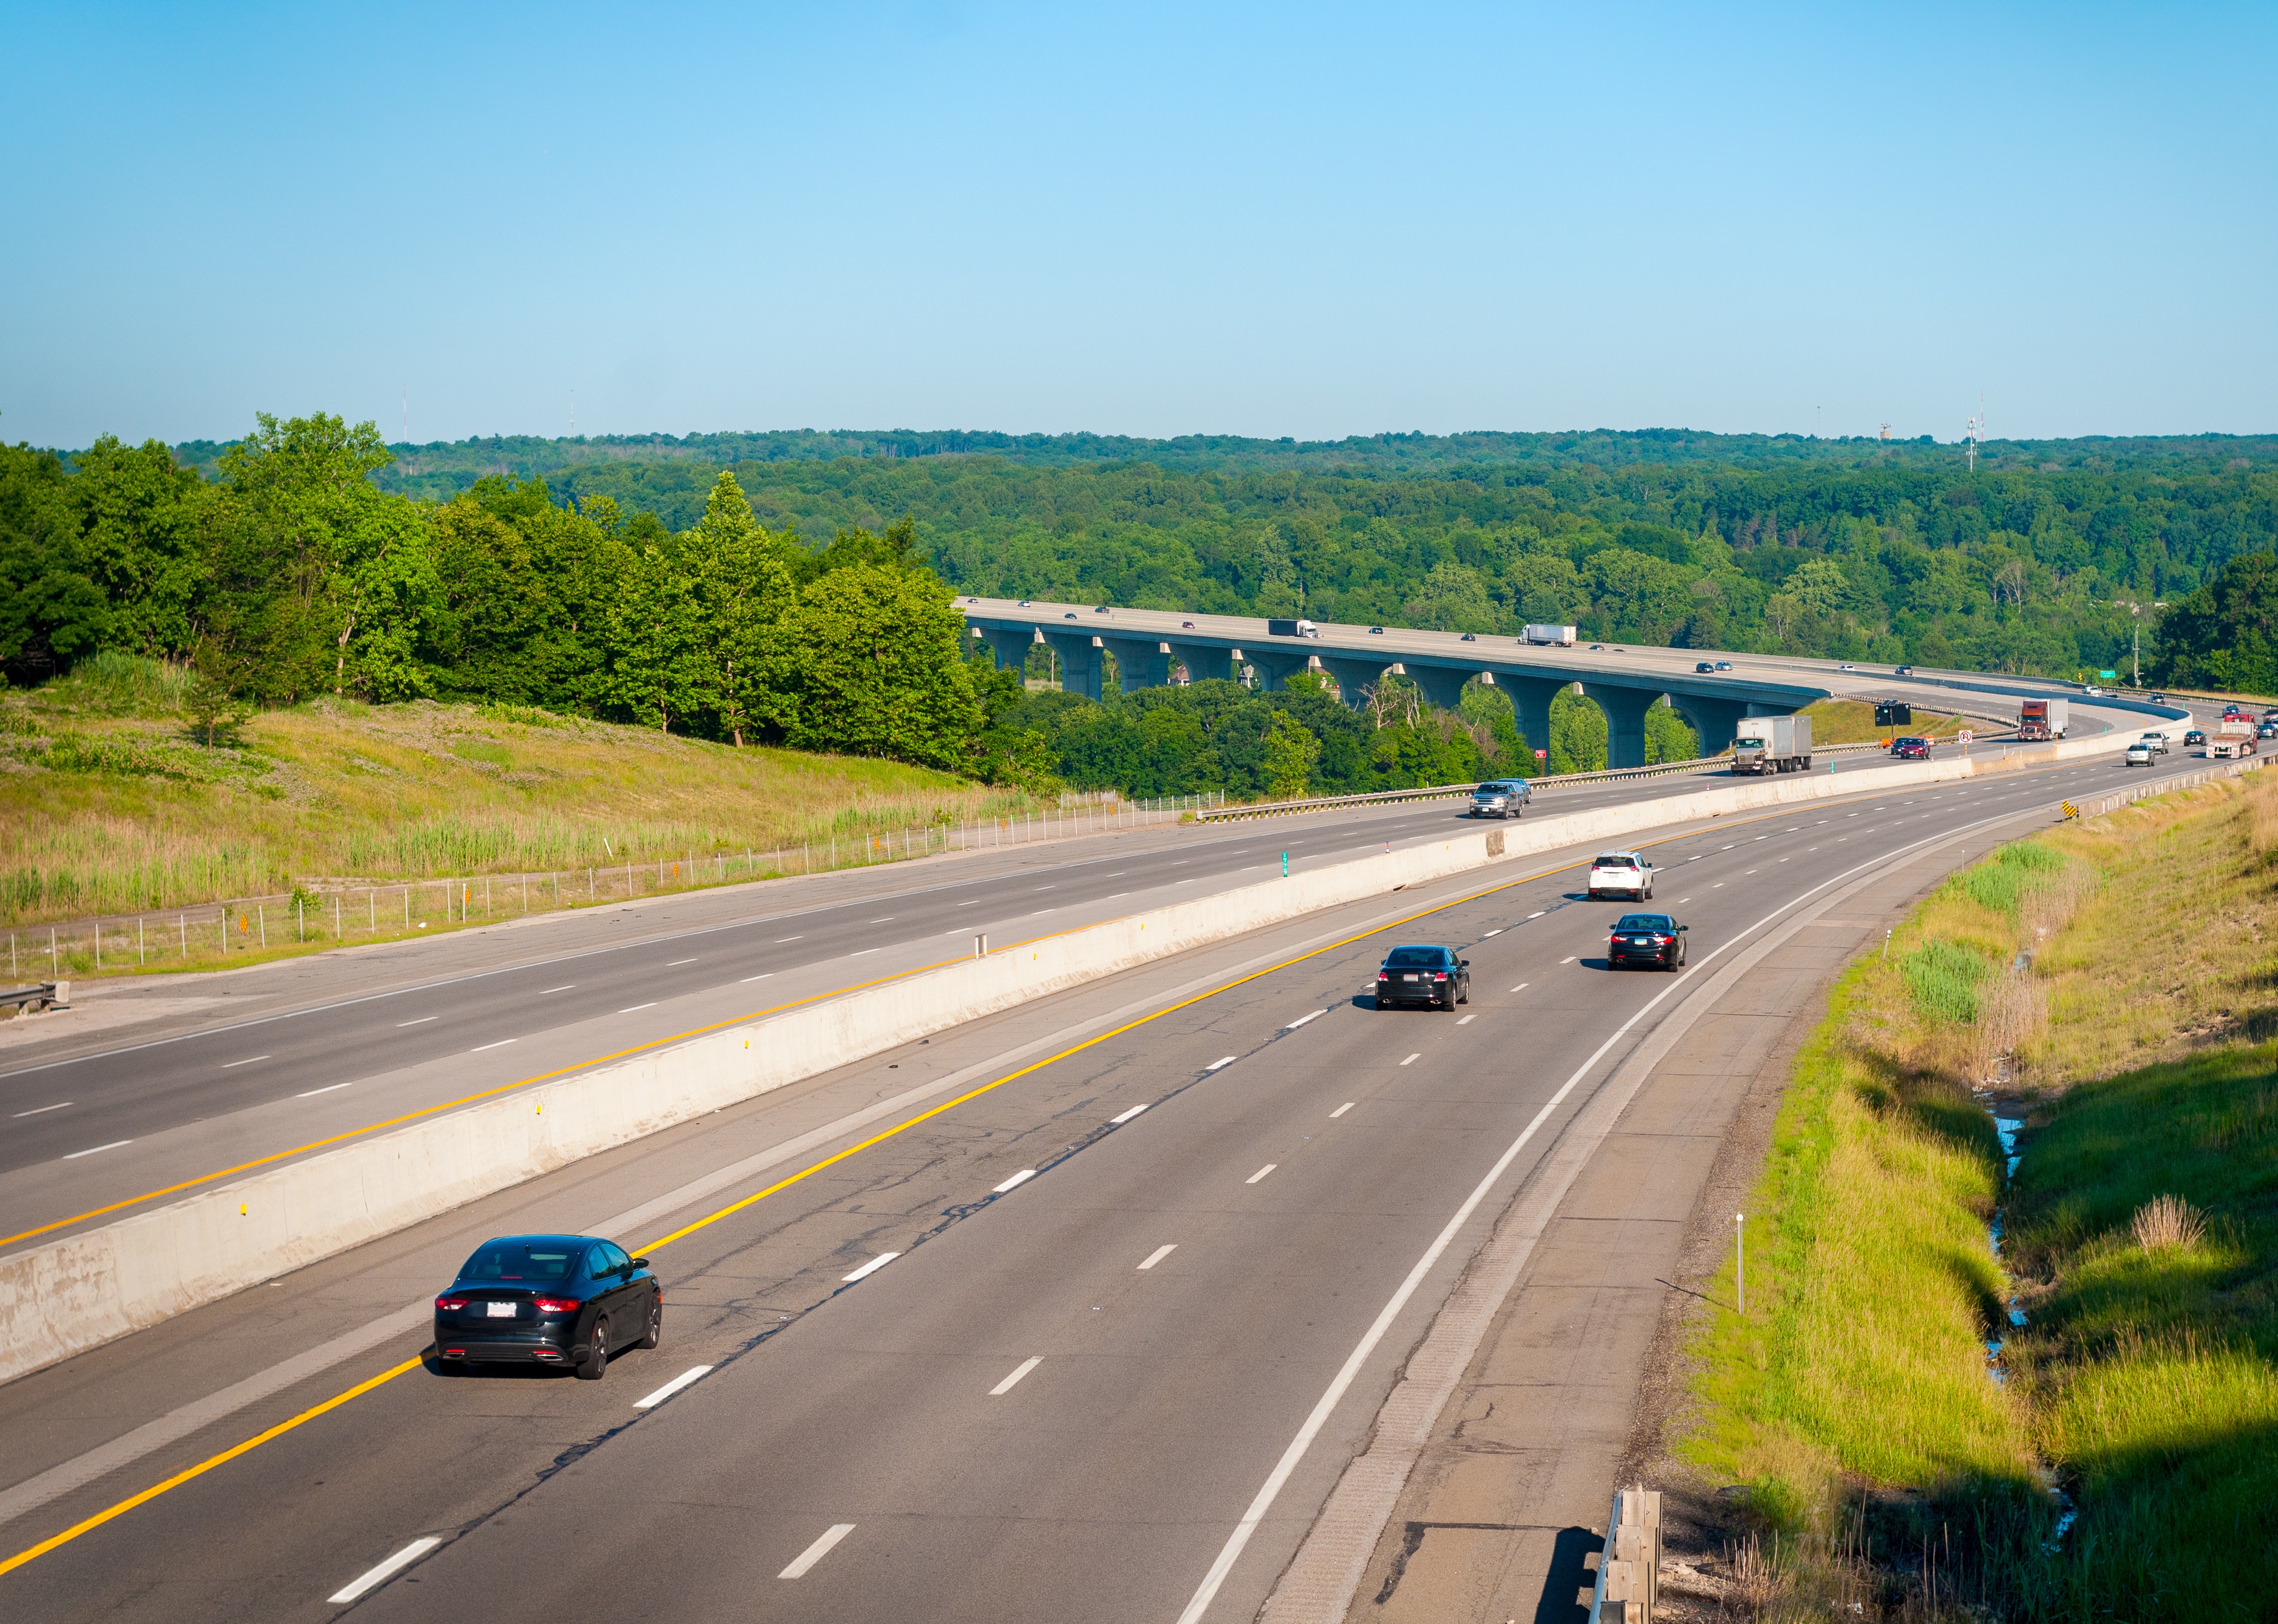
Kenneth Sponsler // Shutterstock
#17. Ohio
The Ohio Turnpike, Interstate 80, crosses the Cuyahoga Valley south of Cleveland.
– Drunken driving fatalities per 100k residents: 4.5 (531, 39% of all car crash fatalities)
– Fatalities involving driver with BAC 0.15 and above: 3.2 per 100K (373, 70.2% of all drunken driving fatalities)
– Change in drunken driving fatalities from 2012: 36.5% increase
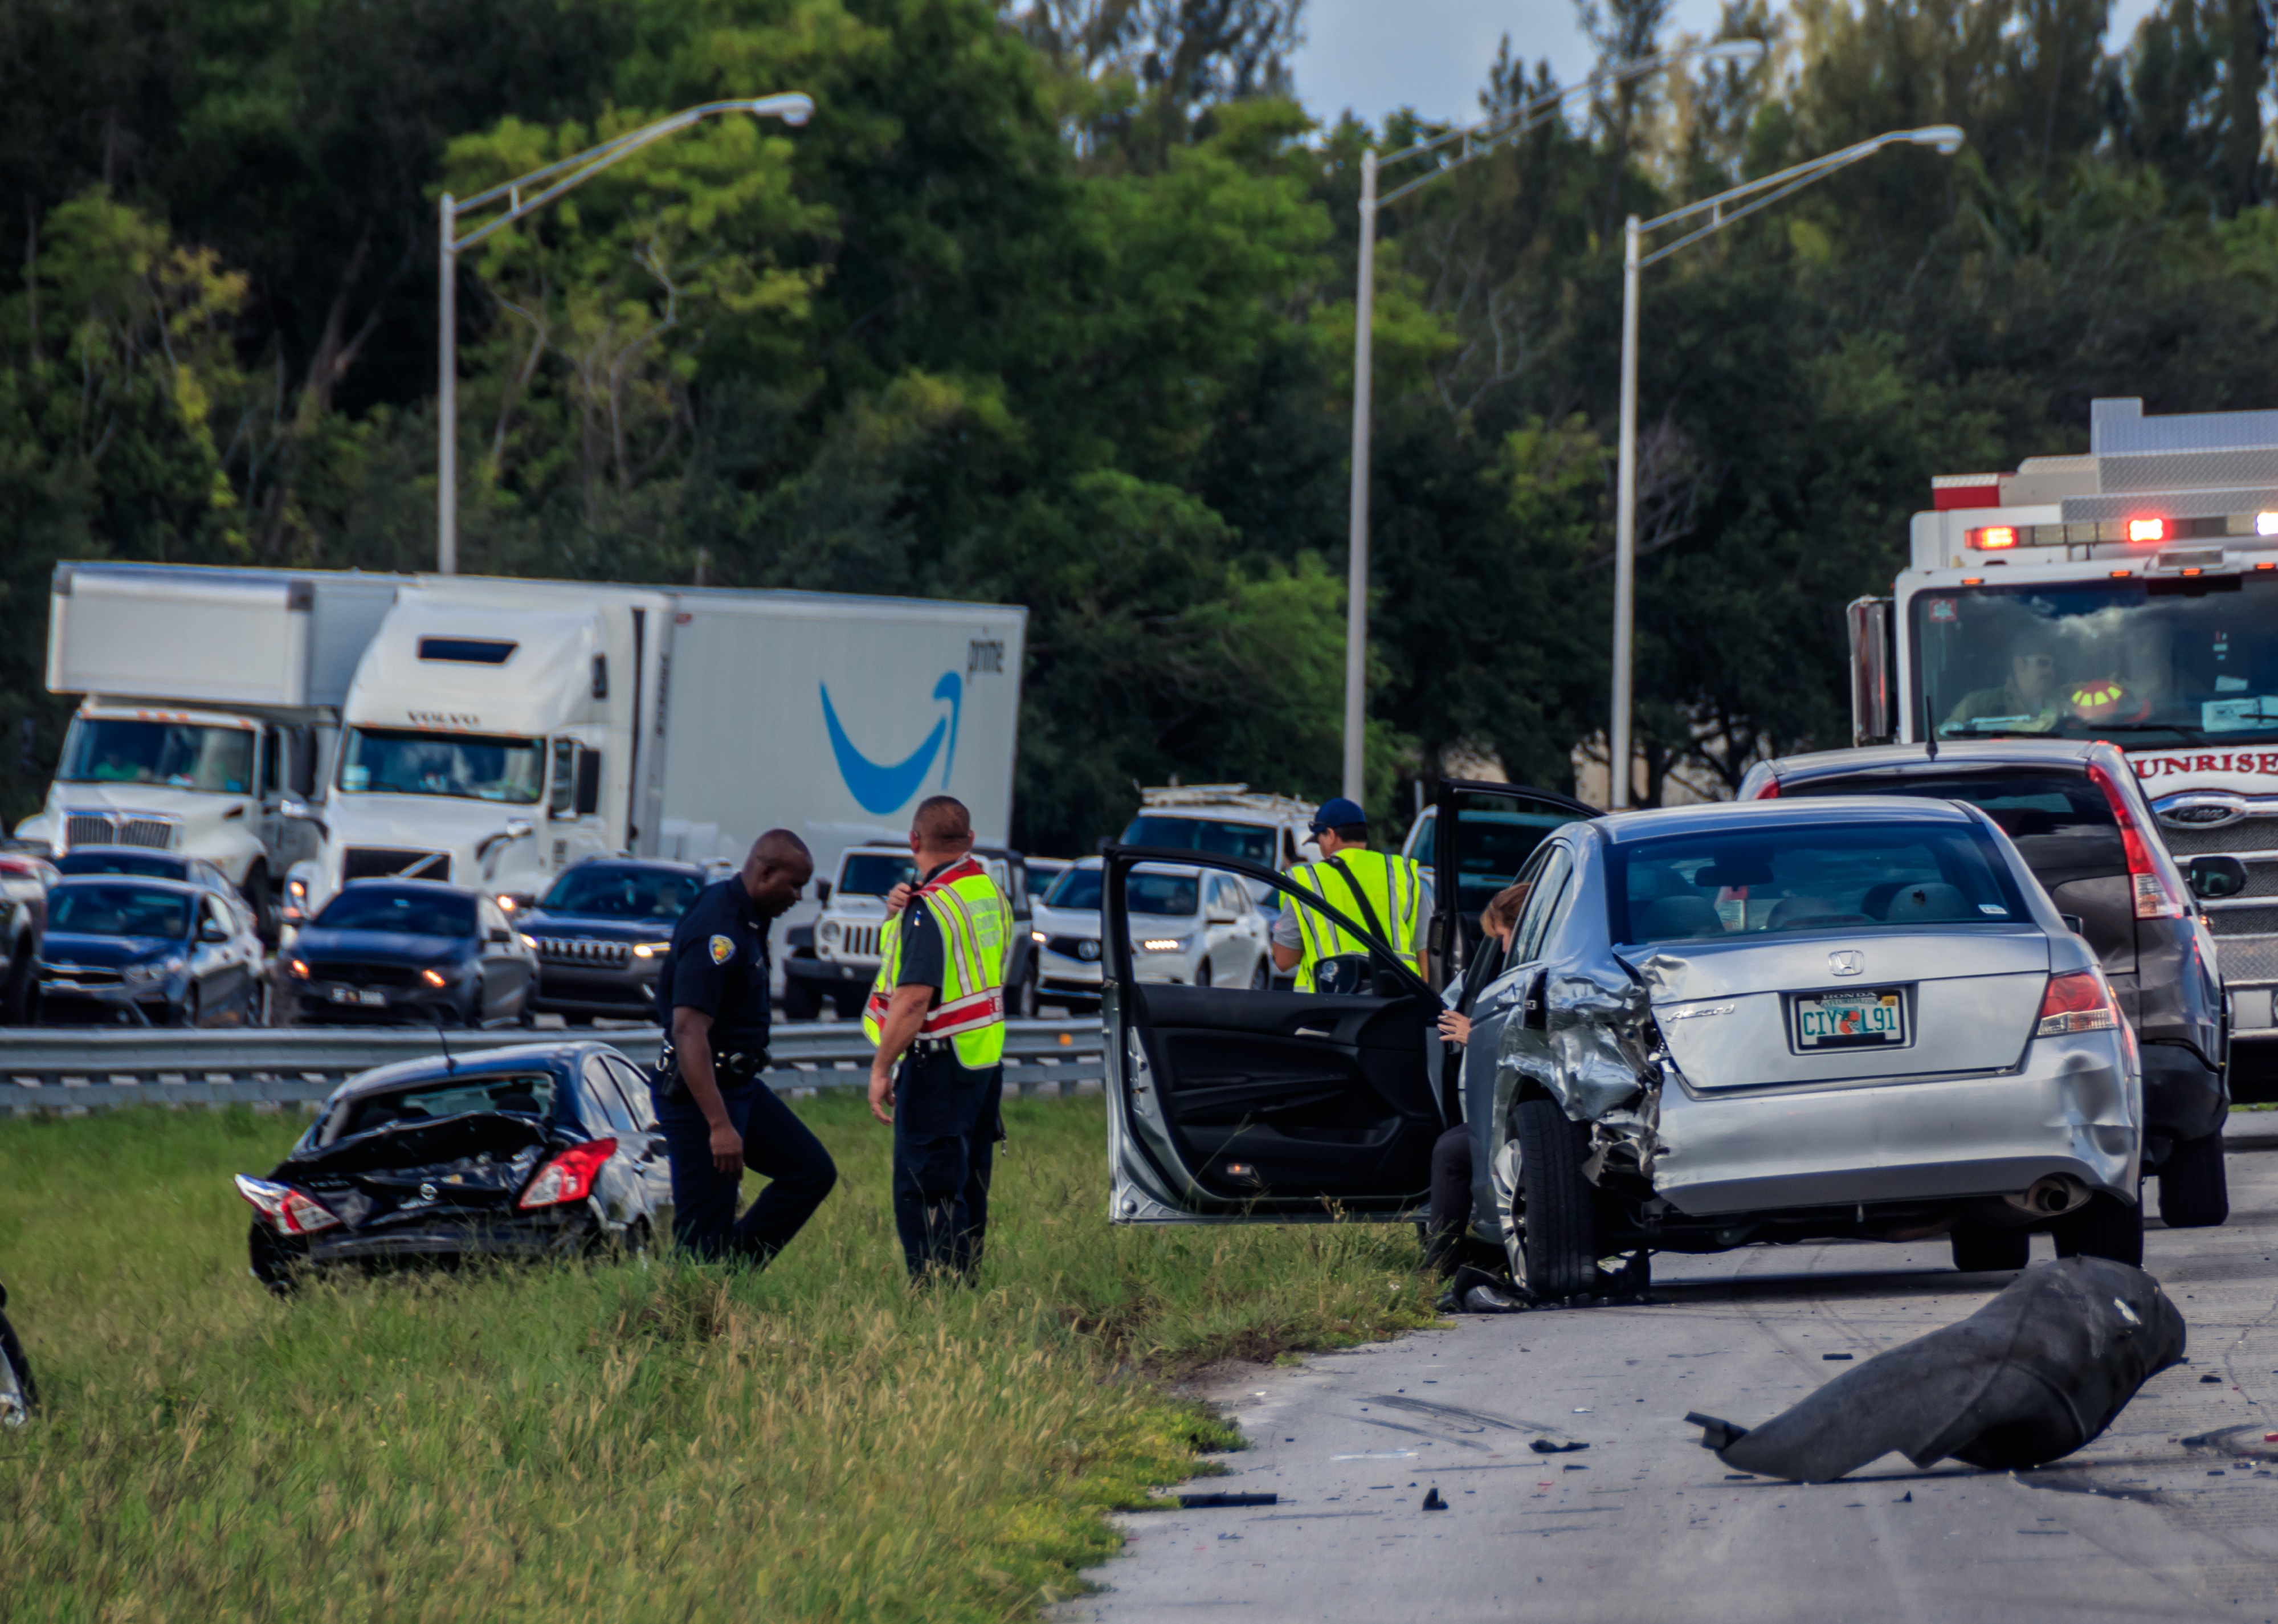
YES Market Media // Shutterstock
#16. Florida
Car accident scene along highway.
– Drunken driving fatalities per 100k residents: 4.7 (1,019, 27% of all car crash fatalities)
– Fatalities involving driver with BAC 0.15 and above: 3.2 per 100K (688, 67.5% of all drunken driving fatalities)
– Change in drunken driving fatalities from 2012: 43.7% increase
Real Window Creative // Shutterstock
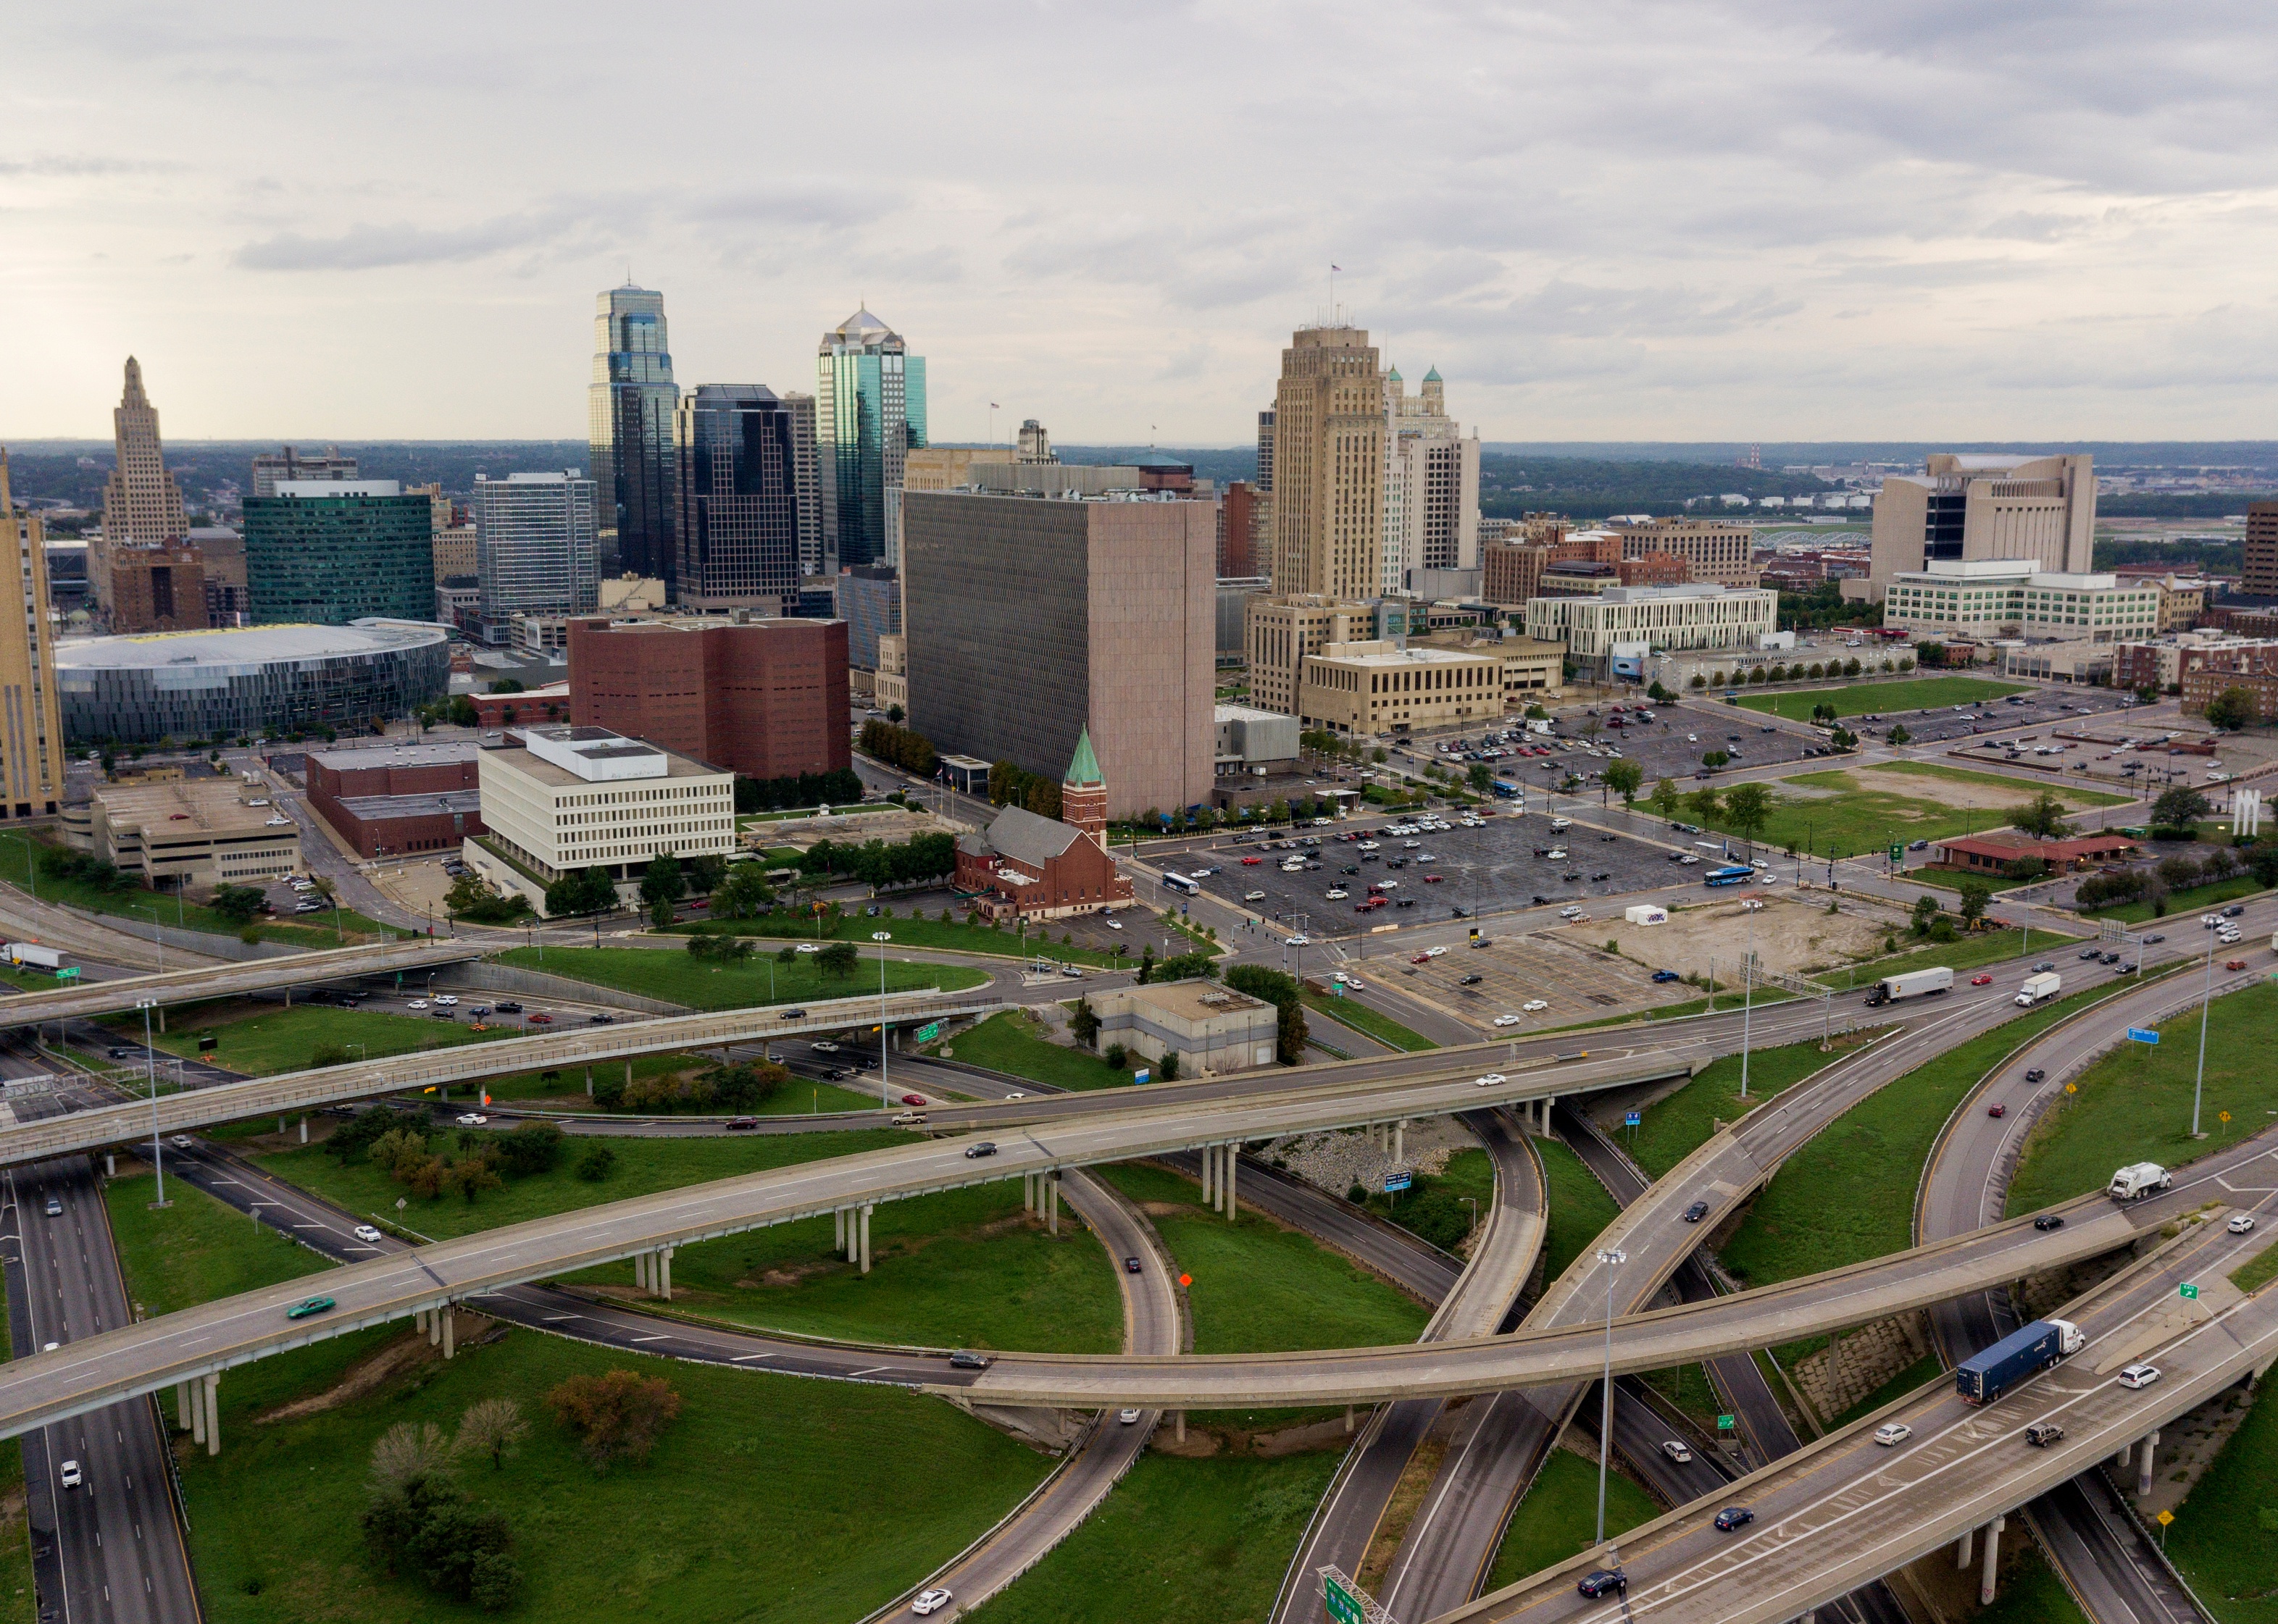
#15. Missouri
Cars and trucks on the highways outside of Kansas City.
– Drunken driving fatalities per 100k residents: 4.7 (290, 29% of all car crash fatalities)
– Fatalities involving driver with BAC 0.15 and above: 3.2 per 100K (196, 67.6% of all drunken driving fatalities)
– Change in drunken driving fatalities from 2012: 2.5% increase
Gerson Repreza // Shutterstock
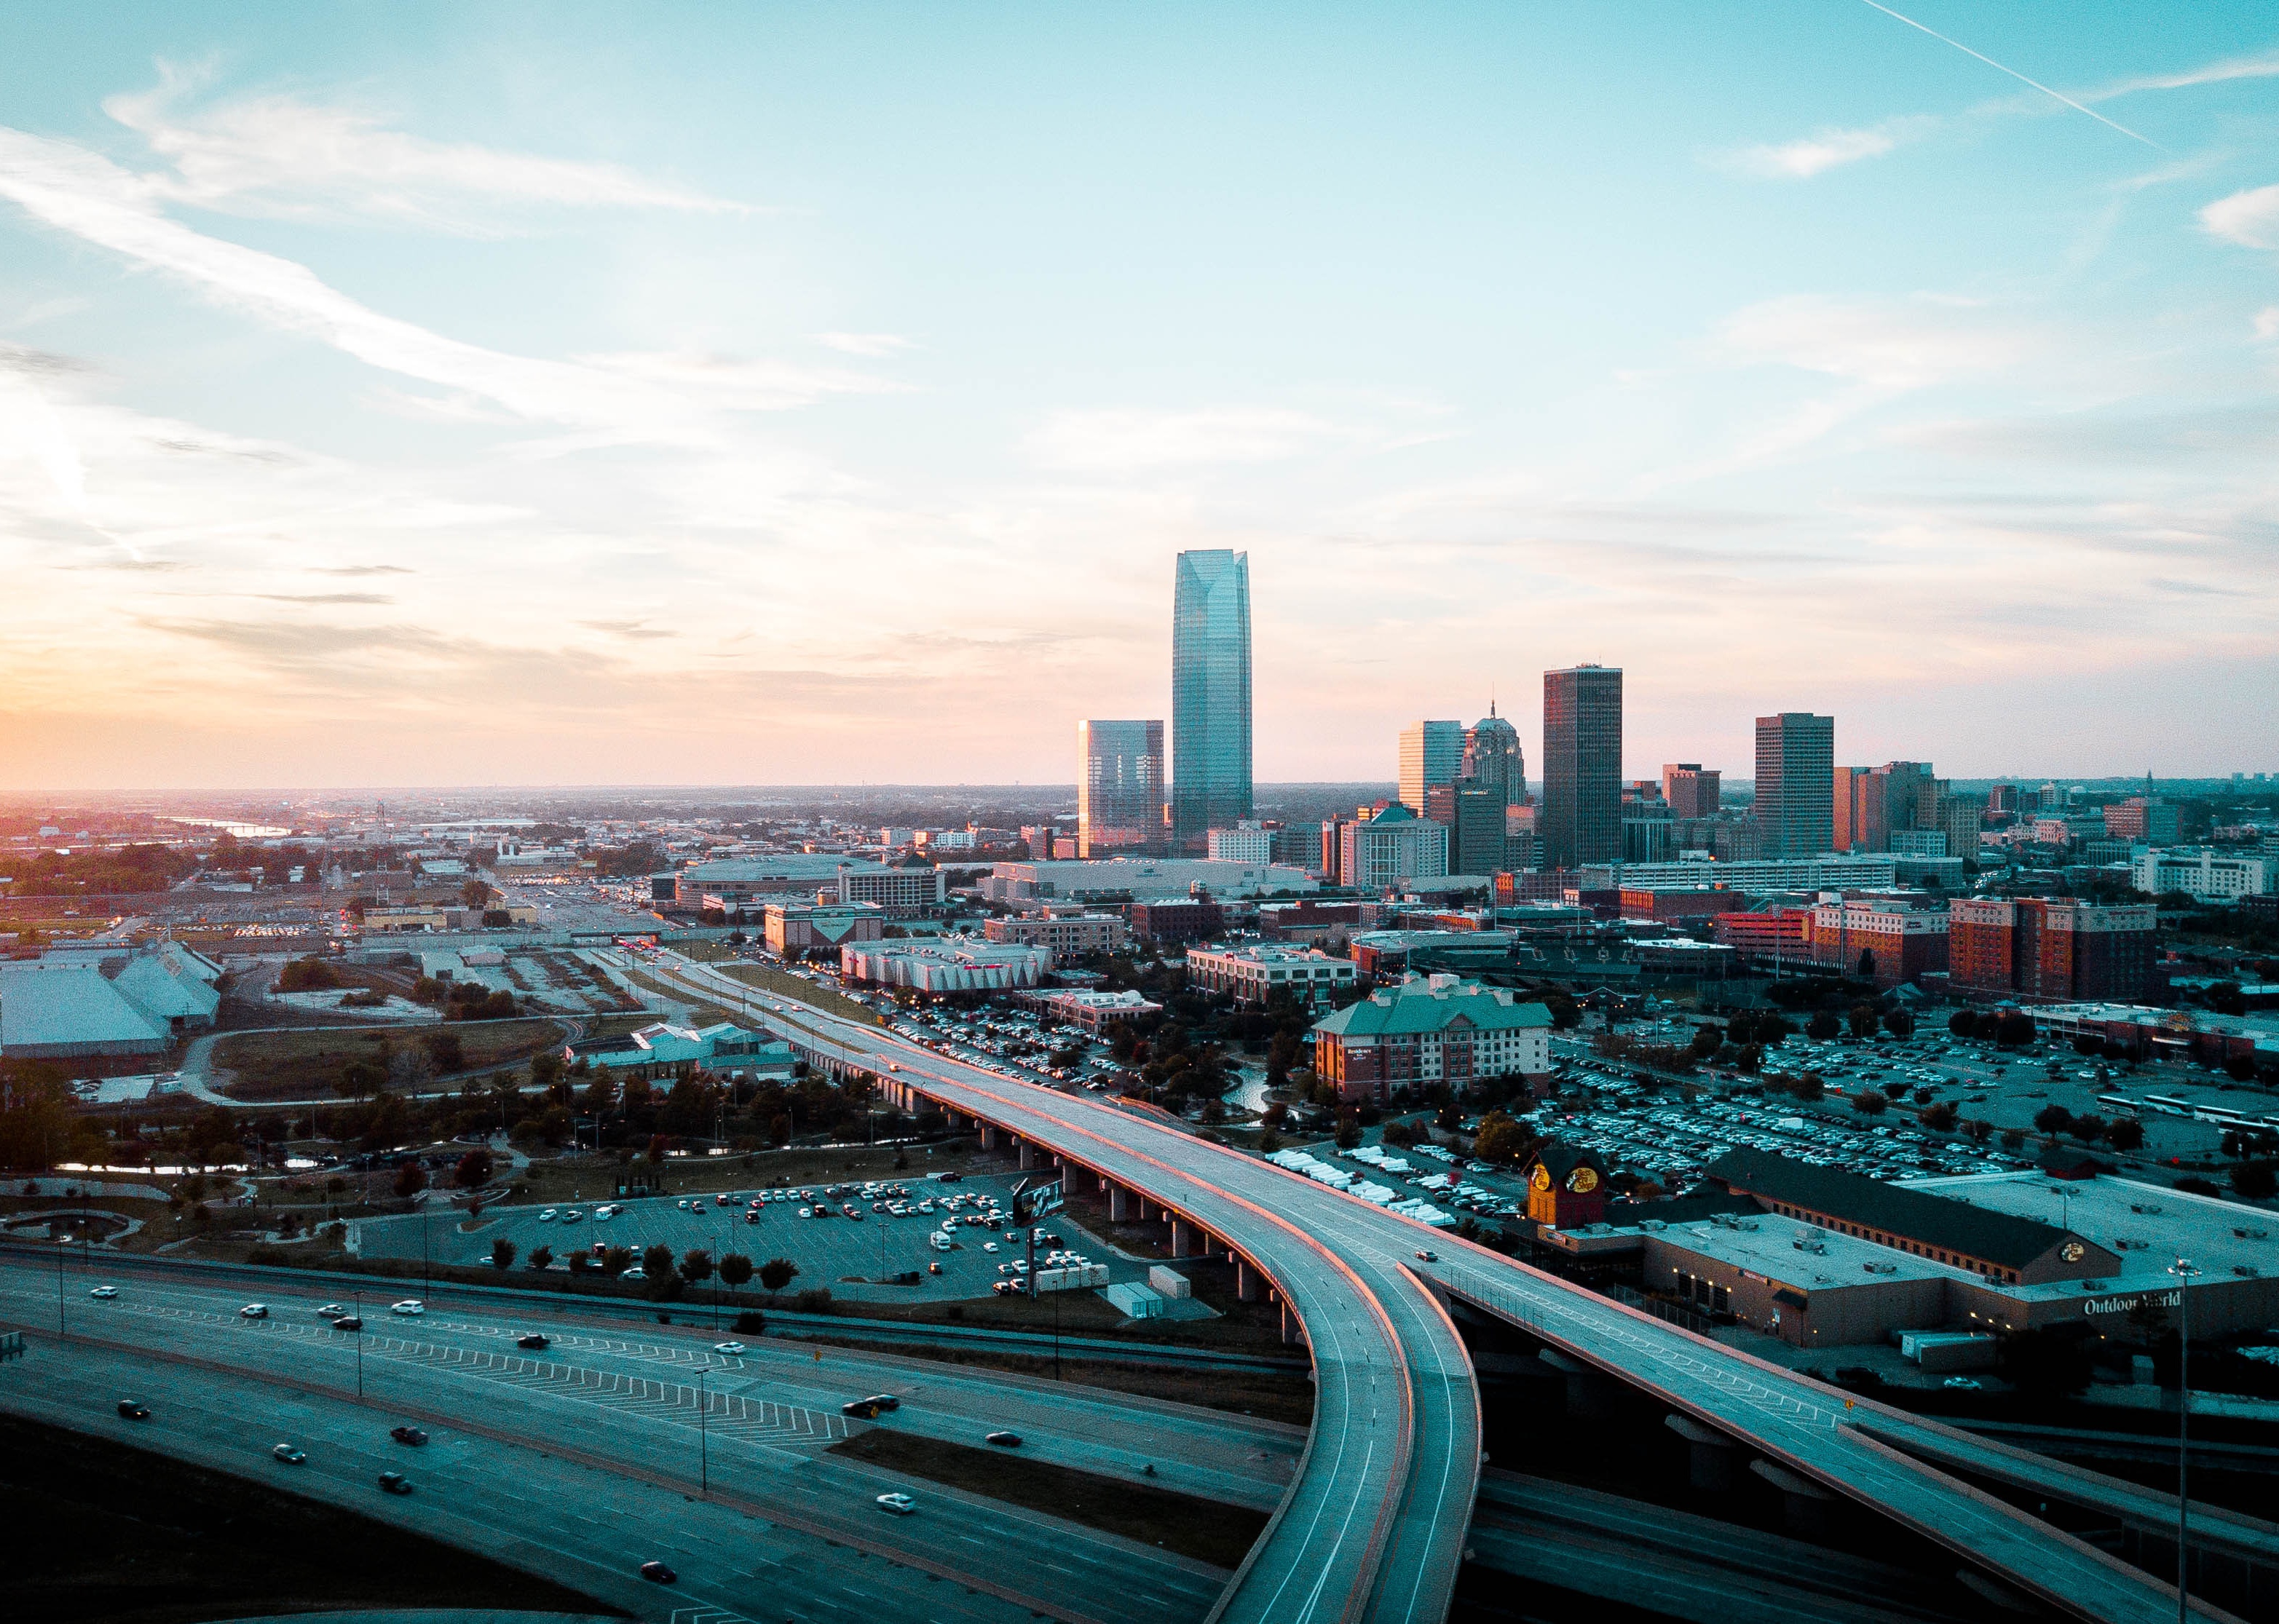
#14. Oklahoma
Downtown Oklahoma City skyline and highway.
– Drunken driving fatalities per 100k residents: 4.8 (192, 25% of all car crash fatalities)
– Fatalities involving driver with BAC 0.15 and above: 3.5 per 100K (139, 72.4% of all drunken driving fatalities)
– Change in drunken driving fatalities from 2012: 8.1% decrease
TFoxFoto // Shutterstock
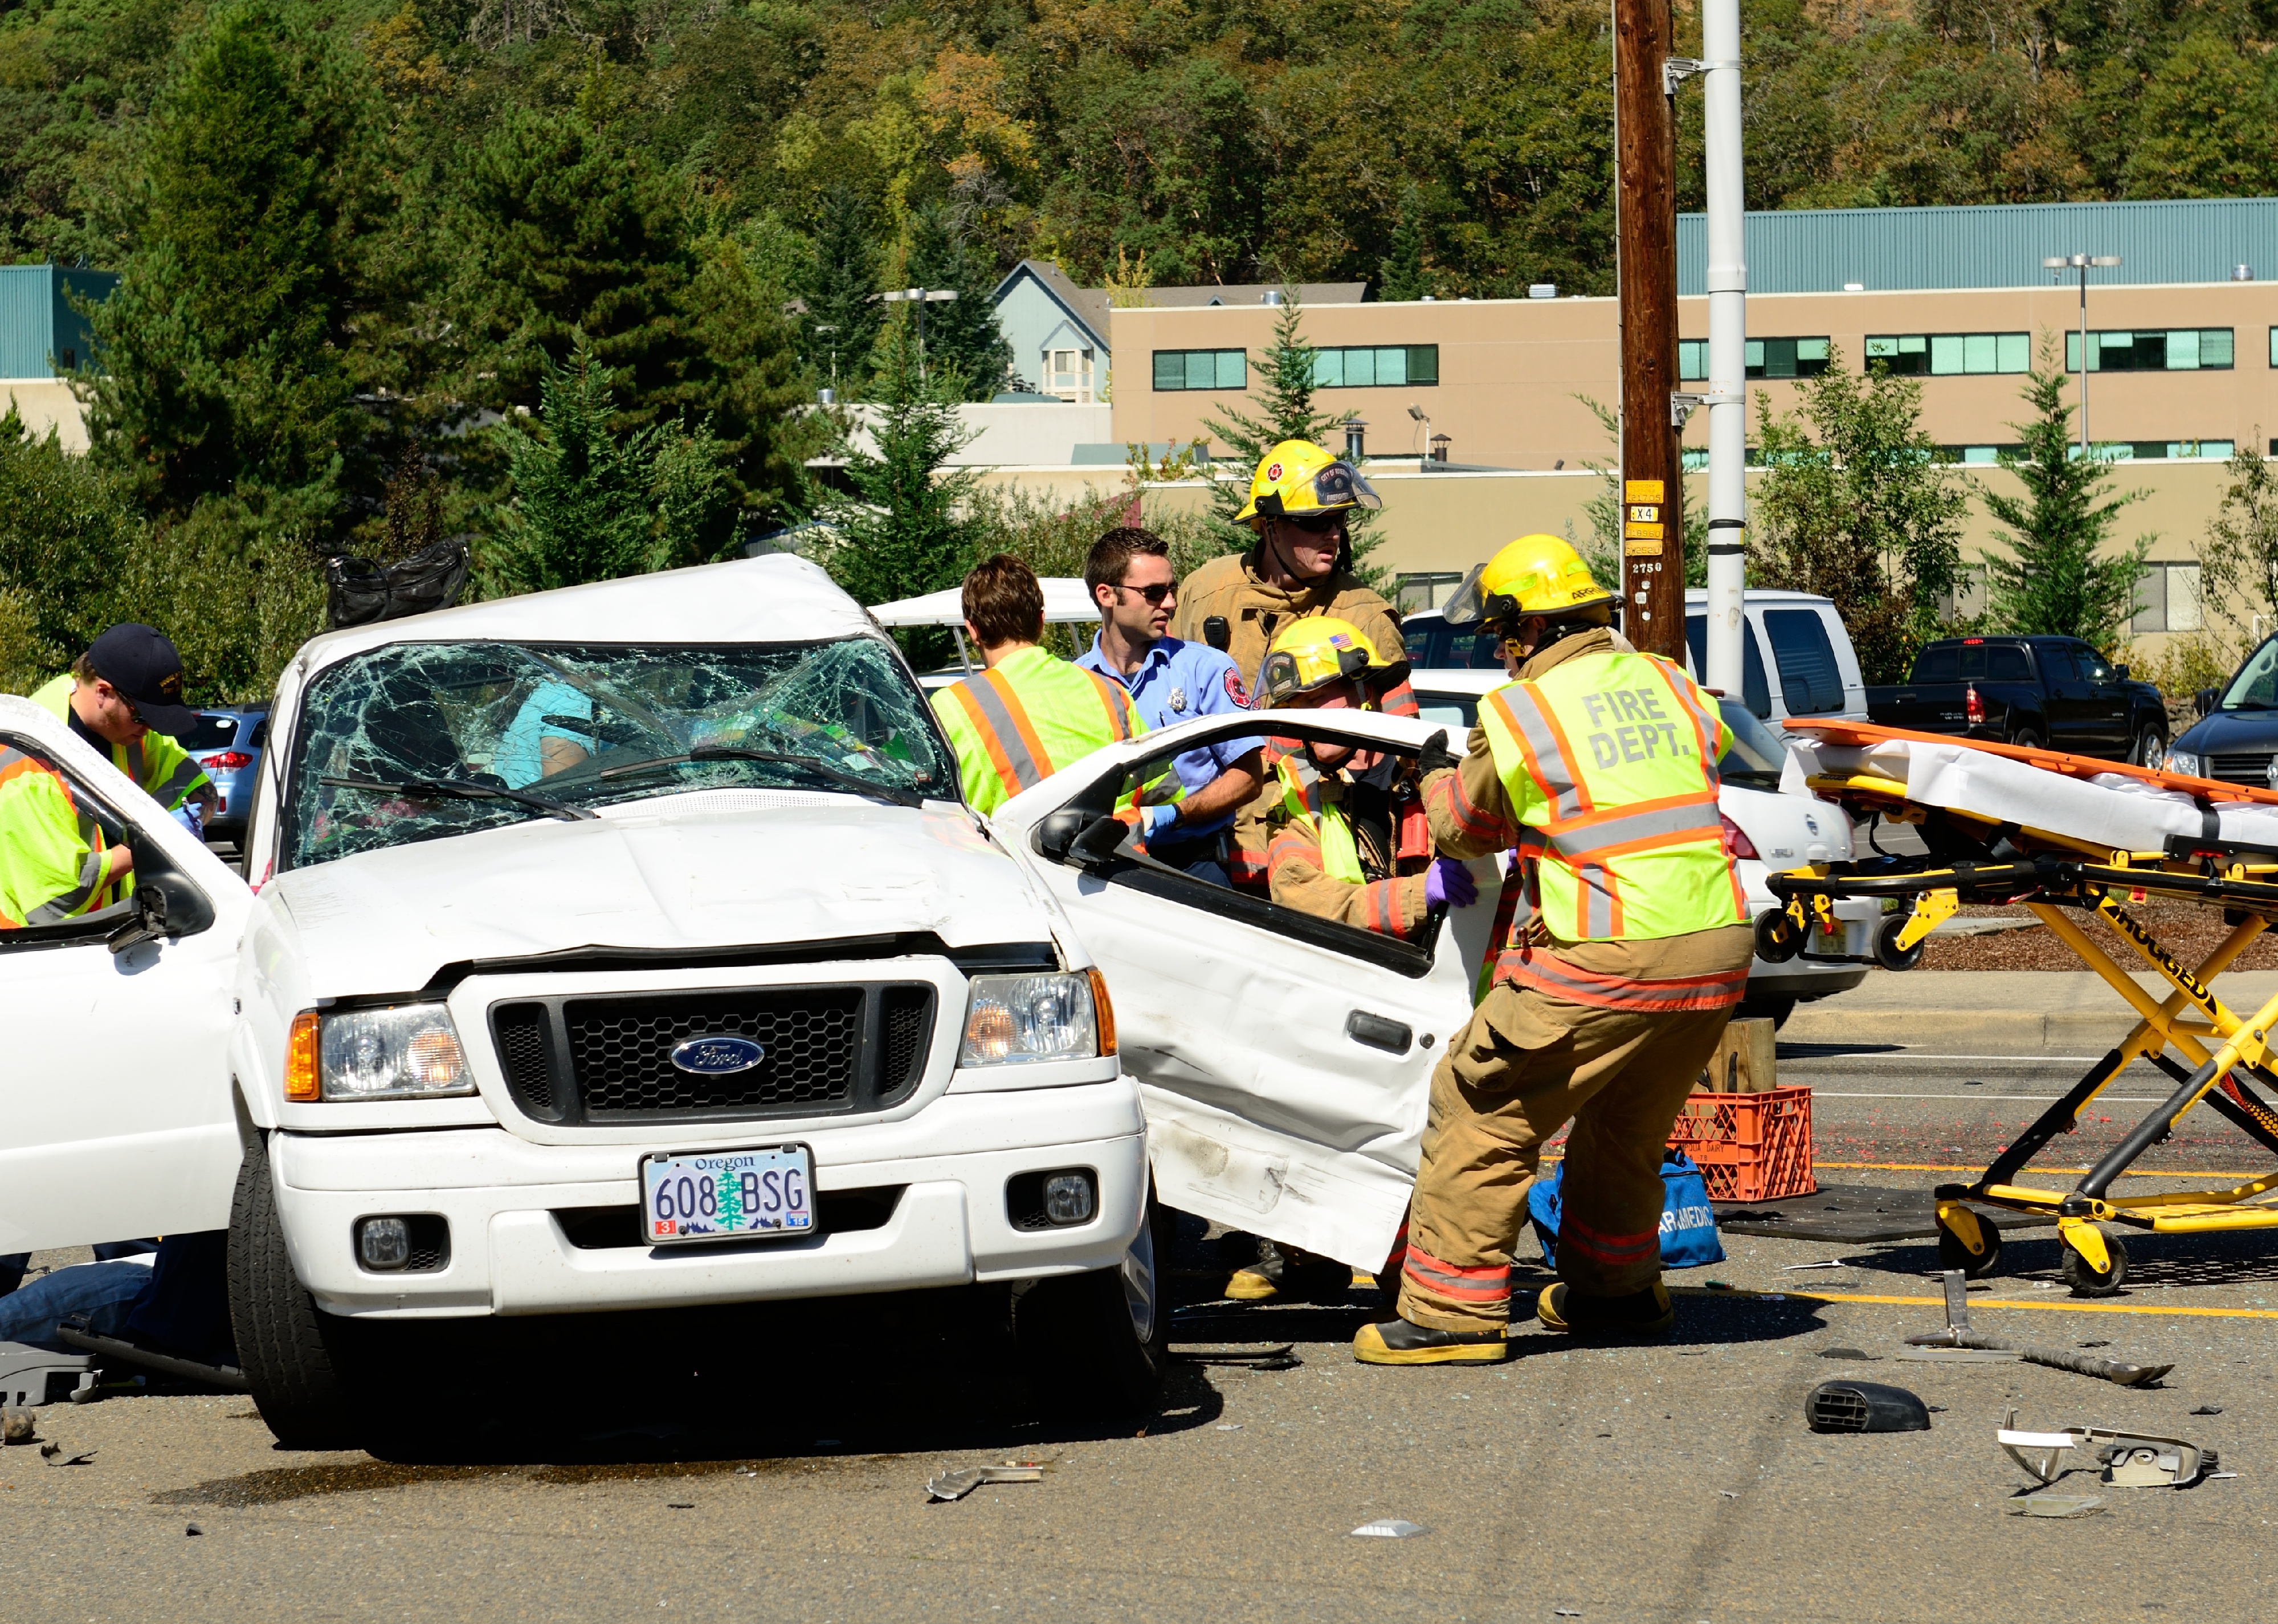
#13. Oregon
Firefighters extricate victims of a two vehicle t-bone accident.
– Drunken driving fatalities per 100k residents: 5.1 (215, 36% of all car crash fatalities)
– Fatalities involving driver with BAC 0.15 and above: 3.3 per 100K (142, 66% of all drunken driving fatalities)
– Change in drunken driving fatalities from 2012: 144.3% increase
Canva
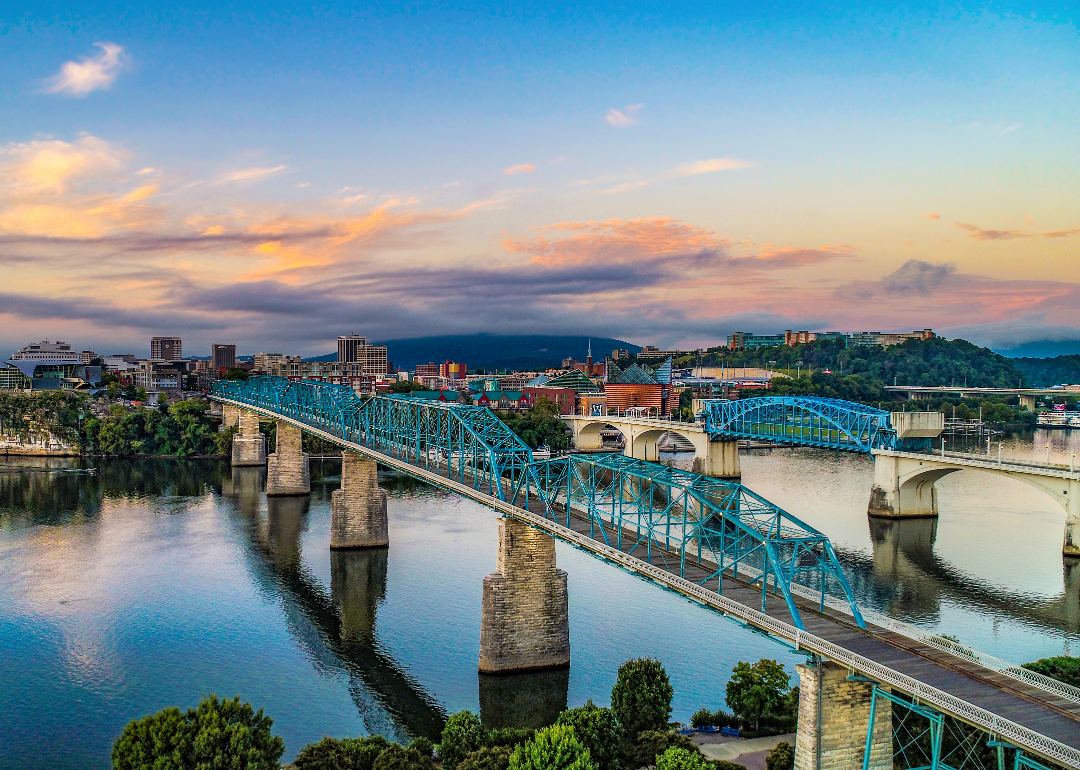
#12. Tennessee
Aerial view of Downtown Chattanooga and a bridge over the Tennessee River.
– Drunken driving fatalities per 100k residents: 5.1 (355, 27% of all car crash fatalities)
– Fatalities involving driver with BAC 0.15 and above: 3.5 per 100K (247, 69.6% of all drunken driving fatalities)
– Change in drunken driving fatalities from 2012: 24.1% increase

TLF Images // Shutterstock
#11. Mississippi
Two motorcycles passing by the Mississippi State welcome sign.
– Drunken driving fatalities per 100k residents: 5.3 (155, 20% of all car crash fatalities)
– Fatalities involving driver with BAC 0.15 and above: 3.5 per 100K (102, 65.8% of all drunken driving fatalities)
– Change in drunken driving fatalities from 2012: 18.8% decrease
Sean Pavone // Shutterstock
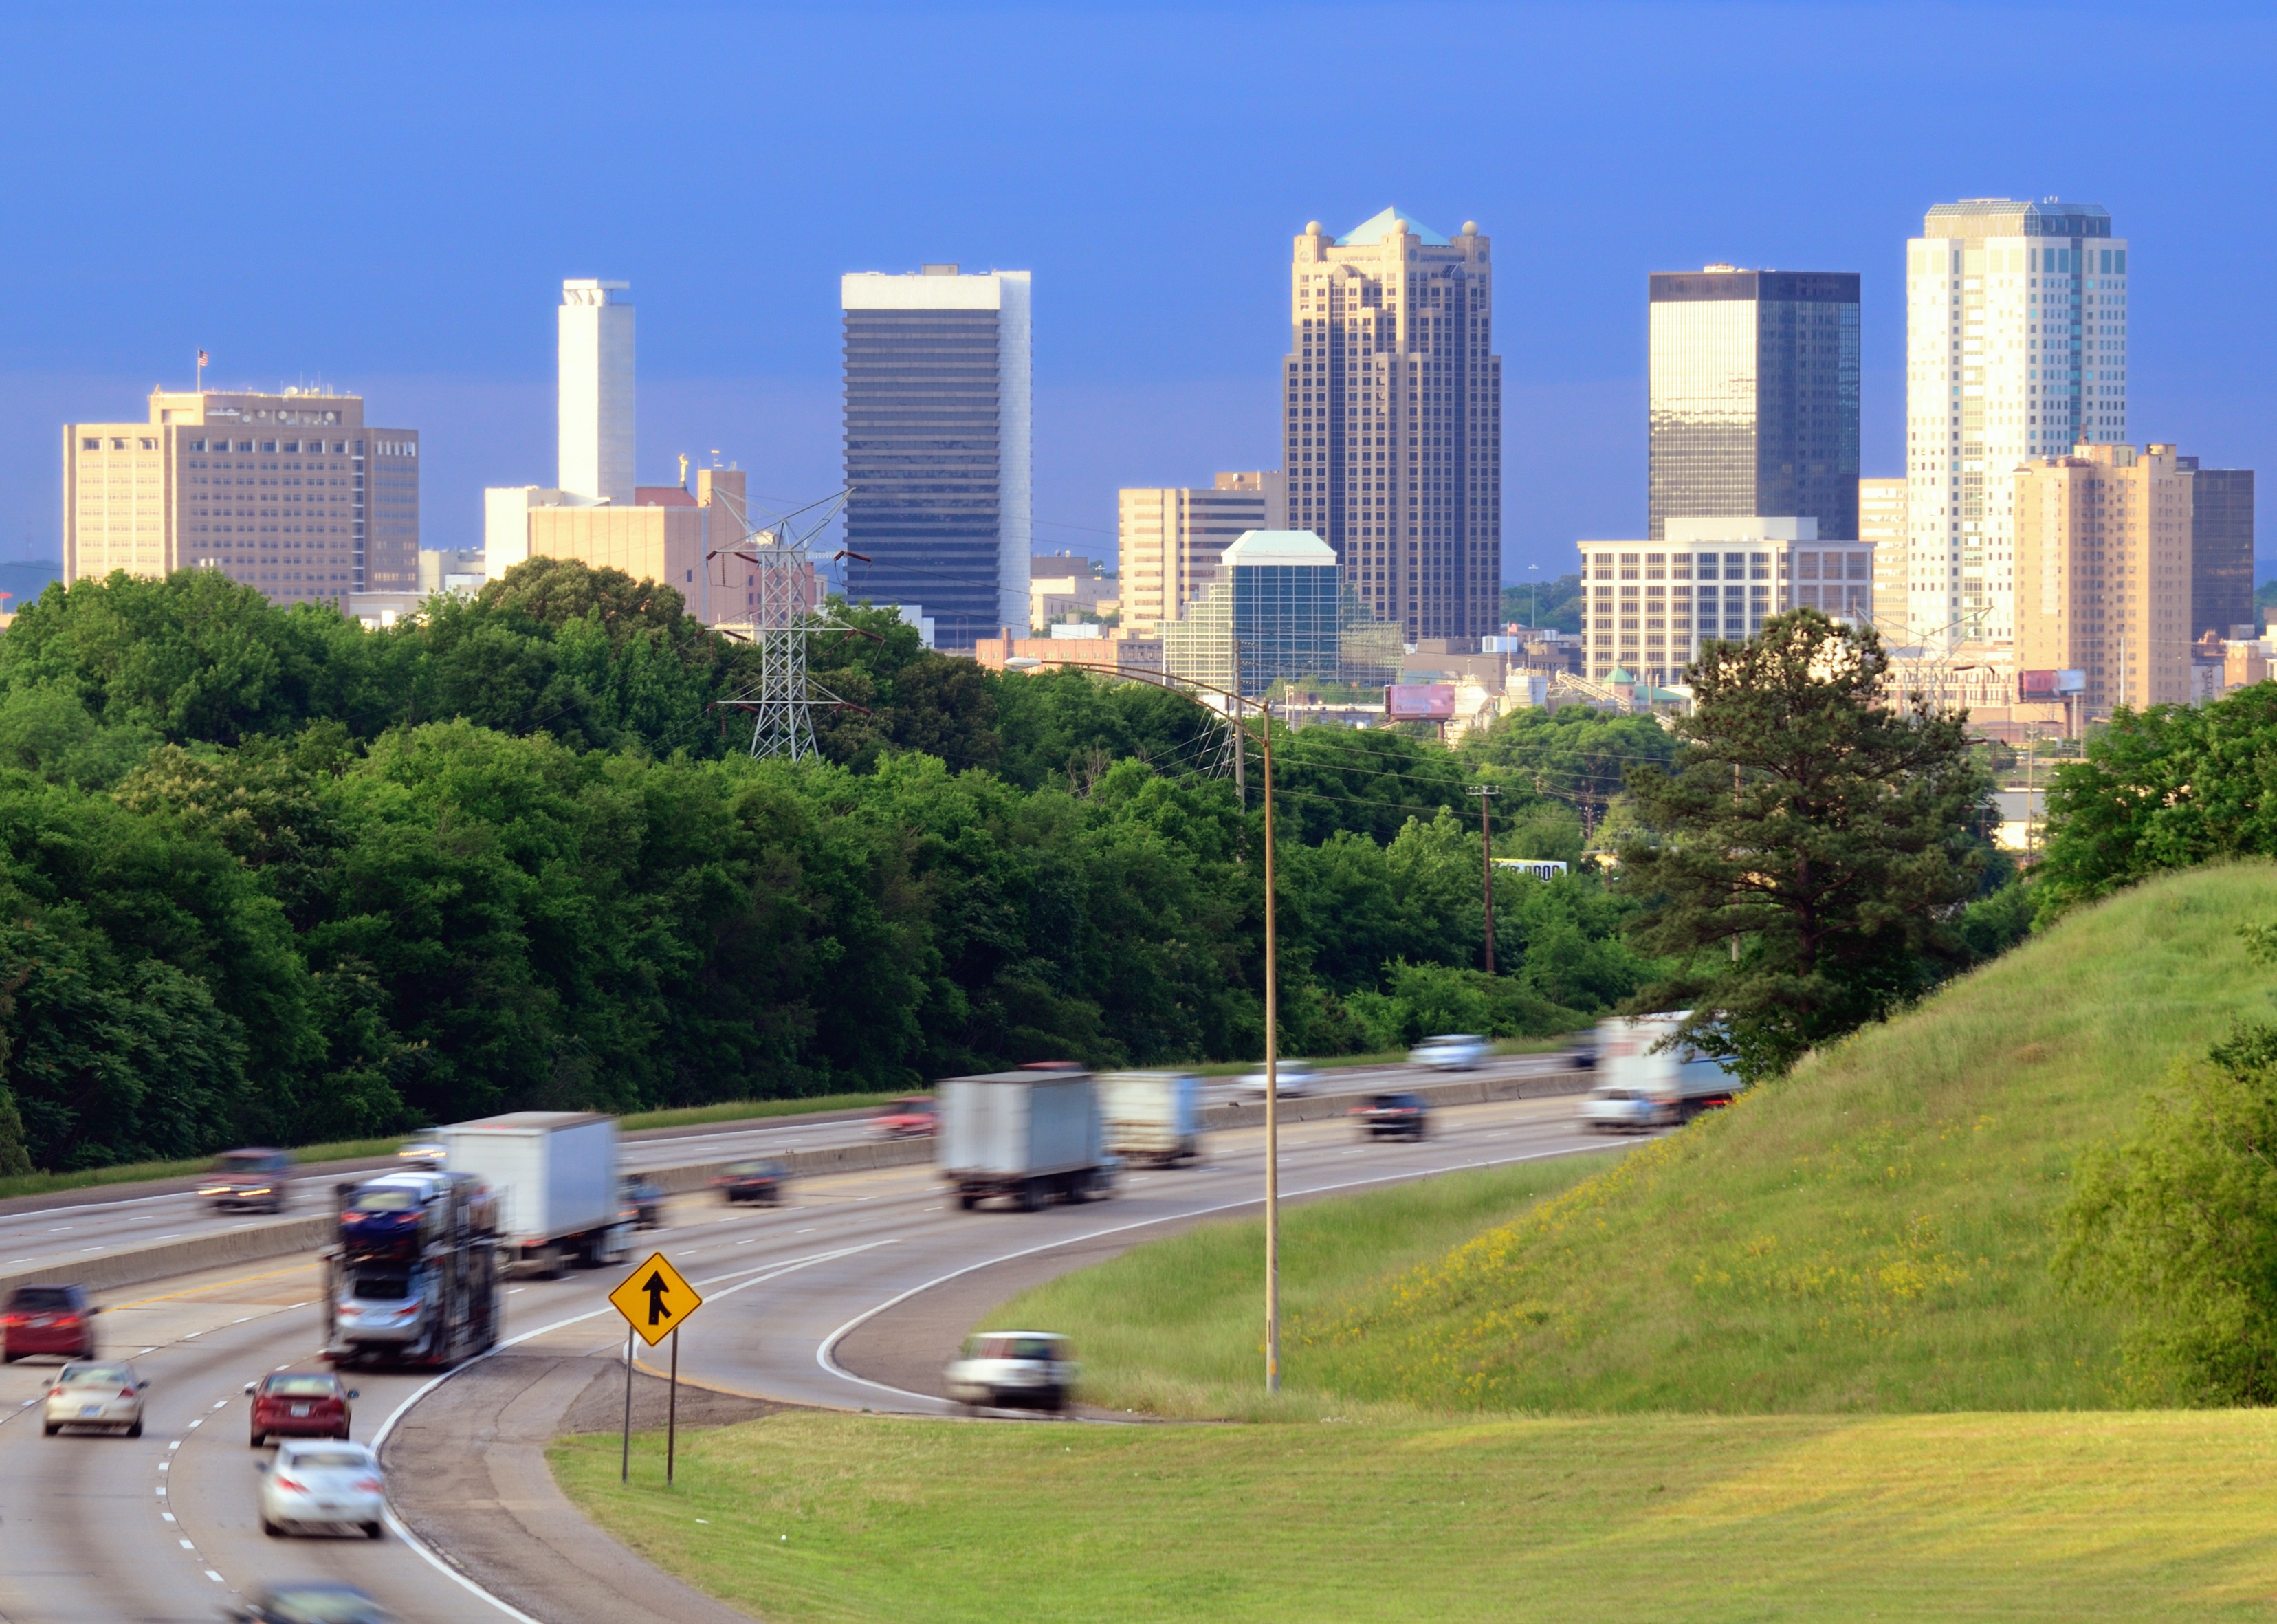
#10. Alabama
Skyline of Birmingham from above Interstate 65.
– Drunken driving fatalities per 100k residents: 5.6 (281, 29% of all car crash fatalities)
– Fatalities involving driver with BAC 0.15 and above: 3.5 per 100K (177, 63% of all drunken driving fatalities)
– Change in drunken driving fatalities from 2012: 17.1% increase
Johnny Coate // Shutterstock
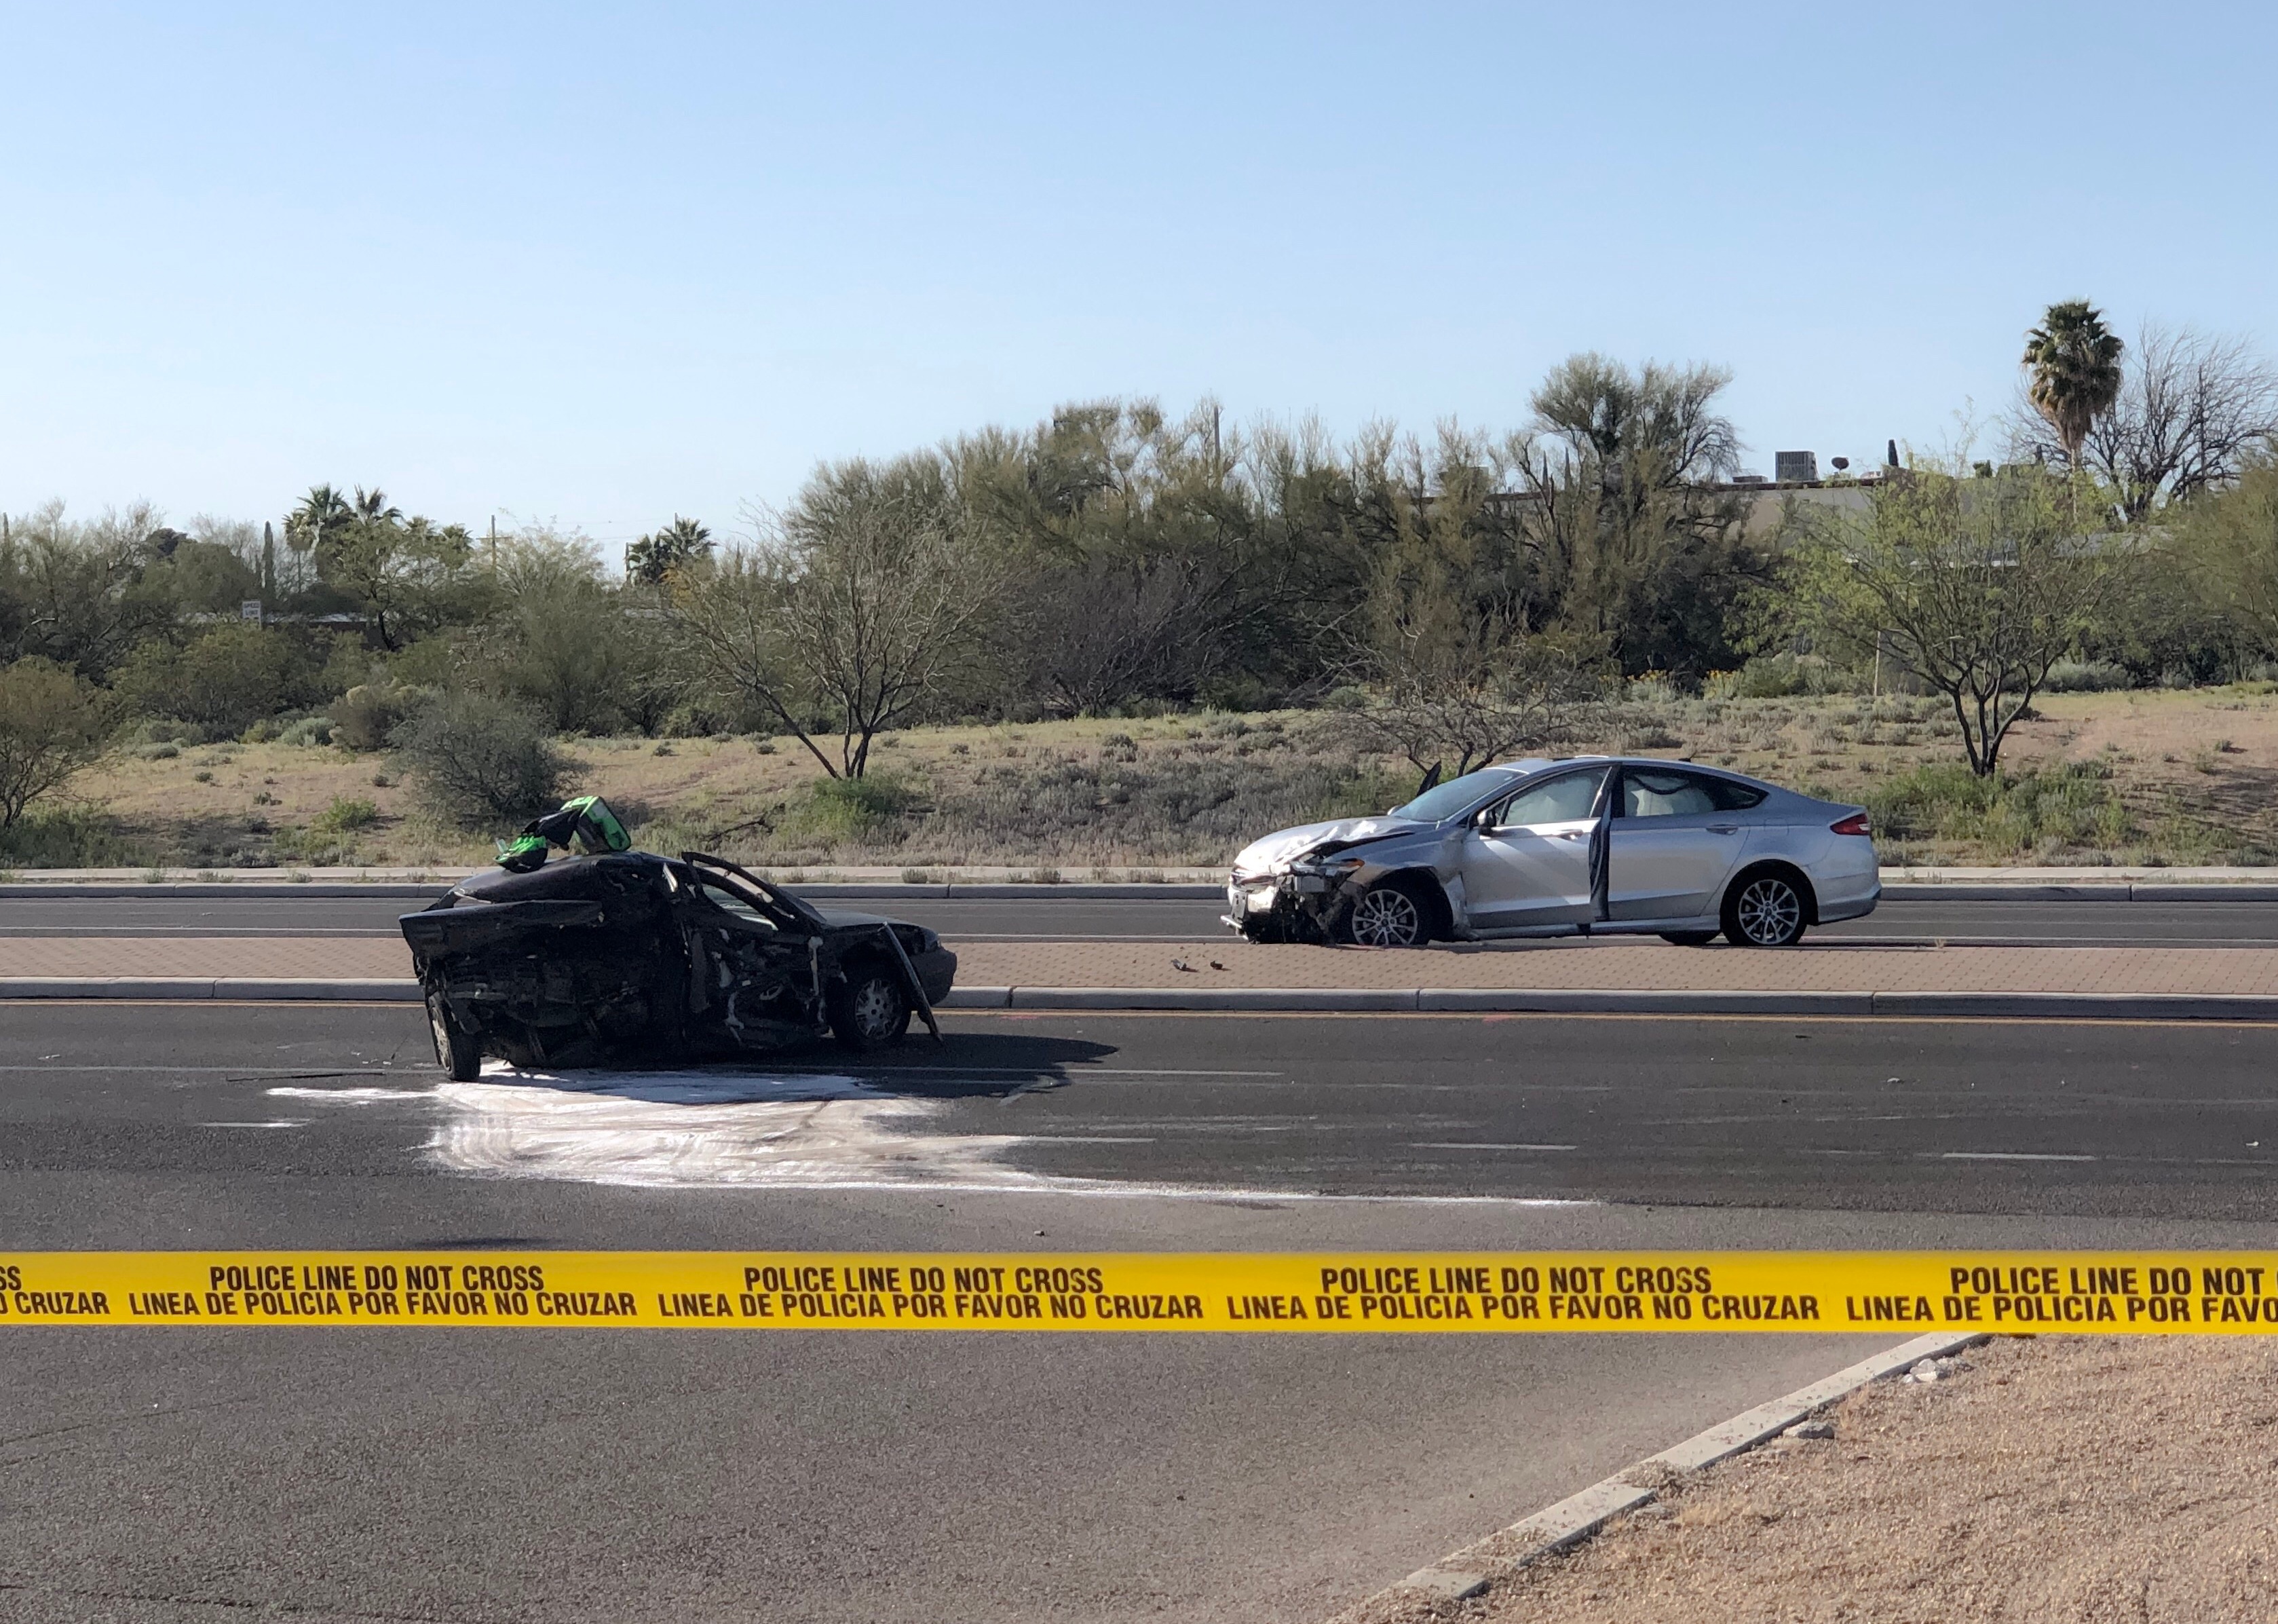
#9. Arizona
A severe car crash with a yellow police tape saying, do not cross, in English and Spanish.
– Drunken driving fatalities per 100k residents: 5.8 (421, 36% of all car crash fatalities)
– Fatalities involving driver with BAC 0.15 and above: 3.8 per 100K (275, 65.3% of all drunken driving fatalities)
– Change in drunken driving fatalities from 2012: 83% increase

Jacob Boomsma // Shutterstock
#8. South Dakota
Aerial view of Sioux Falls at sunset.
– Drunken driving fatalities per 100k residents: 5.8 (52, 35% of all car crash fatalities)
– Fatalities involving driver with BAC 0.15 and above: 4.8 per 100K (43, 82.7% of all drunken driving fatalities)
– Change in drunken driving fatalities from 2012: 18.2% increase

Kristi Blokhin // Shutterstock
#7. Arkansas
Capital city in Arkansas with exit sign and cars in traffic.
– Drunken driving fatalities per 100k residents: 6.1 (185, 27% of all car crash fatalities)
– Fatalities involving driver with BAC 0.15 and above: 3.8 per 100K (116, 62.7% of all drunken driving fatalities)
– Change in drunken driving fatalities from 2012: 28.5% increase

Moab Republic // Shutterstock
#6. Texas
Major traffic accident with multiple cars involved at night.
– Drunken driving fatalities per 100k residents: 6.4 (1,906, 42% of all car crash fatalities)
– Fatalities involving driver with BAC 0.15 and above: 4.4 per 100K (1,301, 68.3% of all drunken driving fatalities)
– Change in drunken driving fatalities from 2012: 47.8% increase

William A. Morgan // Shutterstock
#5. Louisiana
Car crashed into parked car on neighborhood street.
– Drunken driving fatalities per 100k residents: 6.5 (299, 31% of all car crash fatalities)
– Fatalities involving driver with BAC 0.15 and above: 4.4 per 100K (203, 67.9% of all drunken driving fatalities)
– Change in drunken driving fatalities from 2012: 27.2% increase

Jacob Boomsma // Shutterstock
#4. Wyoming
Aerial view of Cheyenne at dusk during winter.
– Drunken driving fatalities per 100k residents: 6.6 (38, 34% of all car crash fatalities)
– Fatalities involving driver with BAC 0.15 and above: 5.0 per 100K (29, 76.3% of all drunken driving fatalities)
– Change in drunken driving fatalities from 2012: 7.3% decrease

Dmitry Kalinovsky // Shutterstock
#3. New Mexico
Car crashed and damaged after accident on a road.
– Drunken driving fatalities per 100k residents: 7.3 (154, 32% of all car crash fatalities)
– Fatalities involving driver with BAC 0.15 and above: 5.2 per 100K (111, 72.1% of all drunken driving fatalities)
– Change in drunken driving fatalities from 2012: 58.8% increase
Chris Perello // Shutterstock
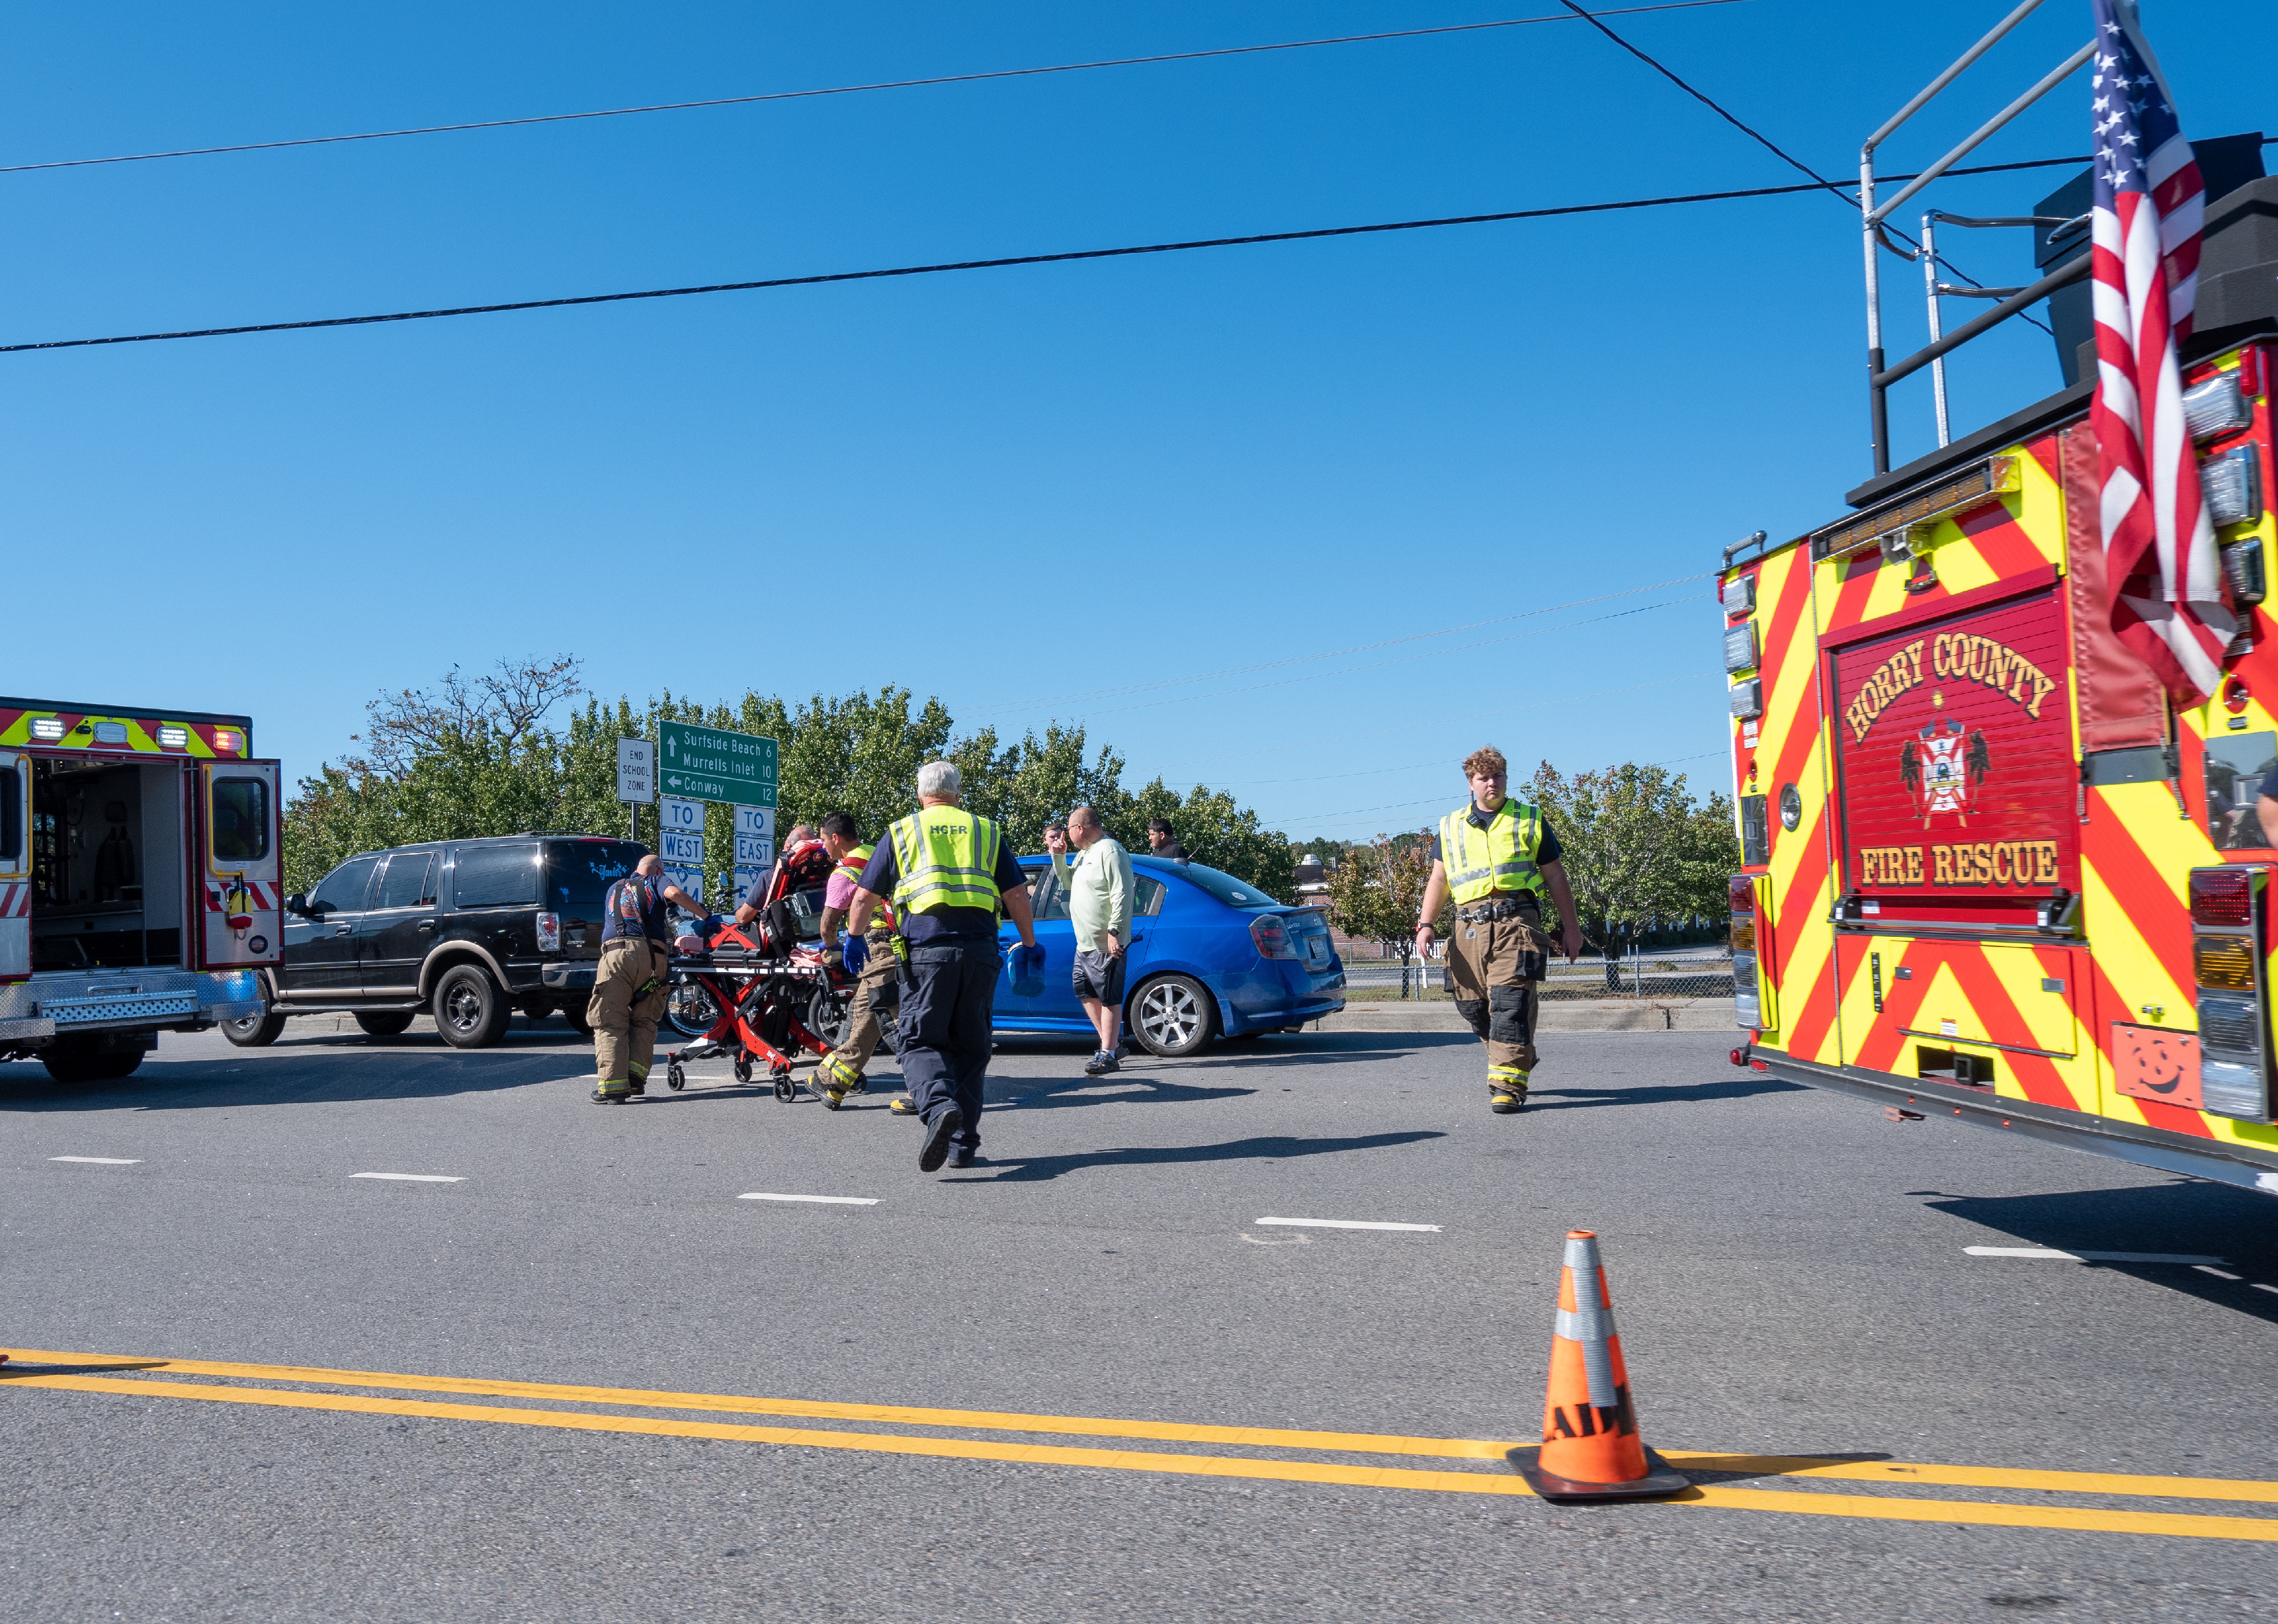
#2. South Carolina
First responders on the scene of a vehicle accident.
– Drunken driving fatalities per 100k residents: 7.7 (401, 33% of all car crash fatalities)
– Fatalities involving driver with BAC 0.15 and above: 5.4 per 100K (282, 70.3% of all drunken driving fatalities)
– Change in drunken driving fatalities from 2012: 15.2% increase
Dmitry Kalinovsky // Shutterstock
#1. Montana
Car crash accident scene on a city street.
– Drunken driving fatalities per 100k residents: 9.4 (104, 44% of all car crash fatalities)
– Fatalities involving driver with BAC 0.15 and above: 6.7 per 100K (74, 71.2% of all drunken driving fatalities)
– Change in drunken driving fatalities from 2012: 16.9% increase
Photo selection by Clarese Moller.
This story originally appeared on Monge and Associates and was produced and
distributed in partnership with Stacker Studio.