Which states' residents drive the most per capita?
Canva
Which states’ residents drive the most per capita?
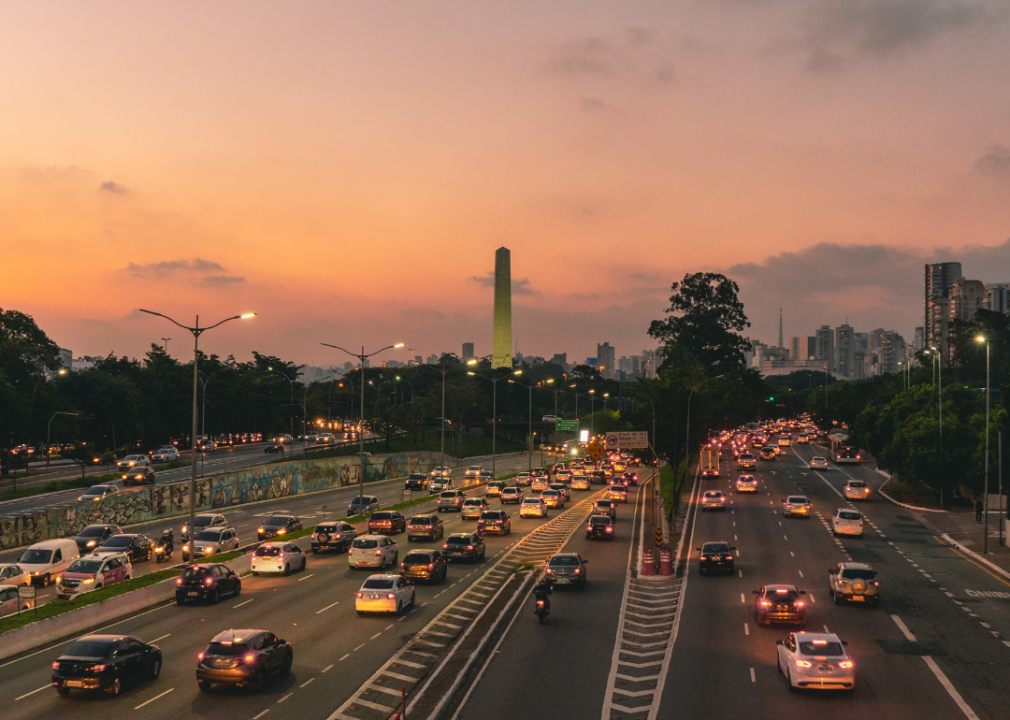
Busy highway traffic at dusk.
If a symbol of the American lifestyle exists, it might very well be the car. So perhaps it’s not surprising that, according to the Federal Highway Administration, the average American drives an average of 14,000 miles per year or just under 1,200 miles a month. That’s enough for a round-trip drive from Miami to Seattle twice—with a few hundred miles left over.
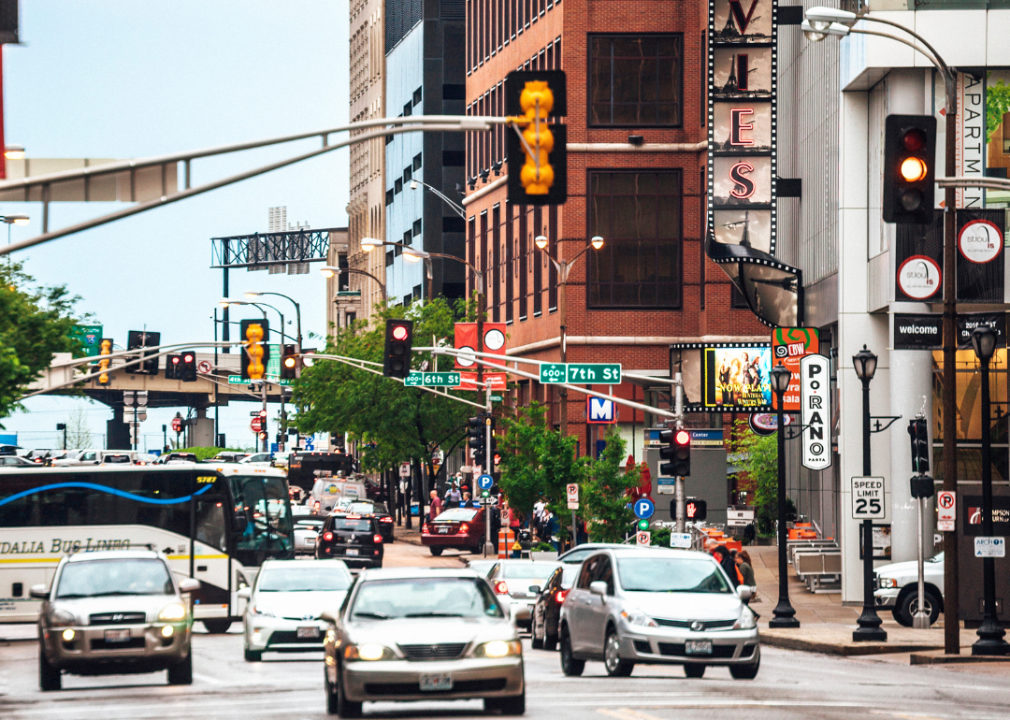
Another way to measure driving is with vehicle miles traveled per capita, the sum of annual miles traveled by vehicles divided by the state’s total population. Collectively, Americans drive roughly 3.2 trillion miles every year—which measures out to 9,780 miles per capita.
But people in different states drive different amounts. Population density and the cost of gas are among the factors influencing driving habits. CheapInsurance.com used data from the Federal Highway Administration and the Census Bureau to find out which state’s residents do the most driving. The data are ranked by the average number of vehicle-miles driven in each state, by capita. Driving data are from September 20211 through August 2023, and population data are from 2022.
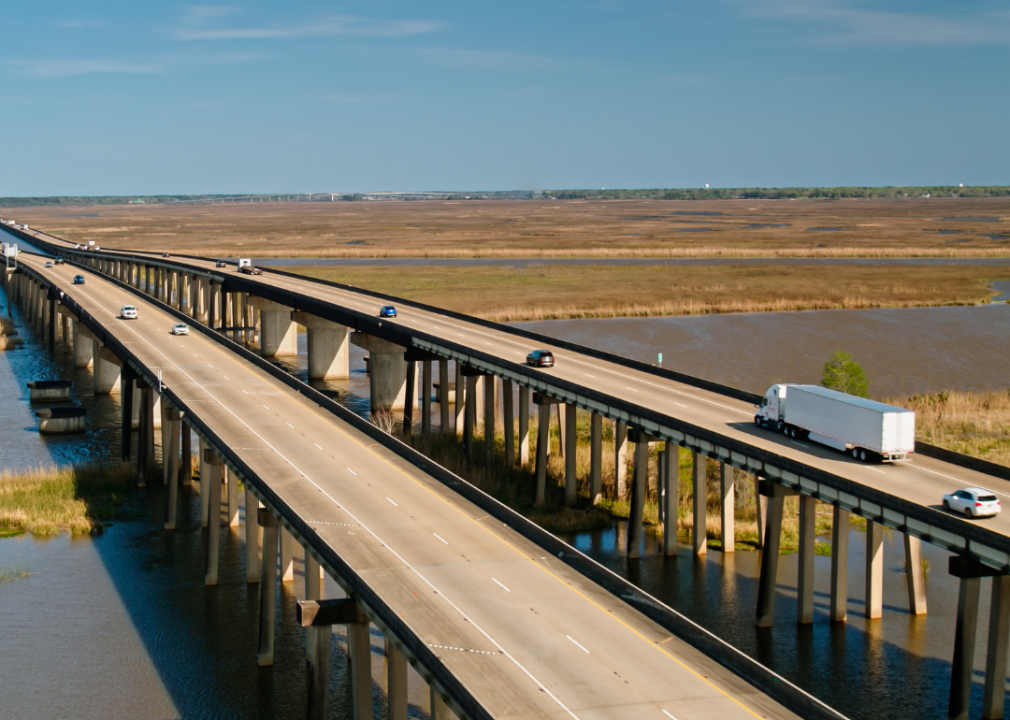
Southern and Western states lead the rankings of where drivers spend more time behind the wheel. The top five states are more rural and have lower population densities than others, meaning they may have longer distances to travel for work or regular errands. It’s also likely they have less access to public transportation.
At the other end of the list, the five states with the lowest miles driven per capita are in the Northeast and along the Pacific coast. Some of them are home to cities with the best public transportation systems in the country.
![]()
Drew Angerer // Getty Images
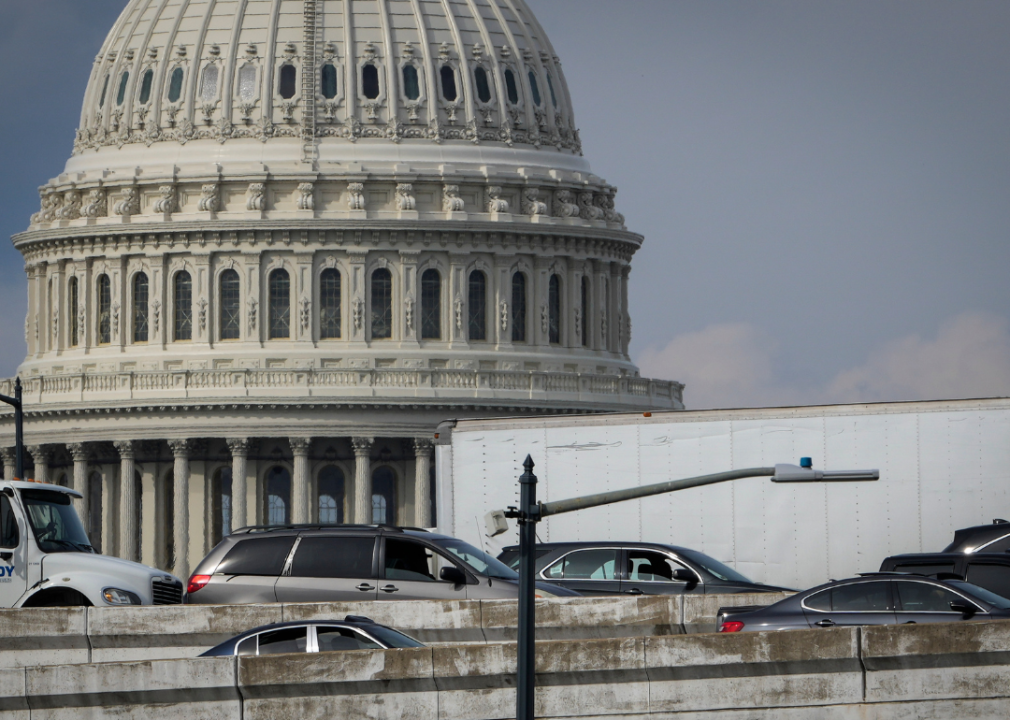
#51. Washington DC
Traffic moving slowly on the highway with the background of the Capitol Hill in D.C.
Annual vehicle-miles driven: 3.25 billion
—Per capita: 4,843.7

Canva
#50. New York
Busy traffic in New York City.
Annual vehicle-miles driven: 112.65 billion
—Per capita: 5,724.9
Canva
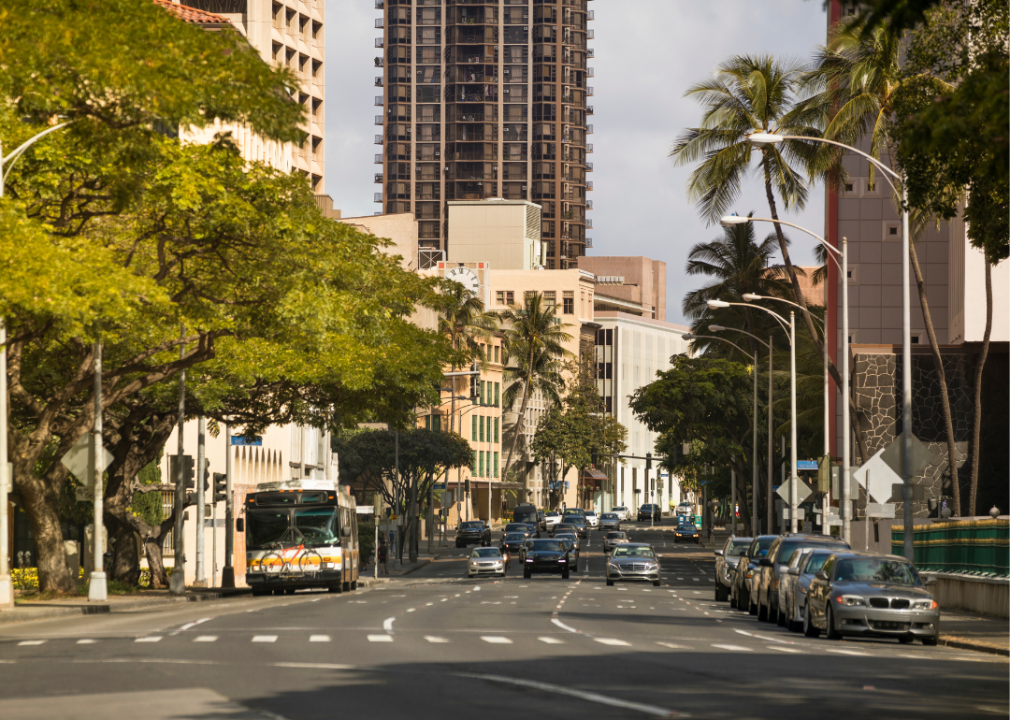
#49. Hawaii
Downtown Honolulu traffic.
Annual vehicle-miles driven: 10.48 billion
—Per capita: 7,278.2

Canva
#48. Rhode Island
City skyline.
Annual vehicle-miles driven: 8.10 billion
—Per capita: 7,407.7

Canva
#47. Washington
An aerial view of a highway intersection in Seattle.
Annual vehicle-miles driven: 59.18 billion
—Per capita: 7,600.6

Canva
#46. Alaska
Main street in a small town in Alaska.
Annual vehicle-miles driven: 5.80 billion
—Per capita: 7,902.3
Canva
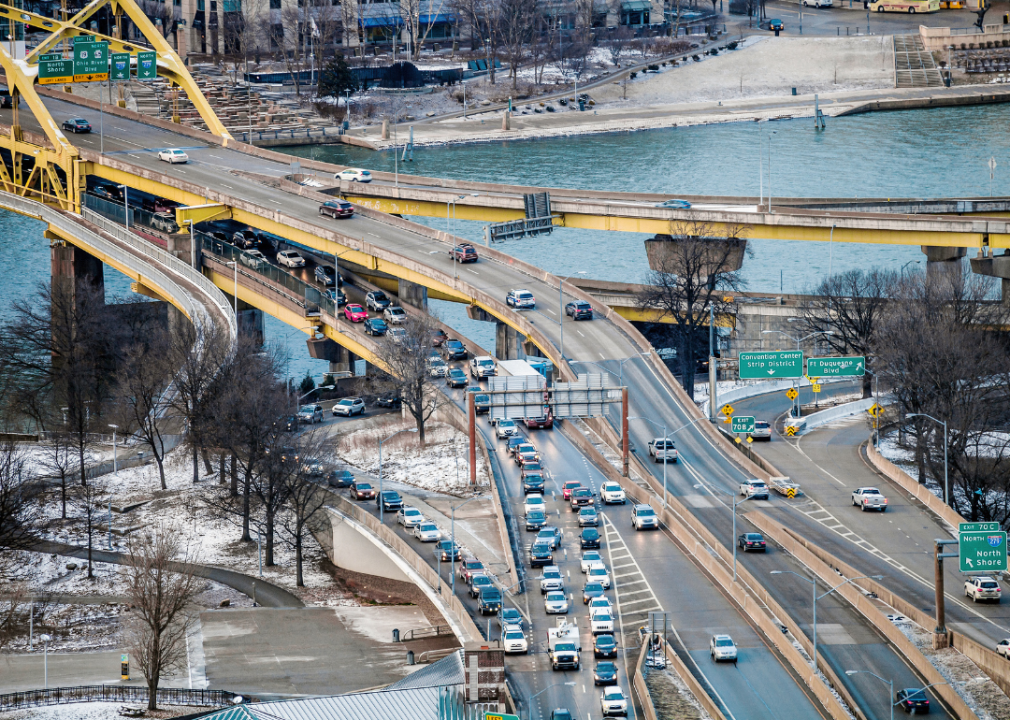
#45. Pennsylvania
A busy highway going over a yellow bridge over a river in Pittsburgh.
Annual vehicle-miles driven: 103.89 billion
—Per capita: 8,008.7
Canva
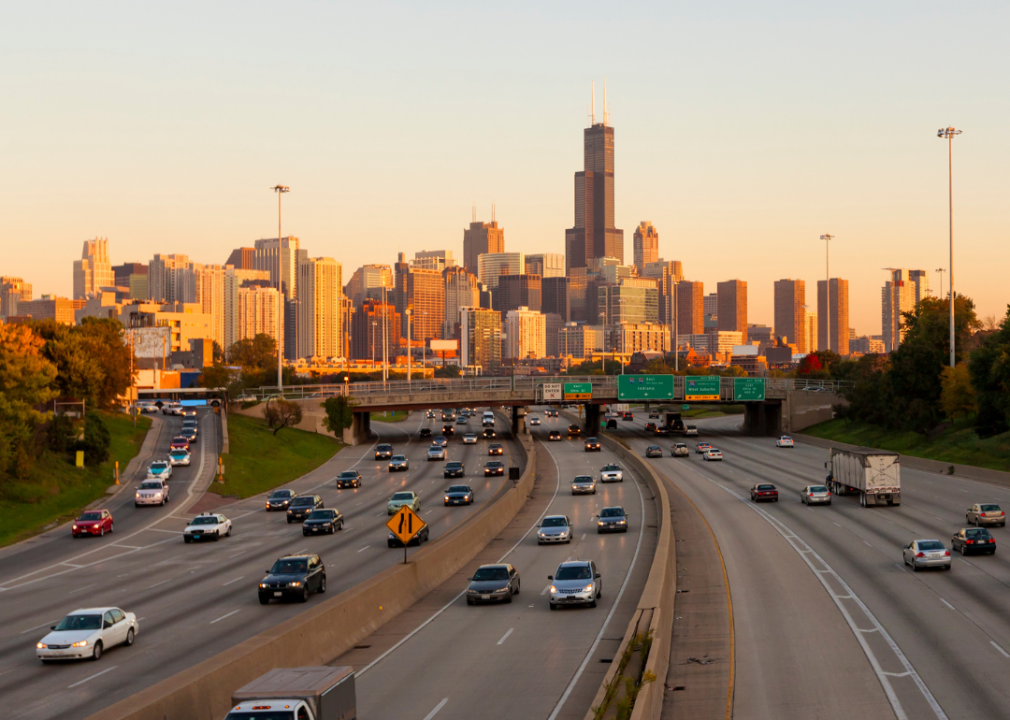
#44. Illinois
Chicago traffic at sunset with the skyline in the background.
Annual vehicle-miles driven: 101.66 billion
—Per capita: 8,079.8
Canva
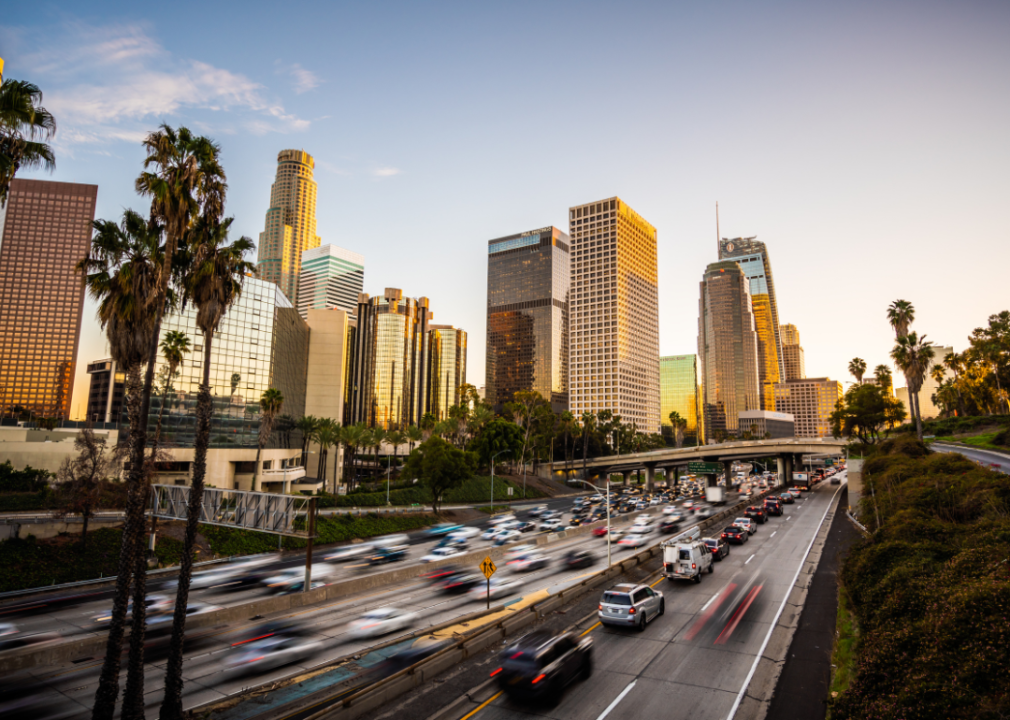
#43. California
Busy highway traffic and skyline of Los Angeles.
Annual vehicle-miles driven: 319.63 billion
—Per capita: 8,189.5

Canva
#42. Connecticut
Modern downtown buildings along the road.
Annual vehicle-miles driven: 30.40 billion
—Per capita: 8,383.7

Canva
#41. New Jersey
A view of New York City from the busy highway-loop in New Jersey.
Annual vehicle-miles driven: 78.62 billion
—Per capita: 8,488.2
Canva
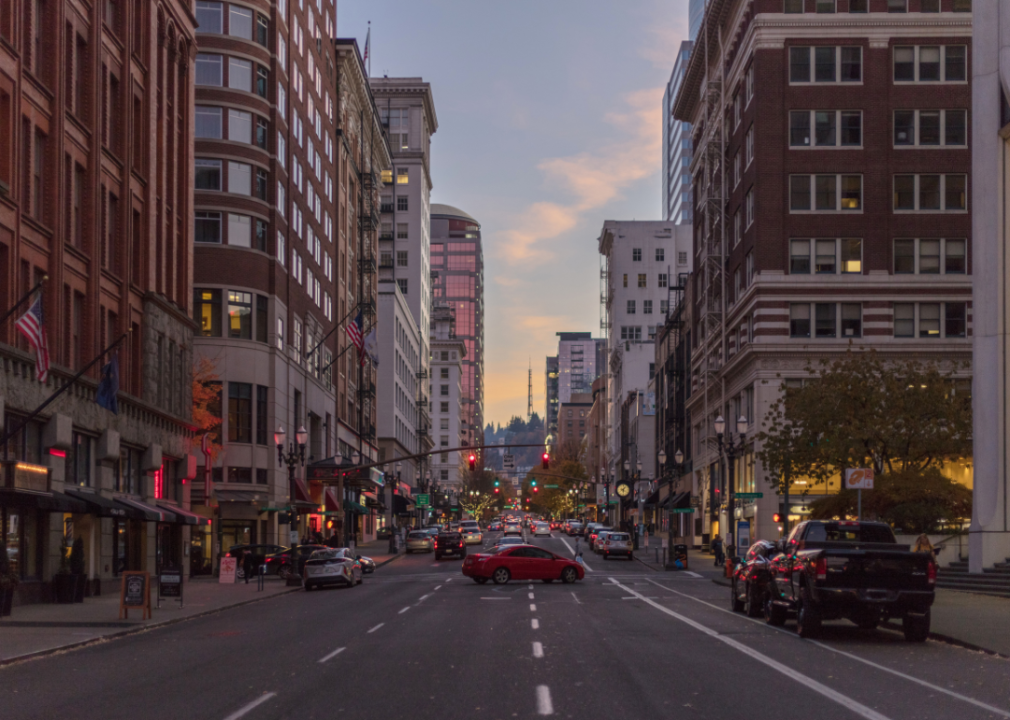
#40. Oregon
Traffic in the city downtown.
Annual vehicle-miles driven: 36.49 billion
—Per capita: 8,606.8

Canva
#39. Nevada
Colorful lights of Las Vegas city buildings and night traffic in the city.
Annual vehicle-miles driven: 27.54 billion
—Per capita: 8,666.1

Canva
#38. Massachusetts
A city skyline over highways.
Annual vehicle-miles driven: 62.12 billion
—Per capita: 8,897.6

Canva
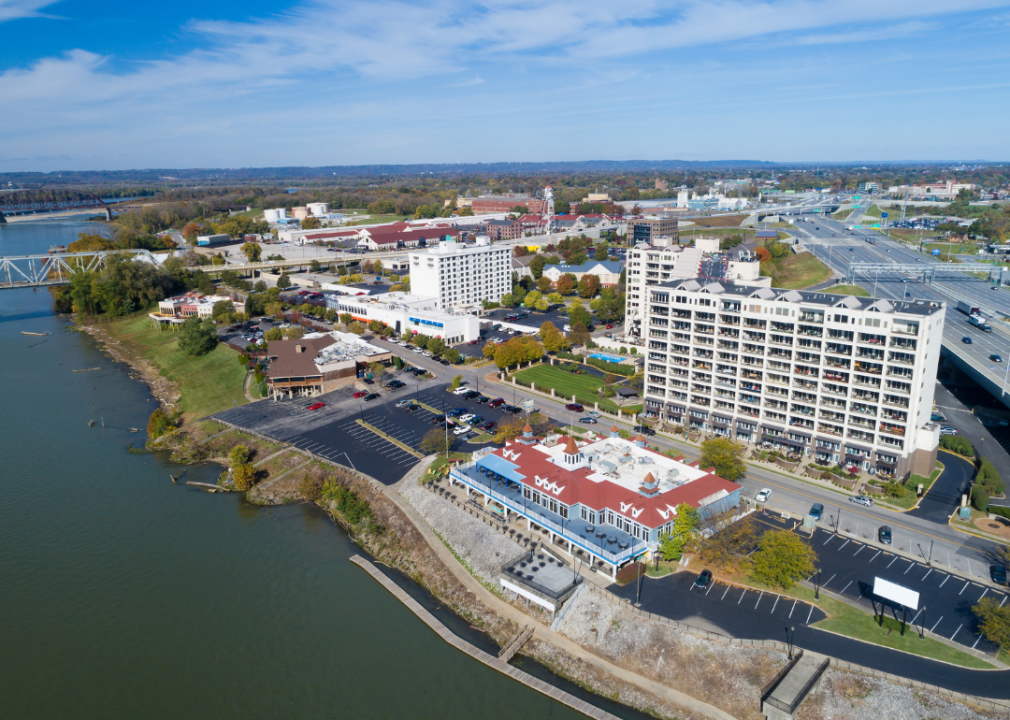
#37. West Virginia
A city skyline with a bridge over a river at sunset.
Annual vehicle-miles driven: 16.35 billion
—Per capita: 9,211.6
Canva
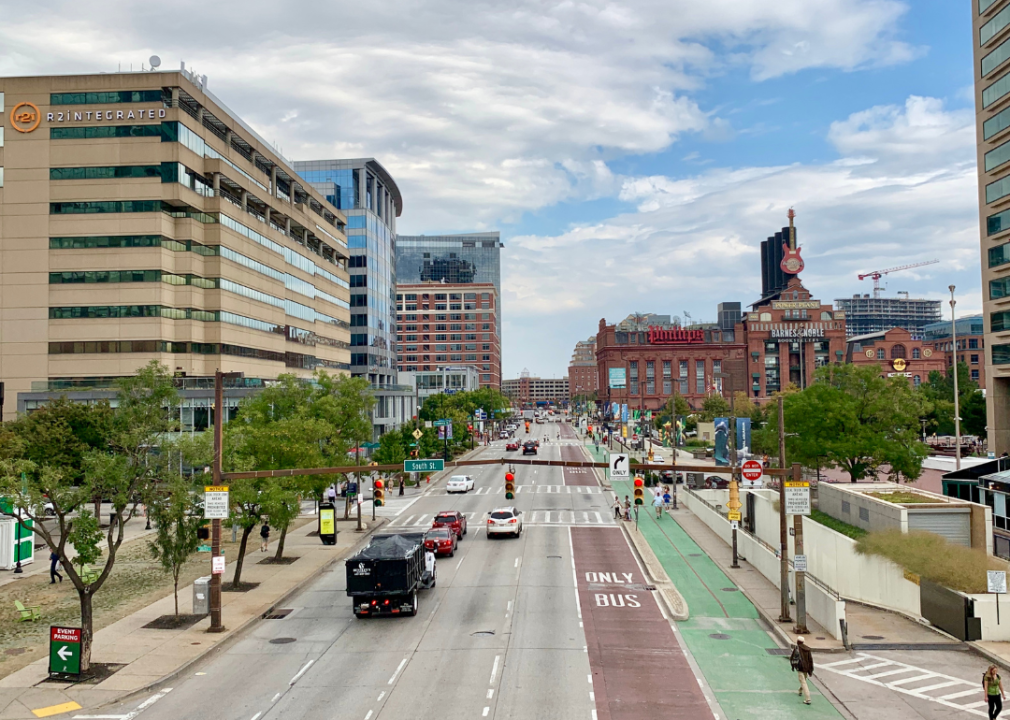
#36. Maryland
A city traffic with tall buildings along the road.
Annual vehicle-miles driven: 57.68 billion
—Per capita: 9,355.9

Canva
#35. Colorado
An aerial view of a city and highways at dusk.
Annual vehicle-miles driven: 54.67 billion
—Per capita: 9,361.6

Canva
#34. Virginia
Busy traffic on the highway at dusk.
Annual vehicle-miles driven: 83.20 billion
—Per capita: 9,580.9
Canva
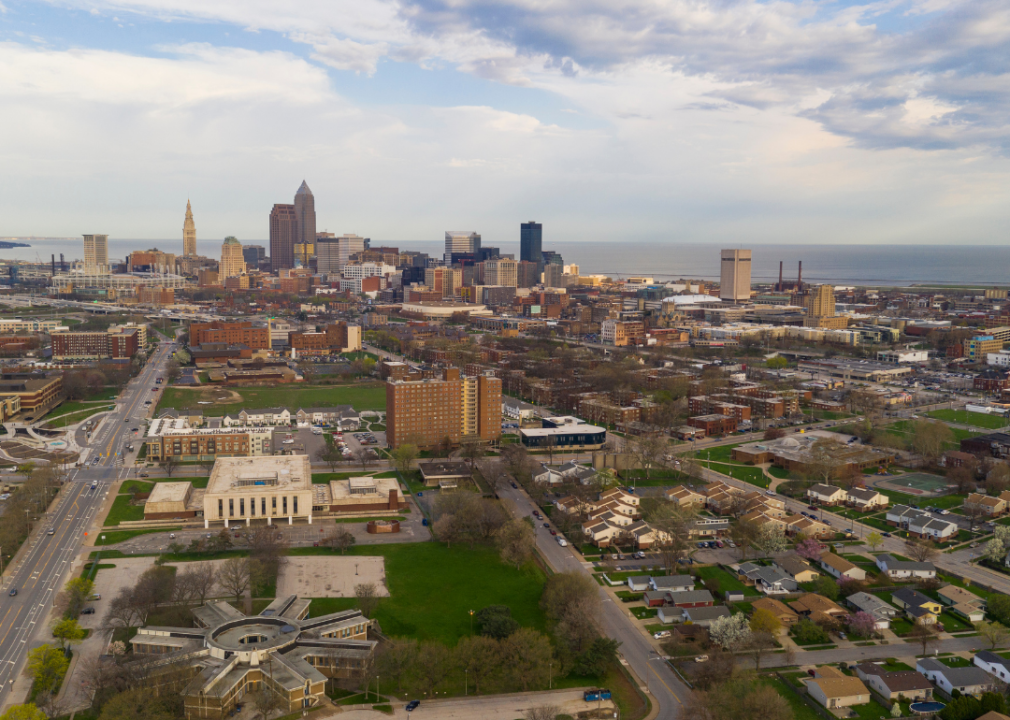
#33. Ohio
Main roads in the city with the skyline in the background.
Annual vehicle-miles driven: 113.94 billion
—Per capita: 9,692.2

Canva
#32. New Hampshire
Highway surrounded by green fields and tall trees.
Annual vehicle-miles driven: 13.61 billion
—Per capita: 9,753.9

Canva
#31. Delaware
A tall suspended bridge over the river with city views.
Annual vehicle-miles driven: 10.02 billion
—Per capita: 9,839.0

Canva
#30. Michigan
City downtown traffic and historic buildings.
Annual vehicle-miles driven: 99.17 billion
—Per capita: 9,883.6

Canva
#29. Texas
City skyline and a road in the city.
Annual vehicle-miles driven: 299.85 billion
—Per capita: 9,985.0

Canva
#28. Idaho
A few cars on a highway surrounded by yellow fields.
Annual vehicle-miles driven: 19.47 billion
—Per capita: 10,043.2

Canva
#27. Minnesota
Skyline of the city at dusk with a bridge over the river in the foreground.
Annual vehicle-miles driven: 57.78 billion
—Per capita: 10,106.9
Canva
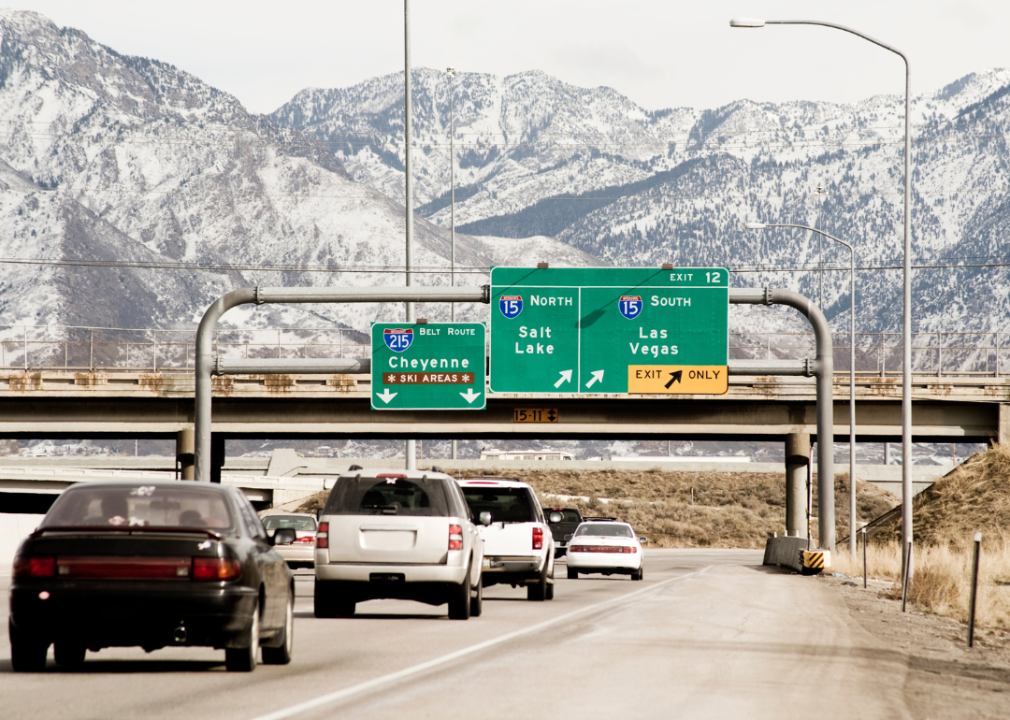
#26. Utah
Traffic on a highway with the snowy mountain peaks in the background.
Annual vehicle-miles driven: 34.35 billion
—Per capita: 10,161.5
Canva
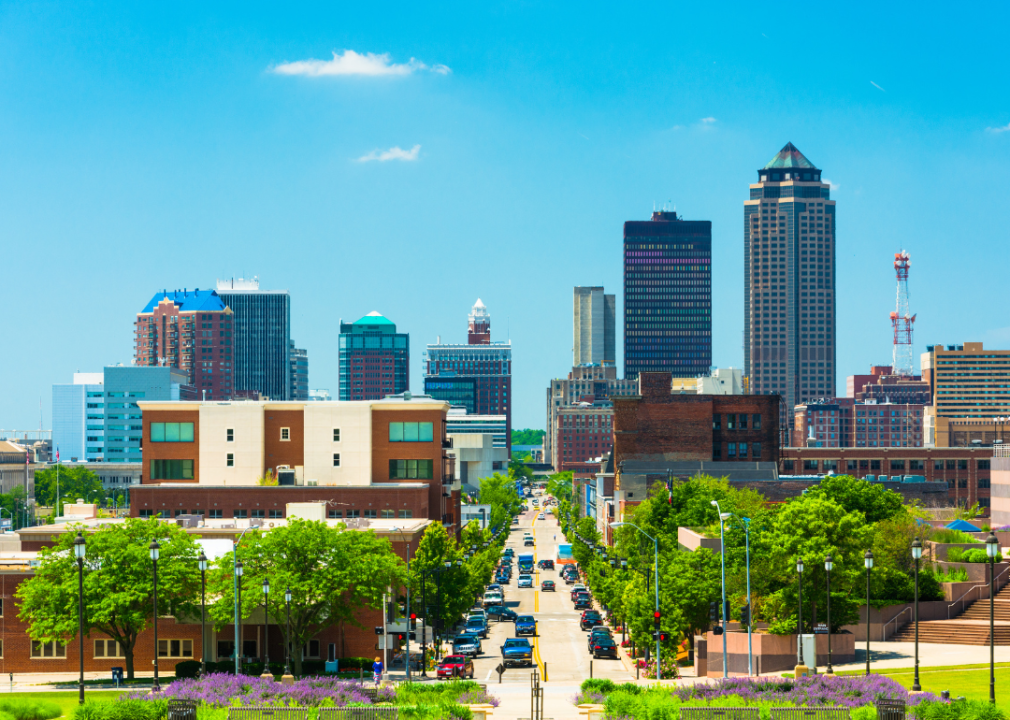
#25. Iowa
Skyline view of the city with city traffic.
Annual vehicle-miles driven: 33.15 billion
—Per capita: 10,356.1

Canva
#24. Arizona
A congested highway.
Annual vehicle-miles driven: 77.38 billion
—Per capita: 10,514.5

Canva
#23. Florida
Interstate highway leading downtown.
Annual vehicle-miles driven: 234.29 billion
—Per capita: 10,532.4
Canva
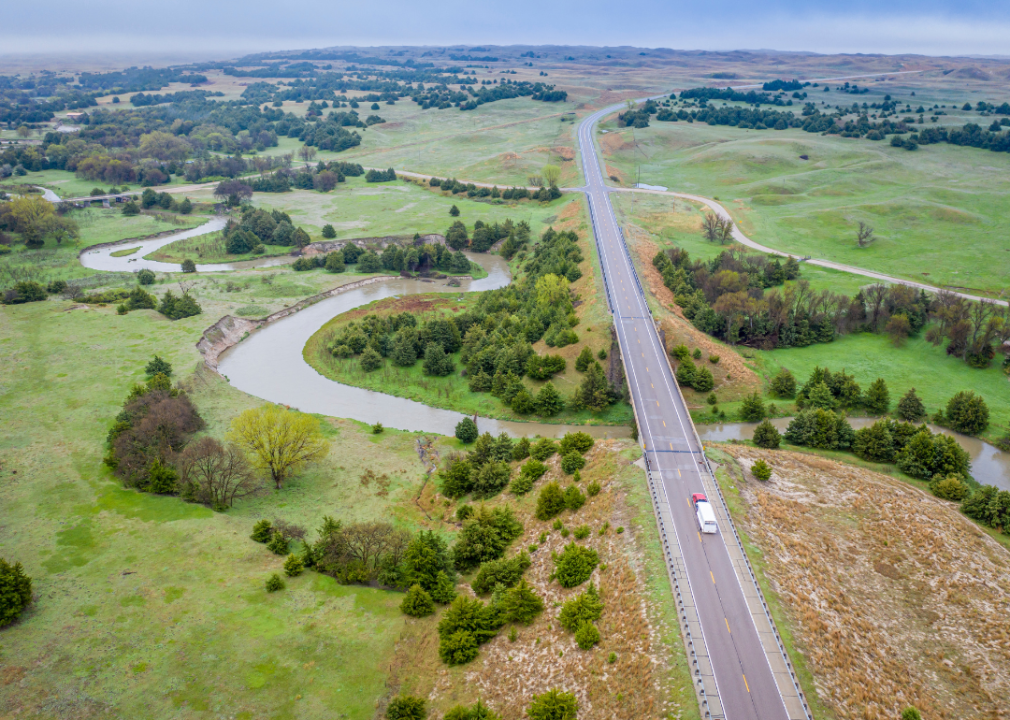
#22. Nebraska
A highway in the middle of green fields and trees passing over a river.
Annual vehicle-miles driven: 20.86 billion
—Per capita: 10,598.5

Canva
#21. South Dakota
A city downtown surrounded by green hills.
Annual vehicle-miles driven: 9.75 billion
—Per capita: 10,718.6

Canva
#20. Vermont
A highway with little traffic surrounded by green woods.
Annual vehicle-miles driven: 6.97 billion
—Per capita: 10,774.8
Canva
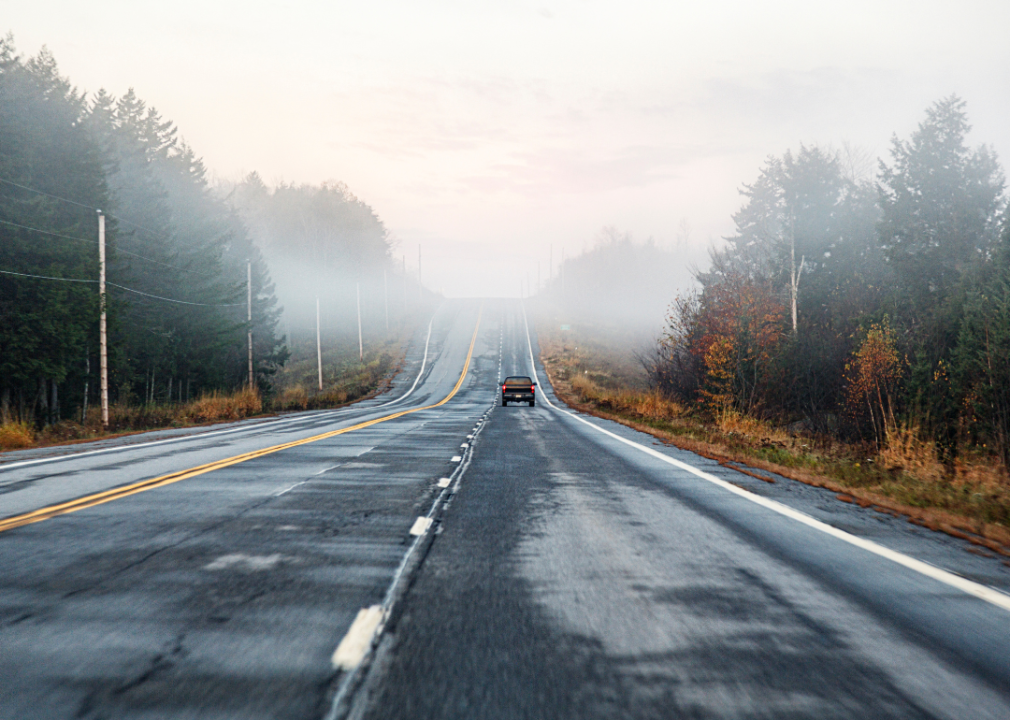
#19. Maine
A pickup truck driving on foggy morning rural highway.
Annual vehicle-miles driven: 14.93 billion
—Per capita: 10,780.0
Canva
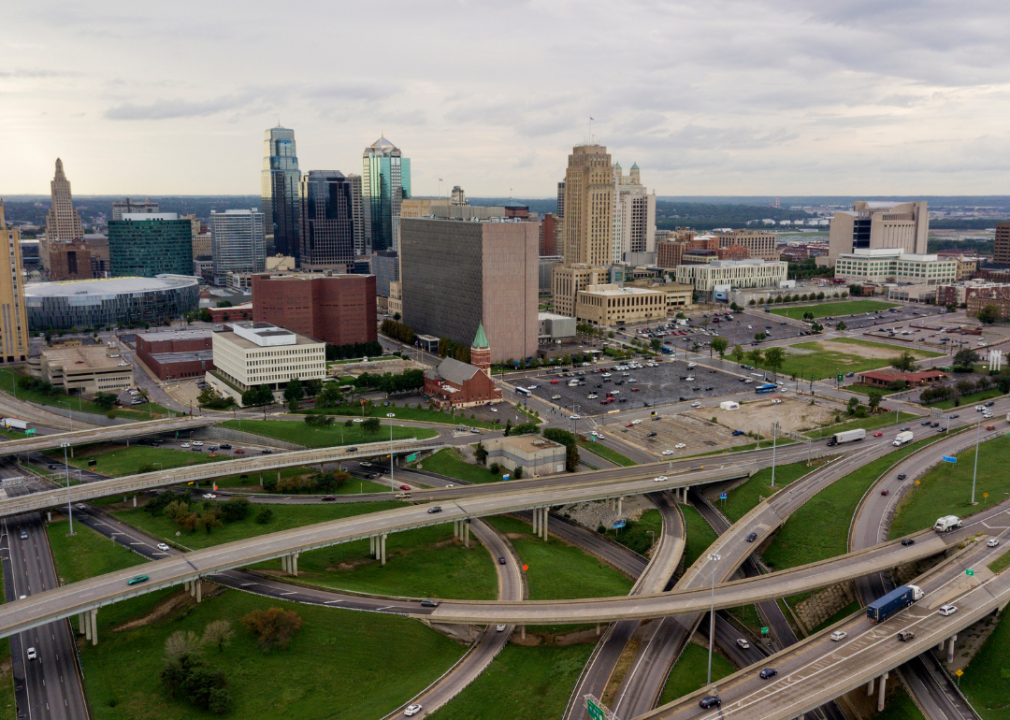
#18. Kansas
An aerial view of highways with the city skyline.
Annual vehicle-miles driven: 31.67 billion
—Per capita: 10,782.2

Canva
#17. Kentucky
An aerial view of a suspended highway.
Annual vehicle-miles driven: 50.26 billion
—Per capita: 11,138.4

Canva
#16. North Carolina
Downtown view of a city.
Annual vehicle-miles driven: 119.59 billion
—Per capita: 11,178.1
Canva
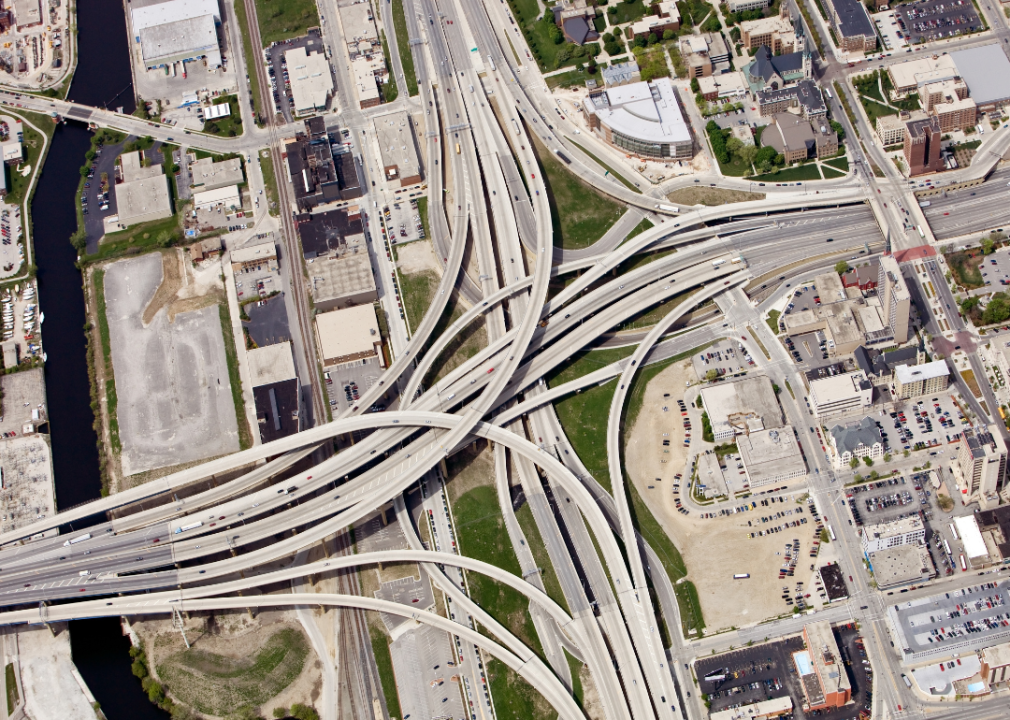
#15. Wisconsin
An aerial view of a large highway interchange.
Annual vehicle-miles driven: 65.88 billion
—Per capita: 11,179.9

Canva
#14. Oklahoma
A city skyline with roads around it.
Annual vehicle-miles driven: 45.20 billion
—Per capita: 11,243.3

Canva
#13. South Carolina
A city downtown with a raised road in the center.
Annual vehicle-miles driven: 60.26 billion
—Per capita: 11,407.8

Canva
#12. Georgia
City skyline with roads leading to the city in the foreground.
Annual vehicle-miles driven: 125.48 billion
—Per capita: 11,498.3
Canva
#11. Indiana
A city view with the roads in the foreground.
Annual vehicle-miles driven: 80.70 billion
—Per capita: 11,810.9
Canva
#10. North Dakota
An aerial view of city skyline at dusk.
Annual vehicle-miles driven: 9.33 billion
—Per capita: 11,978.0
Canva
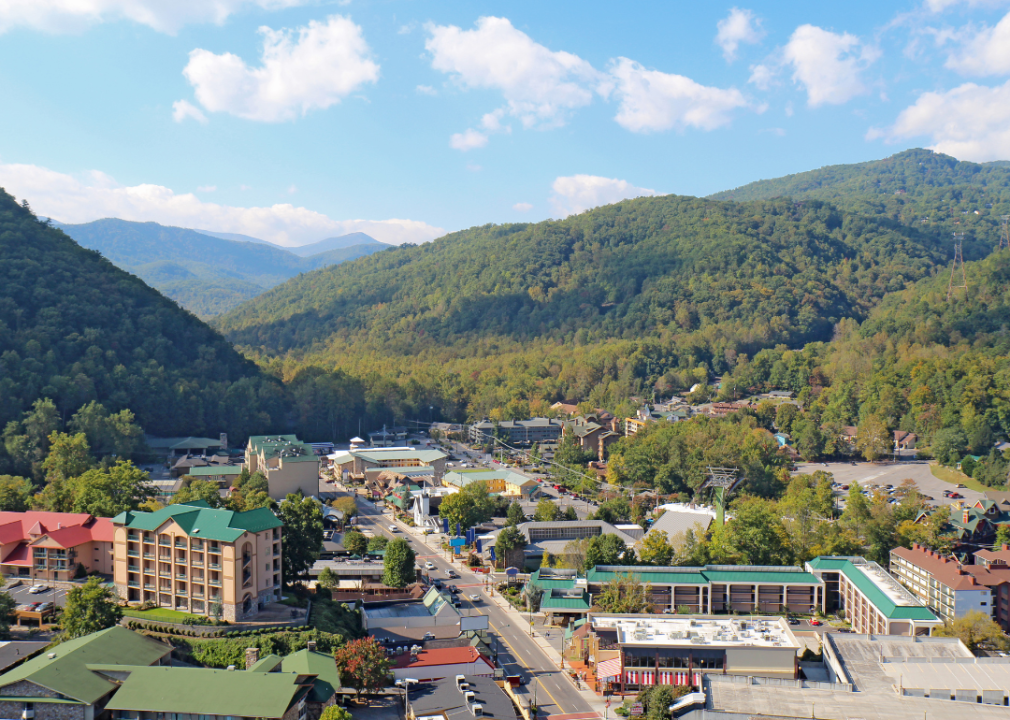
#9. Tennessee
Main road in a small town with tree-covered mountains surrounding it.
Annual vehicle-miles driven: 84.72 billion
—Per capita: 12,014.5

Canva
#8. Montana
Downtown traffic in small town with mountains in the background.
Annual vehicle-miles driven: 13.53 billion
—Per capita: 12,045.1
Canva
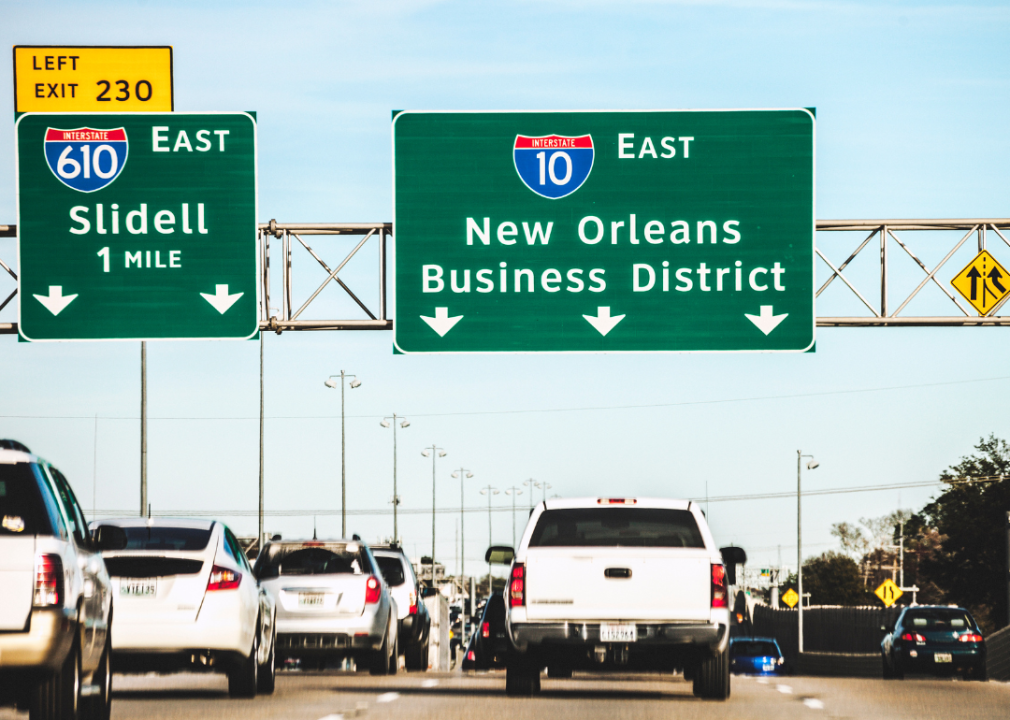
#7. Louisiana
Signs on freeway in New Orleans.
Annual vehicle-miles driven: 55.33 billion
—Per capita: 12,054.7
Canva
#6. Arkansas
Traffic in a town decorated for holidays.
Annual vehicle-miles driven: 38.25 billion
—Per capita: 12,560.3
Canva
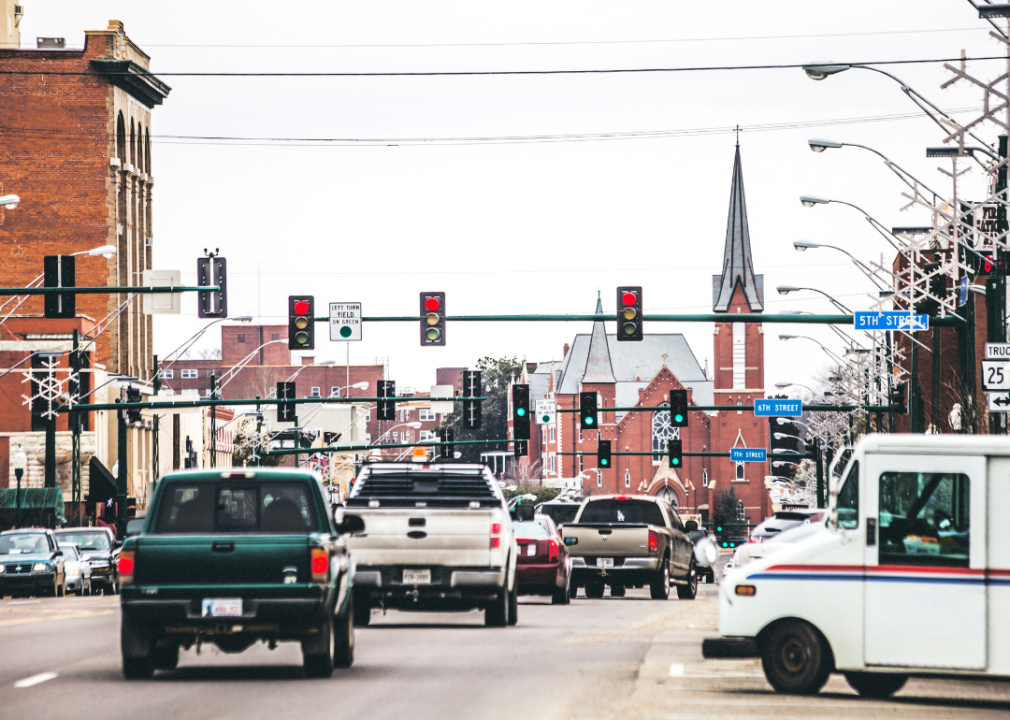
#5. Missouri
Traffic in St. Louis on 7th Street.
Annual vehicle-miles driven: 80.59 billion
—Per capita: 13,045.1

Canva
#4. New Mexico
Long stretch of highway with mountains in the background.
Annual vehicle-miles driven: 27.62 billion
—Per capita: 13,068.4
Canva
#3. Mississippi
An high-angle view of cars driving on the interstate.
Annual vehicle-miles driven: 40.49 billion
—Per capita: 13,771.5
Canva
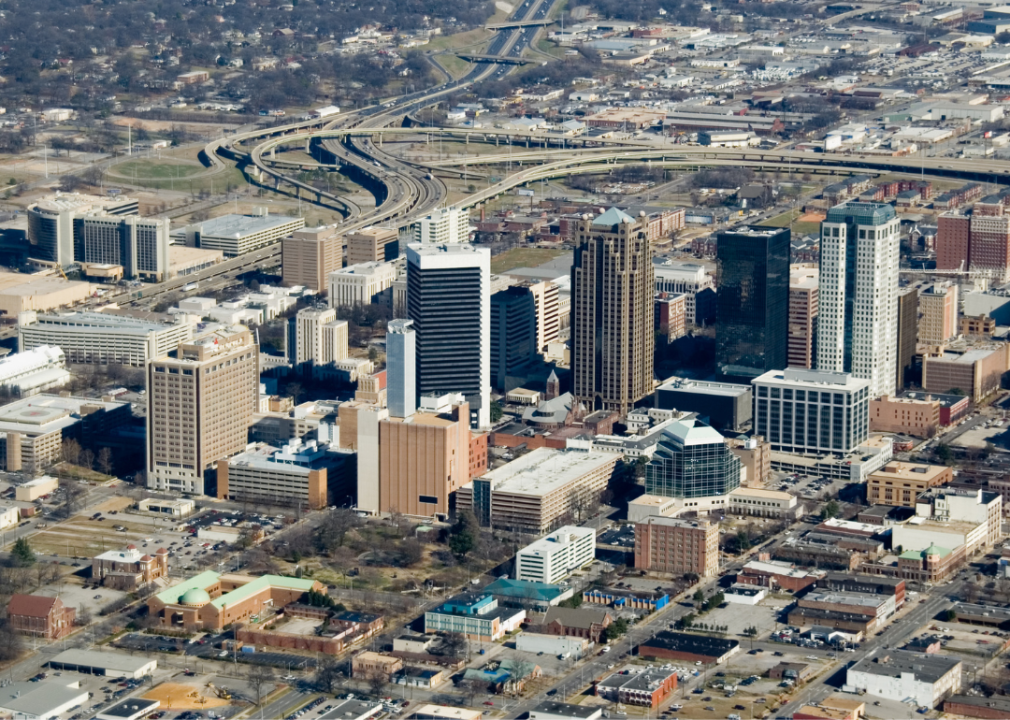
#2. Alabama
An aerial view of a city and highways leading to it.
Annual vehicle-miles driven: 77.64 billion
—Per capita: 15,300.3

Canva
#1. Wyoming
Traffic jam on roads with drifting snow.
Annual vehicle-miles driven: 10.69 billion
—Per capita: 18,378.7
Story editing by Jeff Inglis. Copy editing by Kristen Wegrzyn. Photo selection by Ania Antecka.
This story originally appeared on CheapInsurance.com and was produced and
distributed in partnership with Stacker Studio.