Counties with the highest COVID-19 vaccination rate in Idaho

Greg L. Wright // Wikimedia Commons
Counties with the highest COVID-19 vaccination rate in Idaho
The vaccine deployment in December 2020 signaled a turning point in the COVID-19 pandemic. By the end of May 2021, 40% of the U.S. population was fully vaccinated. But as vaccination rates lagged over the summer, new surges of COVID-19 came, including Delta in the summer of 2021, and now the Omicron variant, which comprises the majority of cases in the U.S.
The United States as of Oct. 28 reached over 1 million COVID-19-related deaths and 97.4 million COVID-19 cases, according to Johns Hopkins University. Currently, 68.4% of the population is fully vaccinated, and 7.3% of people have received the most recent bivalent booster dose.
Stacker compiled a list of the counties with highest COVID-19 vaccination rates in Idaho using data from the U.S. Department of Health & Human Services and Covid Act Now. Counties are ranked by the highest vaccination rate as of Oct. 27, 2022. Due to inconsistencies in reporting, some counties do not have vaccination data available. Case count data based on Oct. 13 numbers reported by the Department of Health and Human Services. Keep reading to see whether your county ranks among the highest COVID-19 vaccination rates in your state.
![]()

Forest Service Northern Region from Missoula, MT, USA // Wikimedia Commons
#44. Idaho County
– Population that is fully vaccinated: 31.5% (5,250 fully vaccinated)
— 44.3% lower vaccination rate than Idaho
– Cumulative deaths per 100k: 348 (58 total deaths)
— 19.2% more deaths per 100k residents than Idaho
– Cumulative cases per 100k: 20,604 (3,434 total cases)
— 26.3% less cases per 100k residents than Idaho

Ian Poellet // Wikimedia Commons
#43. Payette County
– Population that is fully vaccinated: 32.8% (7,851 fully vaccinated)
— 42.0% lower vaccination rate than Idaho
– Cumulative deaths per 100k: 376 (90 total deaths)
— 28.8% more deaths per 100k residents than Idaho
– Cumulative cases per 100k: 26,546 (6,358 total cases)
— 5.1% less cases per 100k residents than Idaho

PdxCobra // Wikimedia Commons
#42. Boise County
– Population that is fully vaccinated: 34.4% (2,691 fully vaccinated)
— 39.2% lower vaccination rate than Idaho
– Cumulative deaths per 100k: 179 (14 total deaths)
— 38.7% less deaths per 100k residents than Idaho
– Cumulative cases per 100k: 16,115 (1,262 total cases)
— 42.4% less cases per 100k residents than Idaho

Federal Highway Administration // Wikimedia Commons
#41. Boundary County
– Population that is fully vaccinated: 36.1% (4,422 fully vaccinated)
— 36.2% lower vaccination rate than Idaho
– Cumulative deaths per 100k: 547 (67 total deaths)
— 87.3% more deaths per 100k residents than Idaho
– Cumulative cases per 100k: 18,865 (2,310 total cases)
— 32.6% less cases per 100k residents than Idaho

United States Department of Agriculture // Wikimedia Commons
#40. Owyhee County
– Population that is fully vaccinated: 36.5% (4,312 fully vaccinated)
— 35.5% lower vaccination rate than Idaho
– Cumulative deaths per 100k: 448 (53 total deaths)
— 53.4% more deaths per 100k residents than Idaho
– Cumulative cases per 100k: 21,255 (2,513 total cases)
— 24.0% less cases per 100k residents than Idaho
Sam Beebe // Wikimedia Commons
#39. Washington County
– Population that is fully vaccinated: 40.9% (4,174 fully vaccinated)
— 27.7% lower vaccination rate than Idaho
– Cumulative deaths per 100k: 579 (59 total deaths)
— 98.3% more deaths per 100k residents than Idaho
– Cumulative cases per 100k: 25,074 (2,556 total cases)
— 10.4% less cases per 100k residents than Idaho

Dschwen // Wikimedia Commons
#38. Caribou County
– Population that is fully vaccinated: 41.1% (2,944 fully vaccinated)
— 27.4% lower vaccination rate than Idaho
– Cumulative deaths per 100k: 475 (34 total deaths)
— 62.7% more deaths per 100k residents than Idaho
– Cumulative cases per 100k: 22,544 (1,613 total cases)
— 19.4% less cases per 100k residents than Idaho

John D // Wikimedia Commons
#37. Gem County
– Population that is fully vaccinated: 41.1% (7,448 fully vaccinated)
— 27.4% lower vaccination rate than Idaho
– Cumulative deaths per 100k: 458 (83 total deaths)
— 56.8% more deaths per 100k residents than Idaho
– Cumulative cases per 100k: 22,565 (4,087 total cases)
— 19.3% less cases per 100k residents than Idaho

Tom Young // Wikimedia Commons
#36. Lincoln County
– Population that is fully vaccinated: 42.4% (2,276 fully vaccinated)
— 25.1% lower vaccination rate than Idaho
– Cumulative deaths per 100k: 280 (15 total deaths)
— 4.1% less deaths per 100k residents than Idaho
– Cumulative cases per 100k: 22,698 (1,218 total cases)
— 18.8% less cases per 100k residents than Idaho

Kristen Taylor // Wikimedia Commons
#35. Clark County
– Population that is fully vaccinated: 43.3% (366 fully vaccinated)
— 23.5% lower vaccination rate than Idaho
– Cumulative deaths per 100k: 118 (1 total deaths)
— 59.6% less deaths per 100k residents than Idaho
– Cumulative cases per 100k: 13,728 (116 total cases)
— 50.9% less cases per 100k residents than Idaho
![]()
Jon Roanhaus // Wikimedia Commons
#34. Clearwater County
– Population that is fully vaccinated: 43.8% (3,836 fully vaccinated)
— 22.6% lower vaccination rate than Idaho
– Cumulative deaths per 100k: 411 (36 total deaths)
— 40.8% more deaths per 100k residents than Idaho
– Cumulative cases per 100k: 28,997 (2,539 total cases)
— 3.7% more cases per 100k residents than Idaho

jfergusonphotos // Shutterstock
#33. Shoshone County
– Population that is fully vaccinated: 44.0% (5,670 fully vaccinated)
— 22.3% lower vaccination rate than Idaho
– Cumulative deaths per 100k: 613 (79 total deaths)
— 109.9% more deaths per 100k residents than Idaho
– Cumulative cases per 100k: 23,374 (3,011 total cases)
— 16.4% less cases per 100k residents than Idaho
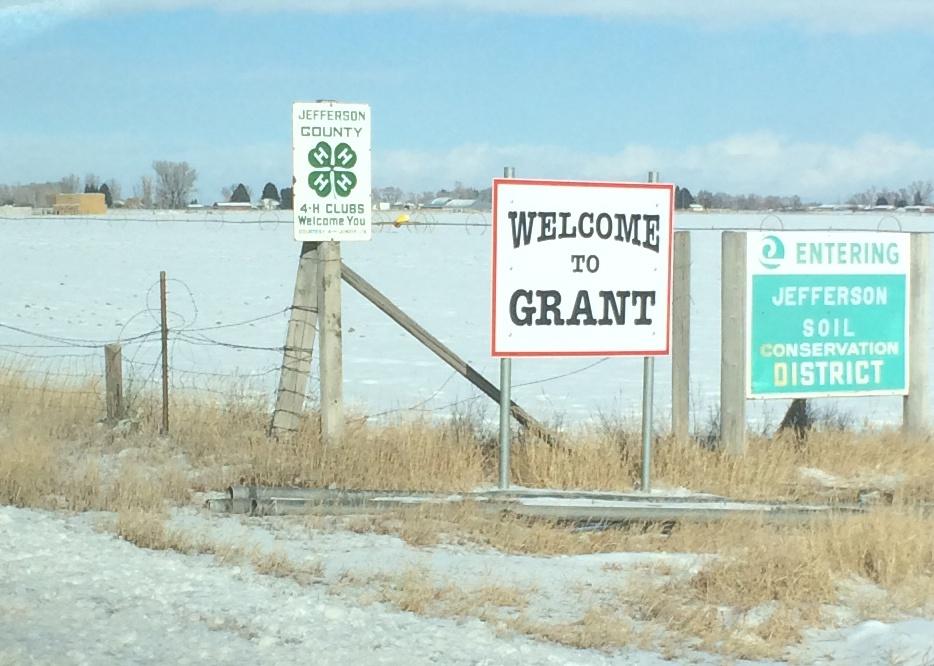
Bathlander // Wikimedia Commons
#32. Jefferson County
– Population that is fully vaccinated: 44.1% (13,179 fully vaccinated)
— 22.1% lower vaccination rate than Idaho
– Cumulative deaths per 100k: 224 (67 total deaths)
— 23.3% less deaths per 100k residents than Idaho
– Cumulative cases per 100k: 22,001 (6,572 total cases)
— 21.3% less cases per 100k residents than Idaho
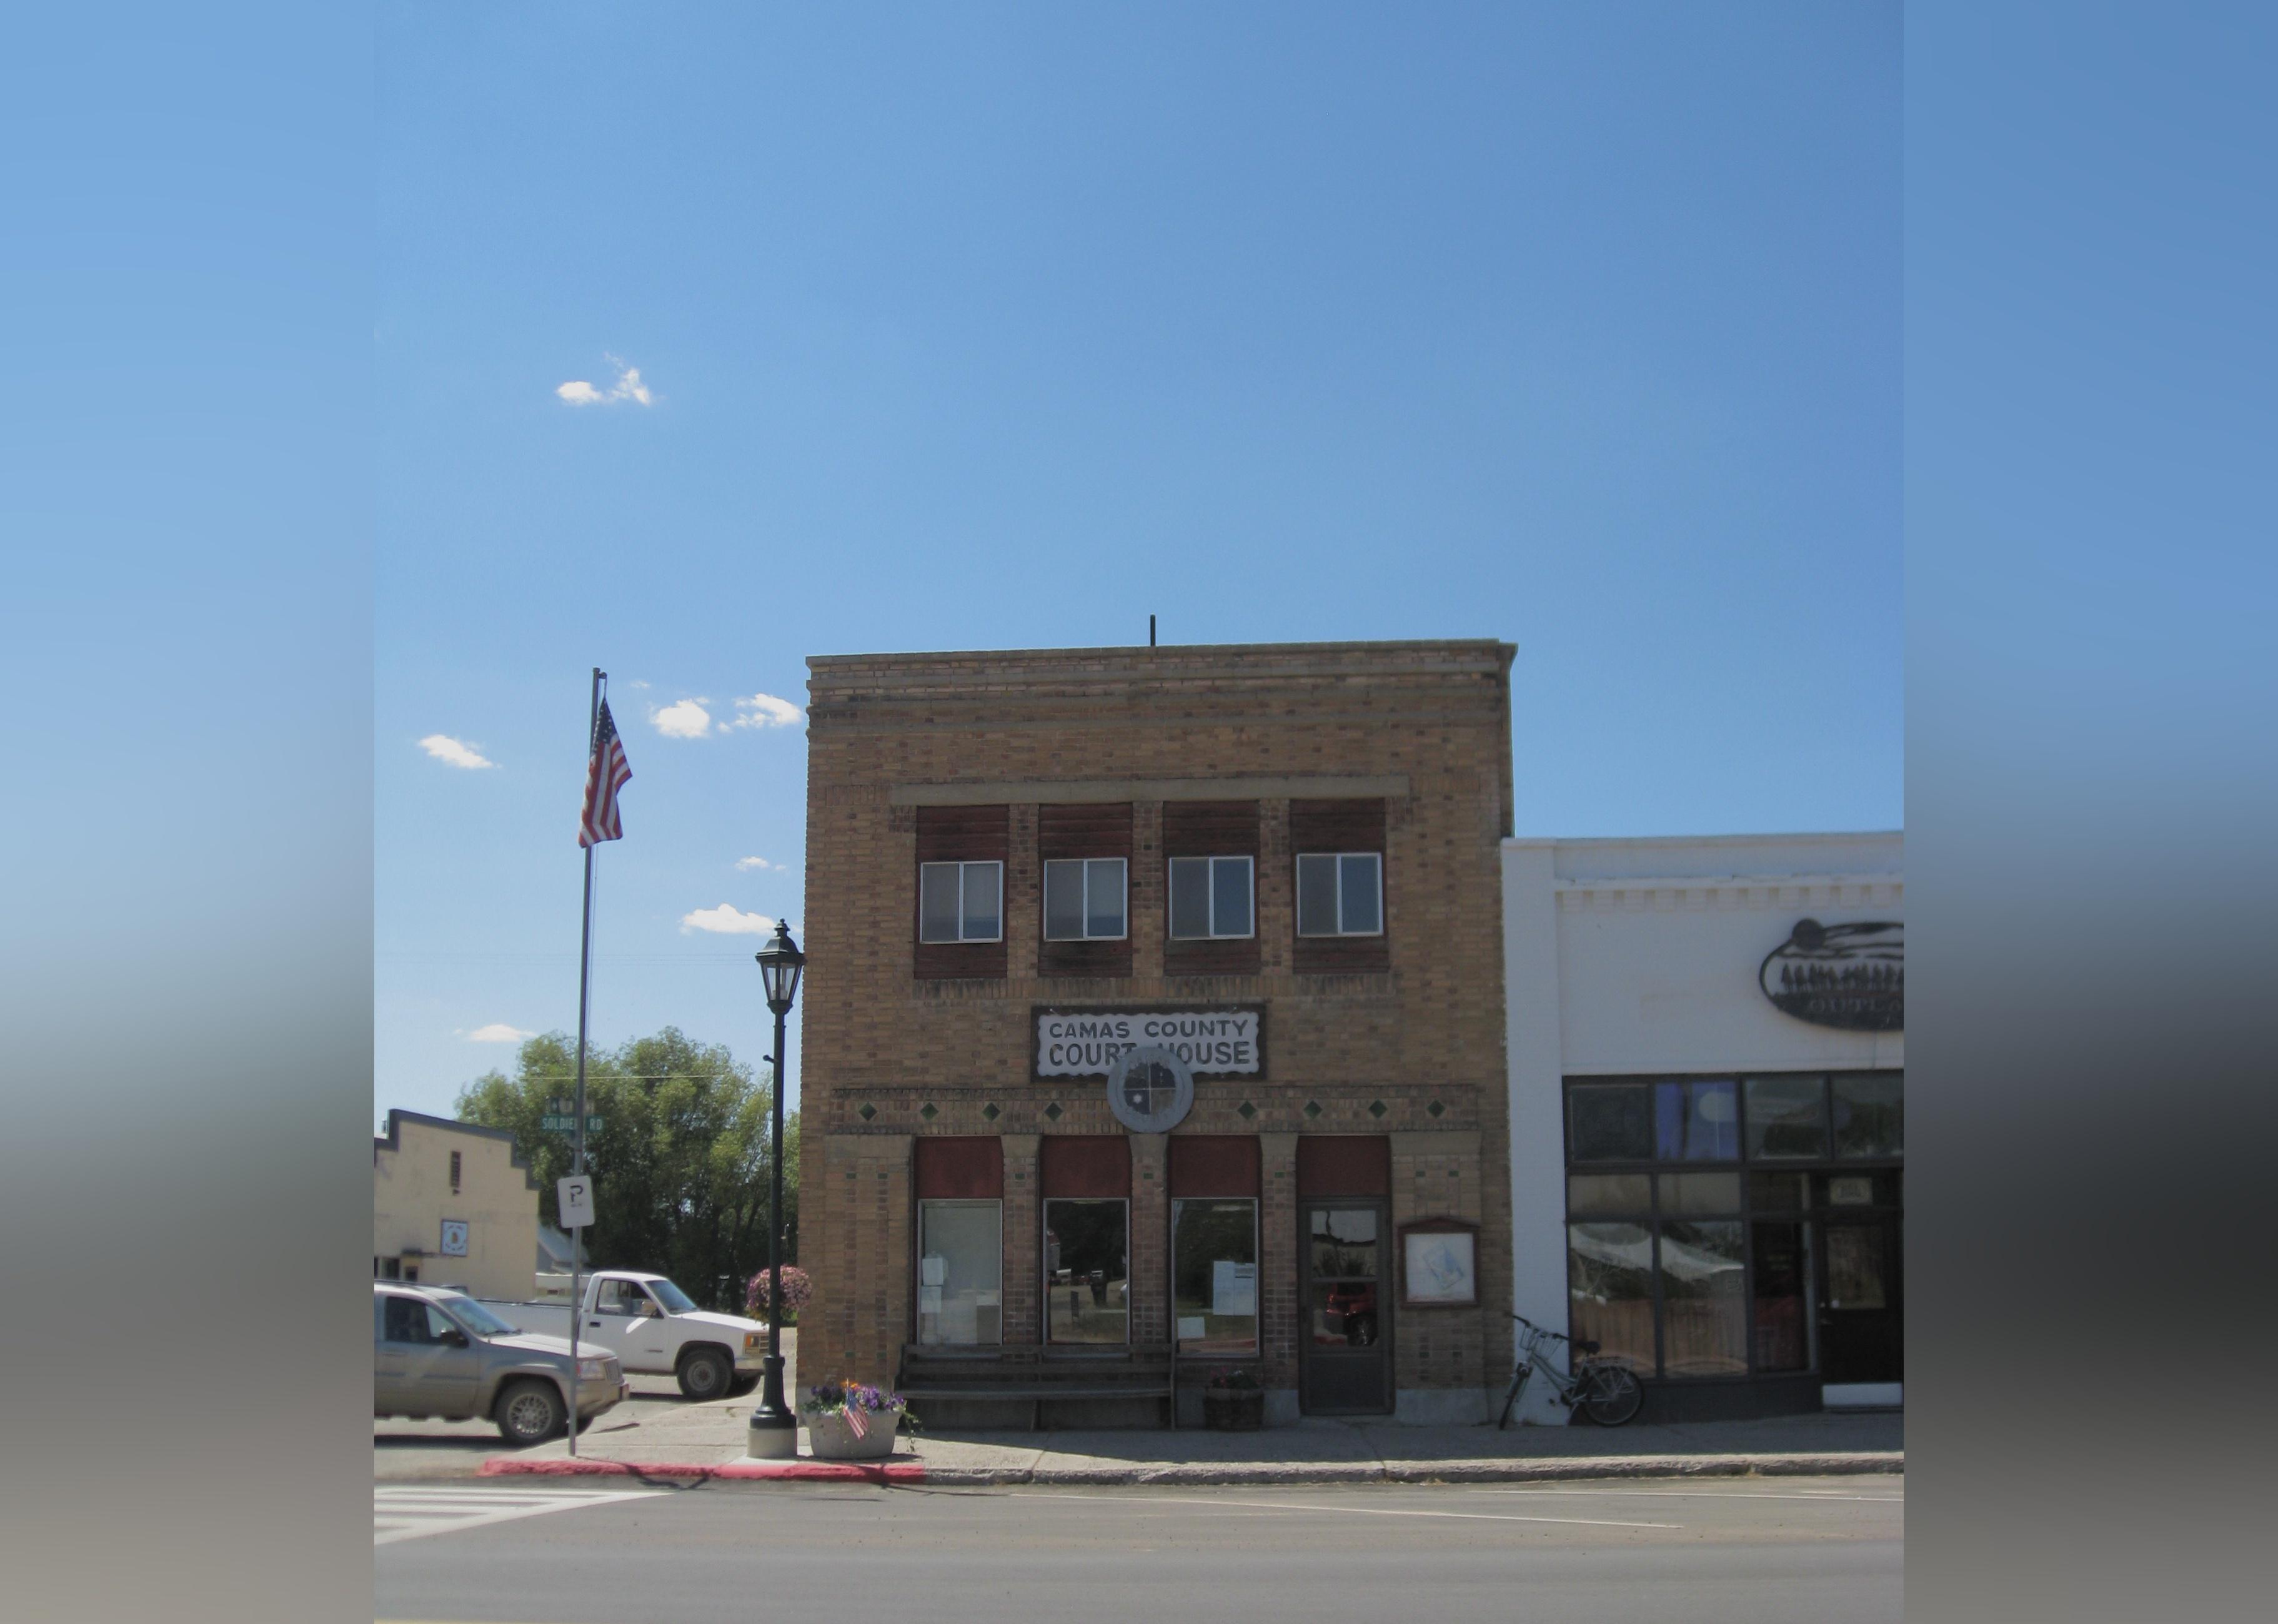
Cornellrockey04 // Wikimedia Commons
#31. Camas County
– Population that is fully vaccinated: 44.3% (490 fully vaccinated)
— 21.7% lower vaccination rate than Idaho
– Cumulative deaths per 100k: 181 (2 total deaths)
— 38.0% less deaths per 100k residents than Idaho
– Cumulative cases per 100k: 15,461 (171 total cases)
— 44.7% less cases per 100k residents than Idaho

Ken Lund // Wikimedia Commons
#30. Minidoka County
– Population that is fully vaccinated: 44.3% (9,325 fully vaccinated)
— 21.7% lower vaccination rate than Idaho
– Cumulative deaths per 100k: 318 (67 total deaths)
— 8.9% more deaths per 100k residents than Idaho
– Cumulative cases per 100k: 22,097 (4,649 total cases)
— 21.0% less cases per 100k residents than Idaho

L’Aquatique // Wikimedia Commons
#29. Bonner County
– Population that is fully vaccinated: 44.3% (20,282 fully vaccinated)
— 21.7% lower vaccination rate than Idaho
– Cumulative deaths per 100k: 422 (193 total deaths)
— 44.5% more deaths per 100k residents than Idaho
– Cumulative cases per 100k: 21,763 (9,954 total cases)
— 22.2% less cases per 100k residents than Idaho

wilson44691 // Wikimedia Commons
#28. Cassia County
– Population that is fully vaccinated: 44.5% (10,686 fully vaccinated)
— 21.4% lower vaccination rate than Idaho
– Cumulative deaths per 100k: 229 (55 total deaths)
— 21.6% less deaths per 100k residents than Idaho
– Cumulative cases per 100k: 22,447 (5,394 total cases)
— 19.7% less cases per 100k residents than Idaho

Ken Lund // Wikimedia Commons
#27. Adams County
– Population that is fully vaccinated: 44.9% (1,926 fully vaccinated)
— 20.7% lower vaccination rate than Idaho
– Cumulative deaths per 100k: 373 (16 total deaths)
— 27.7% more deaths per 100k residents than Idaho
– Cumulative cases per 100k: 17,955 (771 total cases)
— 35.8% less cases per 100k residents than Idaho

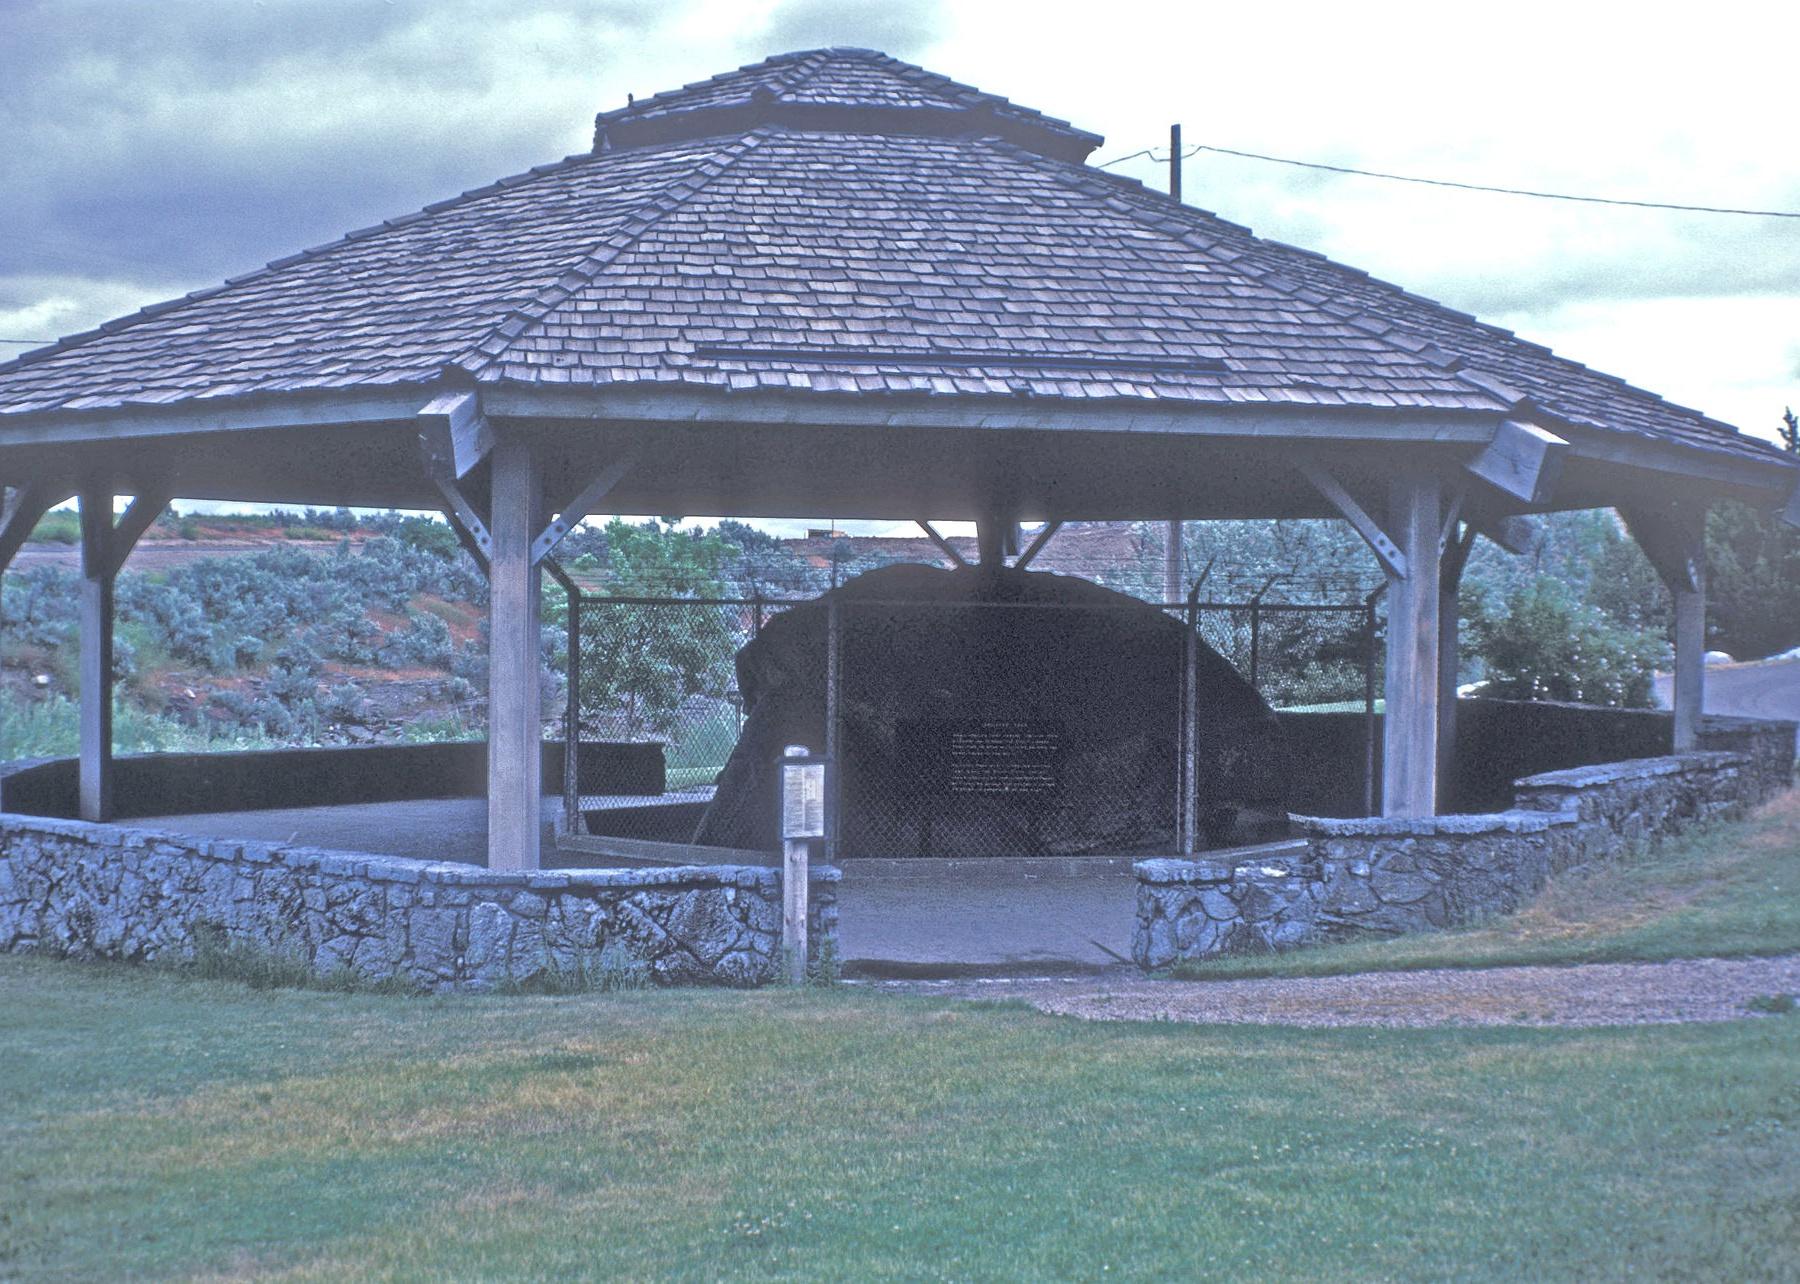
NPS photo // Wikimedia Commons
#26. Gooding County
– Population that is fully vaccinated: 45.5% (6,900 fully vaccinated)
— 19.6% lower vaccination rate than Idaho
– Cumulative deaths per 100k: 395 (60 total deaths)
— 35.3% more deaths per 100k residents than Idaho
– Cumulative cases per 100k: 24,659 (3,743 total cases)
— 11.8% less cases per 100k residents than Idaho

Ken Lund // Wikimedia Commons
#25. Franklin County
– Population that is fully vaccinated: 46.2% (6,405 fully vaccinated)
— 18.4% lower vaccination rate than Idaho
– Cumulative deaths per 100k: 216 (30 total deaths)
— 26.0% less deaths per 100k residents than Idaho
– Cumulative cases per 100k: 18,082 (2,509 total cases)
— 35.4% less cases per 100k residents than Idaho

Aualliso // Wikimedia Commons
#24. Fremont County
– Population that is fully vaccinated: 46.7% (6,119 fully vaccinated)
— 17.5% lower vaccination rate than Idaho
– Cumulative deaths per 100k: 229 (30 total deaths)
— 21.6% less deaths per 100k residents than Idaho
– Cumulative cases per 100k: 17,910 (2,346 total cases)
— 36.0% less cases per 100k residents than Idaho

Larry D. Moore // Wikimedia Commons
#23. Jerome County
– Population that is fully vaccinated: 47.5% (11,595 fully vaccinated)
— 16.1% lower vaccination rate than Idaho
– Cumulative deaths per 100k: 274 (67 total deaths)
— 6.2% less deaths per 100k residents than Idaho
– Cumulative cases per 100k: 28,097 (6,859 total cases)
— 0.5% more cases per 100k residents than Idaho

Tricia Simpson // Wikimedia Commons
#22. Oneida County
– Population that is fully vaccinated: 47.6% (2,159 fully vaccinated)
— 15.9% lower vaccination rate than Idaho
– Cumulative deaths per 100k: 265 (12 total deaths)
— 9.2% less deaths per 100k residents than Idaho
– Cumulative cases per 100k: 20,062 (909 total cases)
— 28.3% less cases per 100k residents than Idaho

Tricia Simpson // Wikimedia Commons
#21. Bear Lake County
– Population that is fully vaccinated: 47.6% (2,913 fully vaccinated)
— 15.9% lower vaccination rate than Idaho
– Cumulative deaths per 100k: 294 (18 total deaths)
— 0.7% more deaths per 100k residents than Idaho
– Cumulative cases per 100k: 17,208 (1,054 total cases)
— 38.5% less cases per 100k residents than Idaho

Antony-22 // Wikimedia Commons
#20. Kootenai County
– Population that is fully vaccinated: 47.7% (79,081 fully vaccinated)
— 15.7% lower vaccination rate than Idaho
– Cumulative deaths per 100k: 383 (635 total deaths)
— 31.2% more deaths per 100k residents than Idaho
– Cumulative cases per 100k: 27,542 (45,636 total cases)
— 1.5% less cases per 100k residents than Idaho

Tamanoeconomico // Wikimedia Commons
#19. Canyon County
– Population that is fully vaccinated: 47.9% (110,136 fully vaccinated)
— 15.4% lower vaccination rate than Idaho
– Cumulative deaths per 100k: 311 (715 total deaths)
— 6.5% more deaths per 100k residents than Idaho
– Cumulative cases per 100k: 29,535 (67,885 total cases)
— 5.6% more cases per 100k residents than Idaho

tinosa // Wikimedia Commons
#18. Custer County
– Population that is fully vaccinated: 48.3% (2,085 fully vaccinated)
— 14.7% lower vaccination rate than Idaho
– Cumulative deaths per 100k: 209 (9 total deaths)
— 28.4% less deaths per 100k residents than Idaho
– Cumulative cases per 100k: 15,805 (682 total cases)
— 43.5% less cases per 100k residents than Idaho

John Stanton // Wikimedia Commons
#17. Lemhi County
– Population that is fully vaccinated: 48.7% (3,911 fully vaccinated)
— 14.0% lower vaccination rate than Idaho
– Cumulative deaths per 100k: 349 (28 total deaths)
— 19.5% more deaths per 100k residents than Idaho
– Cumulative cases per 100k: 21,054 (1,690 total cases)
— 24.7% less cases per 100k residents than Idaho

KRRK // Wikimedia Commons
#16. Bingham County
– Population that is fully vaccinated: 49.7% (23,275 fully vaccinated)
— 12.2% lower vaccination rate than Idaho
– Cumulative deaths per 100k: 359 (168 total deaths)
— 22.9% more deaths per 100k residents than Idaho
– Cumulative cases per 100k: 23,042 (10,786 total cases)
— 17.6% less cases per 100k residents than Idaho

Squelle // Wikimedia Commons
#15. Butte County
– Population that is fully vaccinated: 50.3% (1,306 fully vaccinated)
— 11.1% lower vaccination rate than Idaho
– Cumulative deaths per 100k: 462 (12 total deaths)
— 58.2% more deaths per 100k residents than Idaho
– Cumulative cases per 100k: 20,485 (532 total cases)
— 26.8% less cases per 100k residents than Idaho

Karthikc123 // Wikimedia Commons
#14. Twin Falls County
– Population that is fully vaccinated: 51.3% (44,562 fully vaccinated)
— 9.4% lower vaccination rate than Idaho
– Cumulative deaths per 100k: 353 (307 total deaths)
— 20.9% more deaths per 100k residents than Idaho
– Cumulative cases per 100k: 31,534 (27,396 total cases)
— 12.7% more cases per 100k residents than Idaho
JERRYE & ROY KLOTZ MD // Wikimedia Commons
#13. Power County
– Population that is fully vaccinated: 52.5% (4,033 fully vaccinated)
— 7.2% lower vaccination rate than Idaho
– Cumulative deaths per 100k: 260 (20 total deaths)
— 11.0% less deaths per 100k residents than Idaho
– Cumulative cases per 100k: 20,766 (1,595 total cases)
— 25.8% less cases per 100k residents than Idaho

rustejunk // Wikimedia Commons
#12. Lewis County
– Population that is fully vaccinated: 53.8% (2,065 fully vaccinated)
— 4.9% lower vaccination rate than Idaho
– Cumulative deaths per 100k: 782 (30 total deaths)
— 167.8% more deaths per 100k residents than Idaho
– Cumulative cases per 100k: 34,106 (1,309 total cases)
— 21.9% more cases per 100k residents than Idaho

Michlaovic // Wikimedia
#11. Bannock County
– Population that is fully vaccinated: 54.0% (47,430 fully vaccinated)
— 4.6% lower vaccination rate than Idaho
– Cumulative deaths per 100k: 304 (267 total deaths)
— 4.1% more deaths per 100k residents than Idaho
– Cumulative cases per 100k: 26,887 (23,609 total cases)
— 3.9% less cases per 100k residents than Idaho
Ian Poellet // Wikimedia Commons
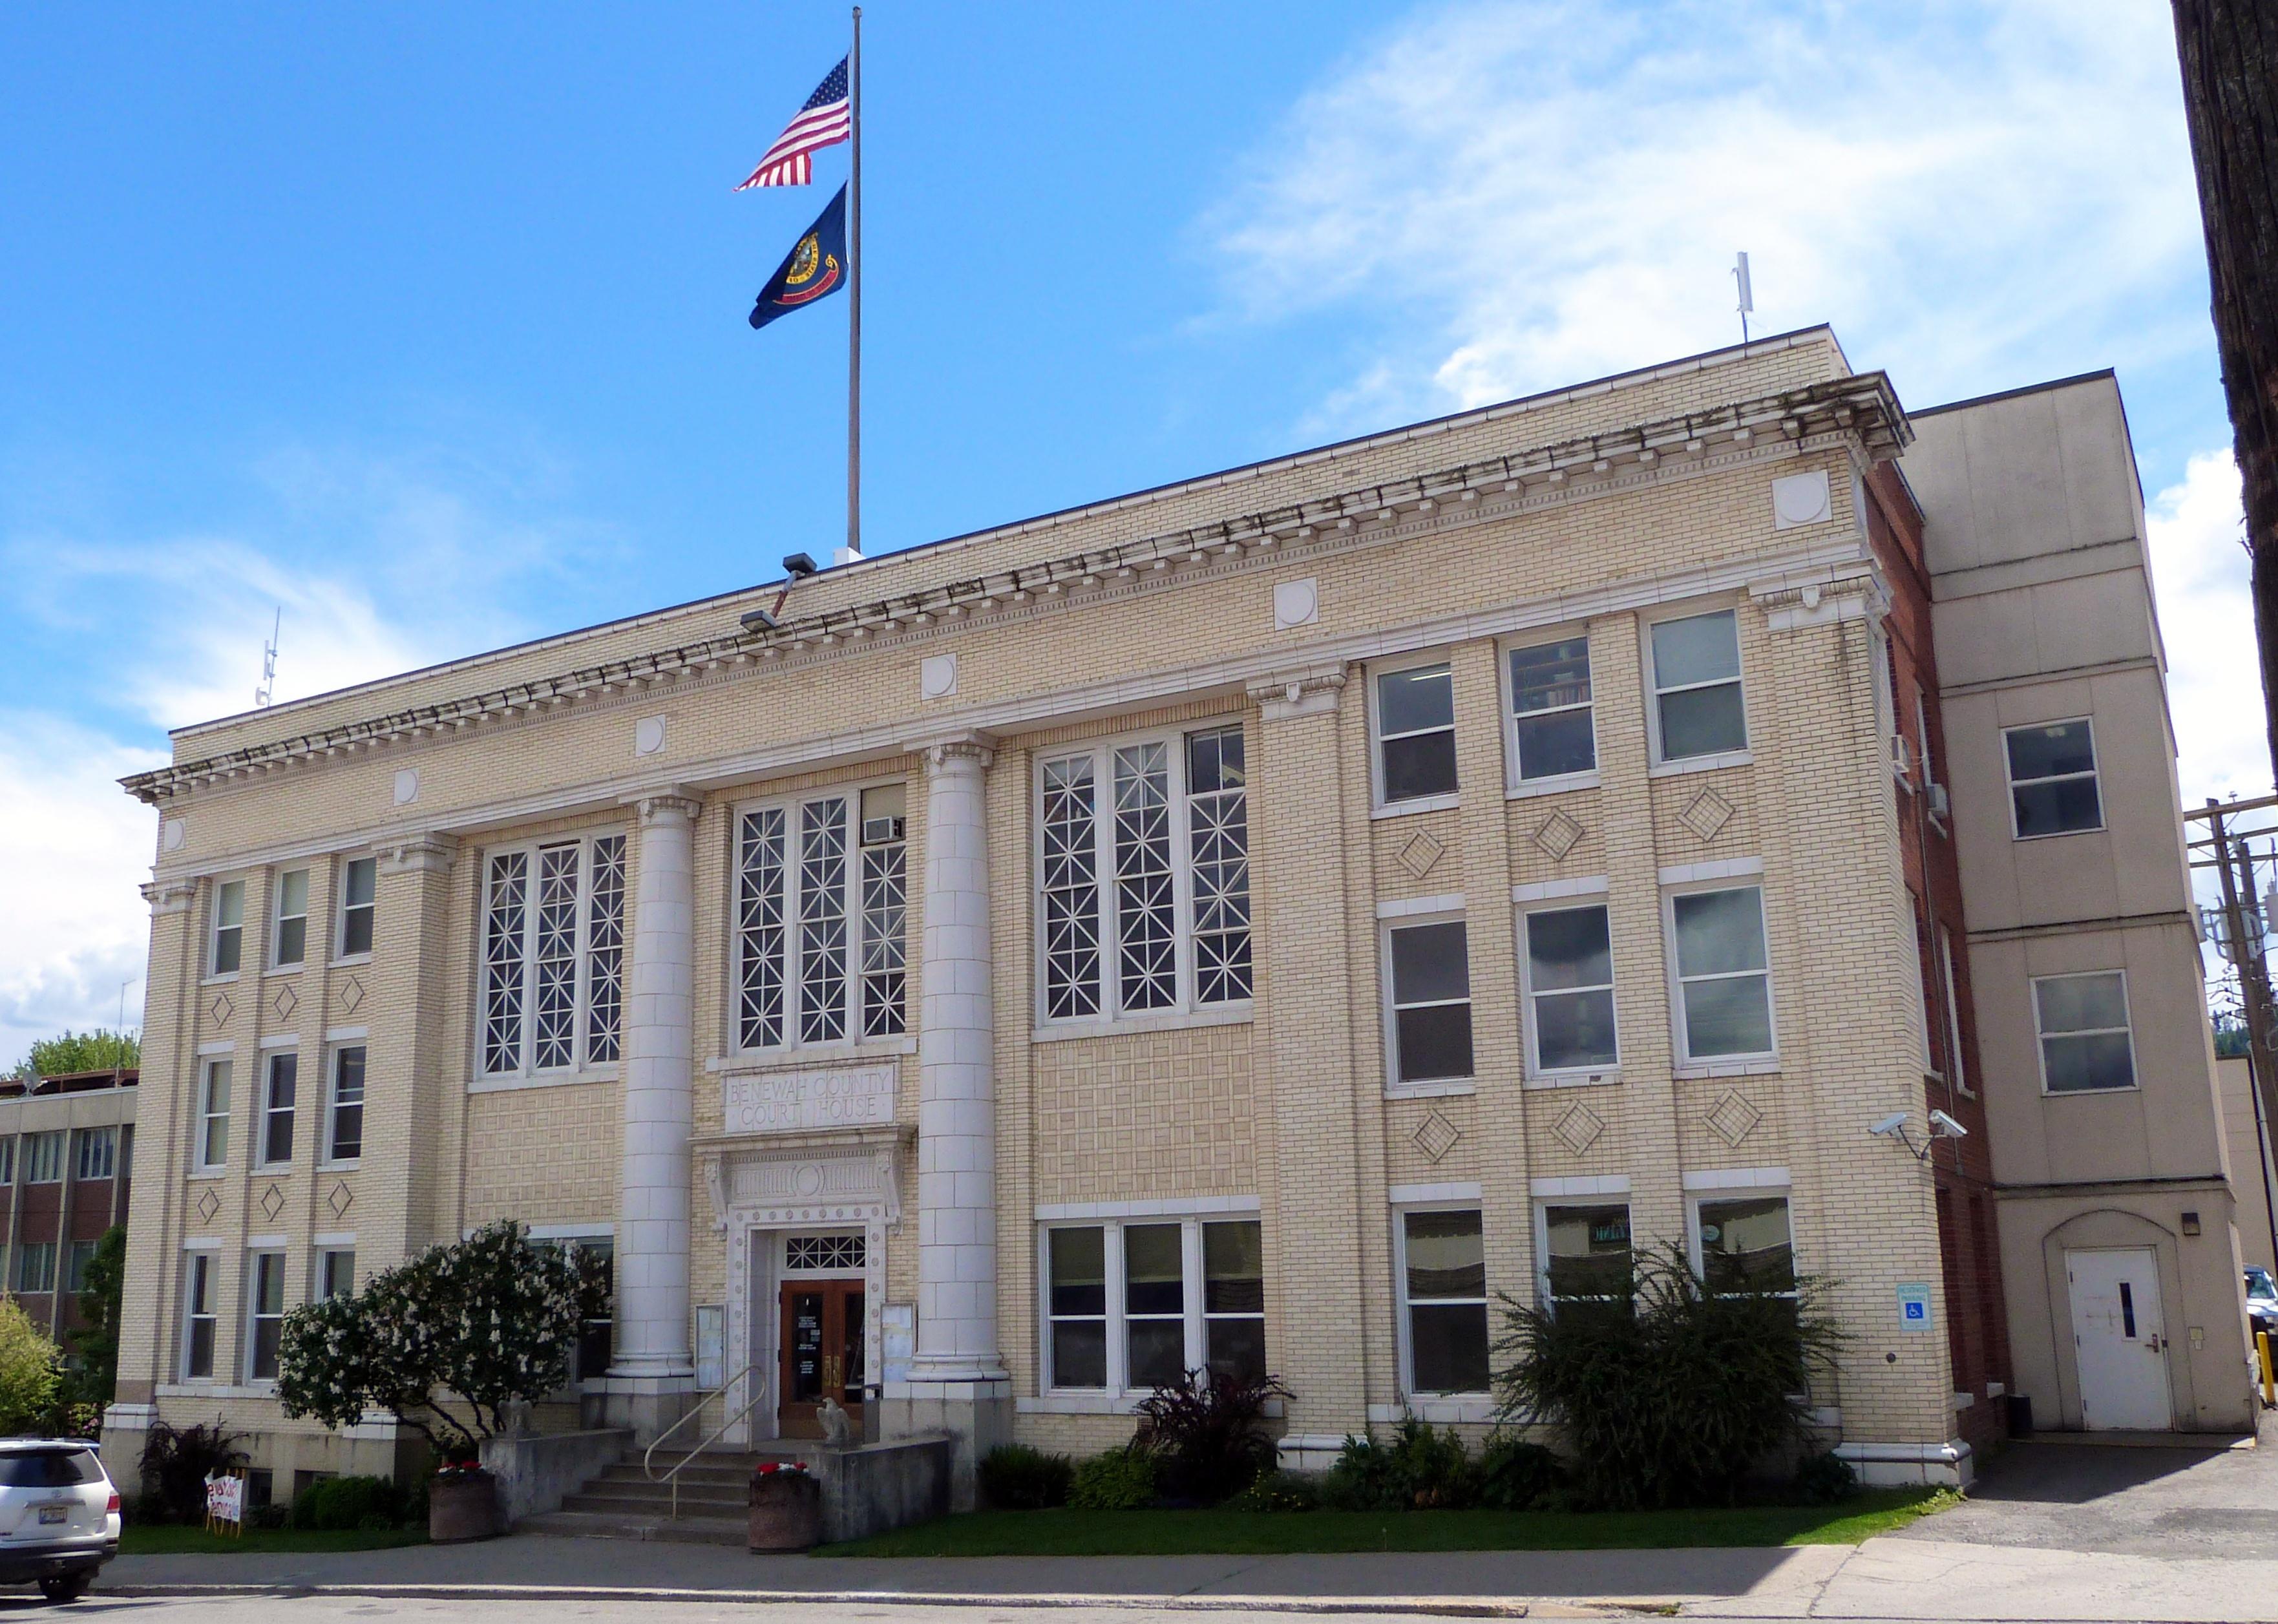
#10. Benewah County
– Population that is fully vaccinated: 54.1% (5,028 fully vaccinated)
— 4.4% lower vaccination rate than Idaho
– Cumulative deaths per 100k: 452 (42 total deaths)
— 54.8% more deaths per 100k residents than Idaho
– Cumulative cases per 100k: 28,737 (2,672 total cases)
— 2.7% more cases per 100k residents than Idaho

Jcarr29 // Wikimedia Commons
#9. Bonneville County
– Population that is fully vaccinated: 55.0% (65,489 fully vaccinated)
— 2.8% lower vaccination rate than Idaho
– Cumulative deaths per 100k: 248 (295 total deaths)
— 15.1% less deaths per 100k residents than Idaho
– Cumulative cases per 100k: 28,617 (34,072 total cases)
— 2.3% more cases per 100k residents than Idaho
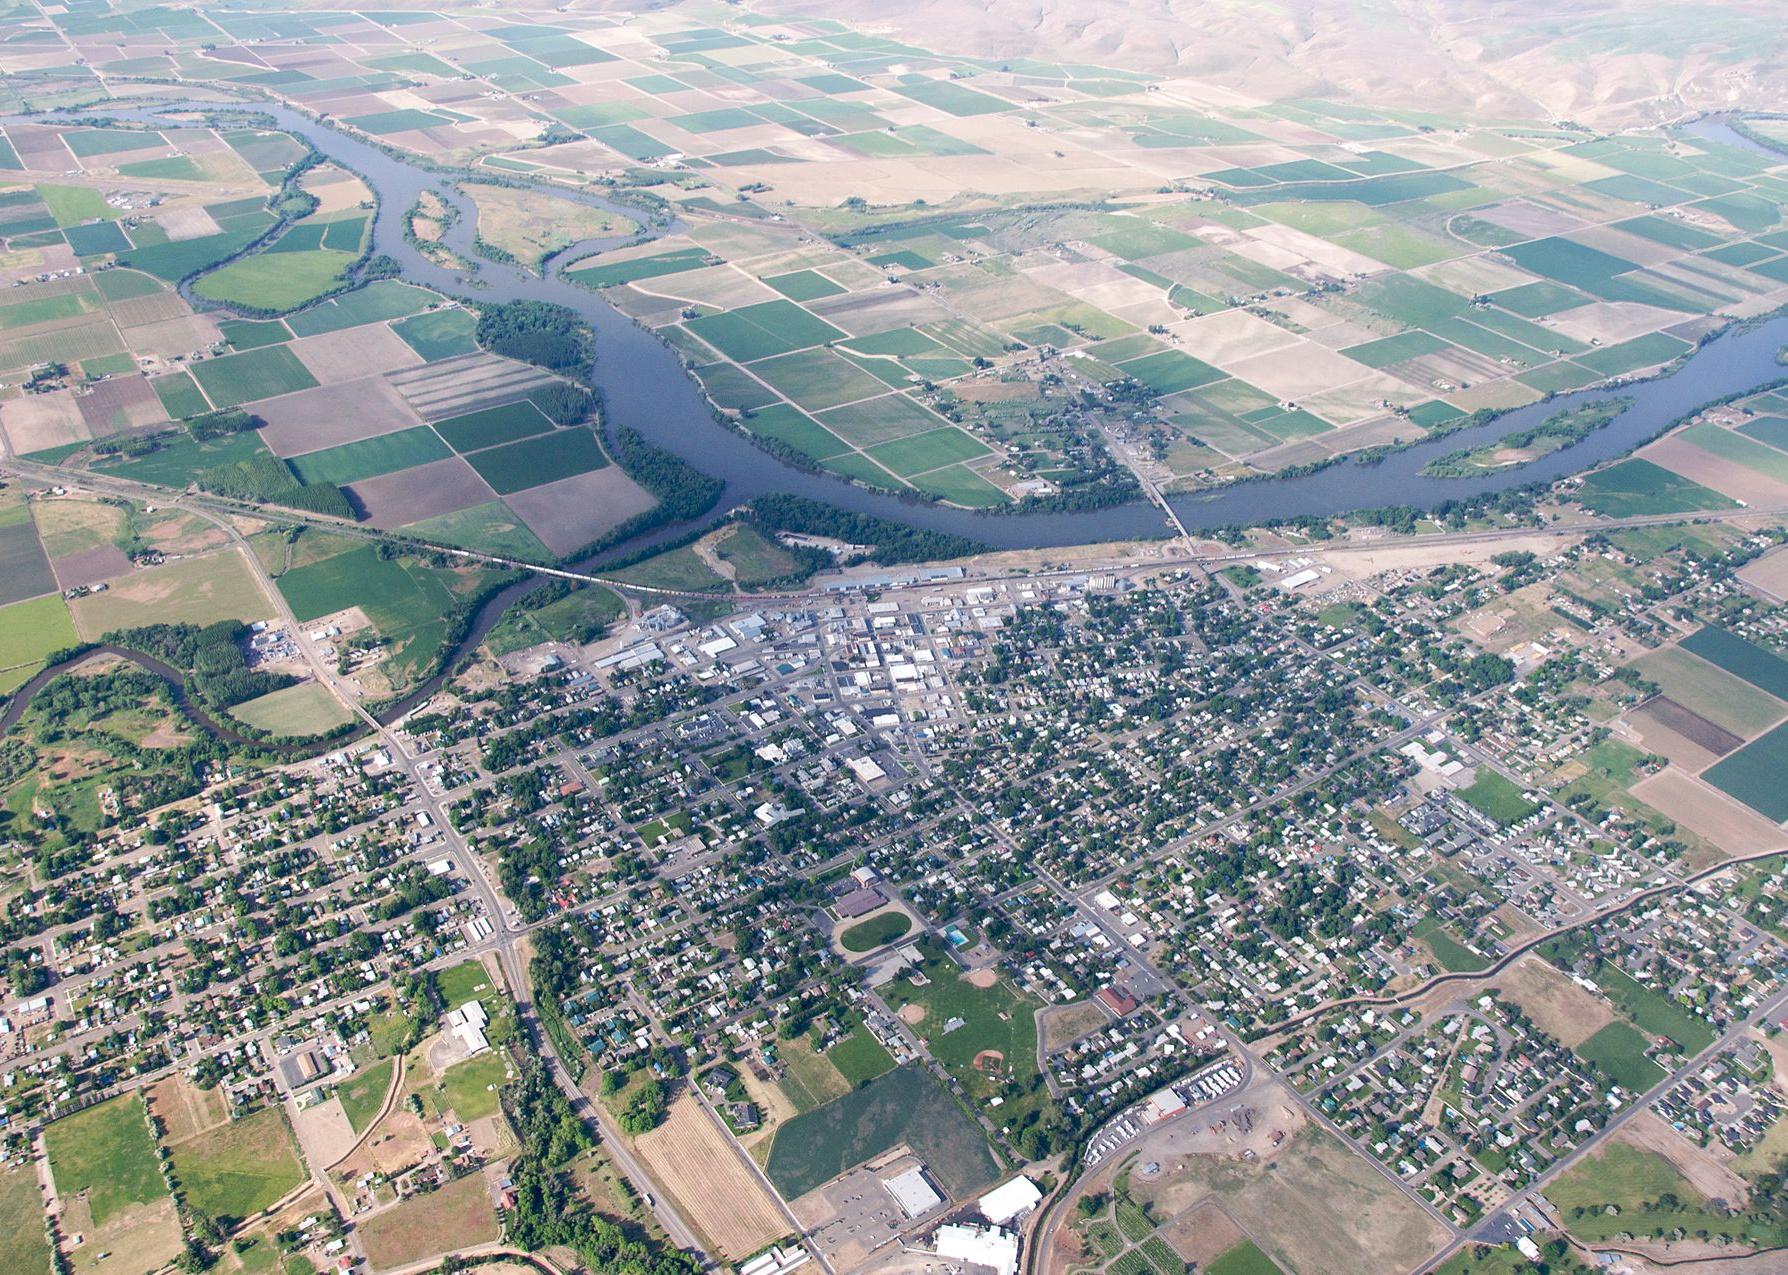
Ken Lund // Wikimedia Commons
#8. Madison County
– Population that is fully vaccinated: 56.3% (22,483 fully vaccinated)
— 0.5% lower vaccination rate than Idaho
– Cumulative deaths per 100k: 138 (55 total deaths)
— 52.7% less deaths per 100k residents than Idaho
– Cumulative cases per 100k: 33,743 (13,466 total cases)
— 20.6% more cases per 100k residents than Idaho

Dsdugan // Wikimedia Commons
#7. Nez Perce County
– Population that is fully vaccinated: 59.0% (23,840 fully vaccinated)
— 4.2% higher vaccination rate than Idaho
– Cumulative deaths per 100k: 386 (156 total deaths)
— 32.2% more deaths per 100k residents than Idaho
– Cumulative cases per 100k: 24,911 (10,066 total cases)
— 10.9% less cases per 100k residents than Idaho

Larry D. Moore // Wikimedia Commons
#6. Elmore County
– Population that is fully vaccinated: 59.8% (16,457 fully vaccinated)
— 5.7% higher vaccination rate than Idaho
– Cumulative deaths per 100k: 258 (71 total deaths)
— 11.6% less deaths per 100k residents than Idaho
– Cumulative cases per 100k: 30,962 (8,518 total cases)
— 10.7% more cases per 100k residents than Idaho

Apstrinka // Wikimedia Commons
#5. Latah County
– Population that is fully vaccinated: 61.6% (24,692 fully vaccinated)
— 8.8% higher vaccination rate than Idaho
– Cumulative deaths per 100k: 135 (54 total deaths)
— 53.8% less deaths per 100k residents than Idaho
– Cumulative cases per 100k: 18,734 (7,514 total cases)
— 33.0% less cases per 100k residents than Idaho

Karthikc123 // Wikimedia Commons
#4. Valley County
– Population that is fully vaccinated: 64.0% (7,291 fully vaccinated)
— 13.1% higher vaccination rate than Idaho
– Cumulative deaths per 100k: 149 (17 total deaths)
— 49.0% less deaths per 100k residents than Idaho
– Cumulative cases per 100k: 26,361 (3,003 total cases)
— 5.8% less cases per 100k residents than Idaho

Lowjumpingfrog // Wikimedia Commons
#3. Teton County
– Population that is fully vaccinated: 64.8% (7,865 fully vaccinated)
— 14.5% higher vaccination rate than Idaho
– Cumulative deaths per 100k: 74 (9 total deaths)
— 74.7% less deaths per 100k residents than Idaho
– Cumulative cases per 100k: 23,571 (2,862 total cases)
— 15.7% less cases per 100k residents than Idaho

Charles Knowles // Shutterstock
#2. Ada County
– Population that is fully vaccinated: 66.6% (320,552 fully vaccinated)
— 17.7% higher vaccination rate than Idaho
– Cumulative deaths per 100k: 226 (1,088 total deaths)
— 22.6% less deaths per 100k residents than Idaho
– Cumulative cases per 100k: 31,909 (153,670 total cases)
— 14.1% more cases per 100k residents than Idaho

Greg L. Wright // Wikimedia Commons
#1. Blaine County
– Population that is fully vaccinated: 84.6% (19,468 fully vaccinated)
— 49.5% higher vaccination rate than Idaho
– Cumulative deaths per 100k: 139 (32 total deaths)
— 52.4% less deaths per 100k residents than Idaho
– Cumulative cases per 100k: 30,138 (6,938 total cases)
— 7.8% more cases per 100k residents than Idaho