Cities with the highest rate of motor vehicle fatalities
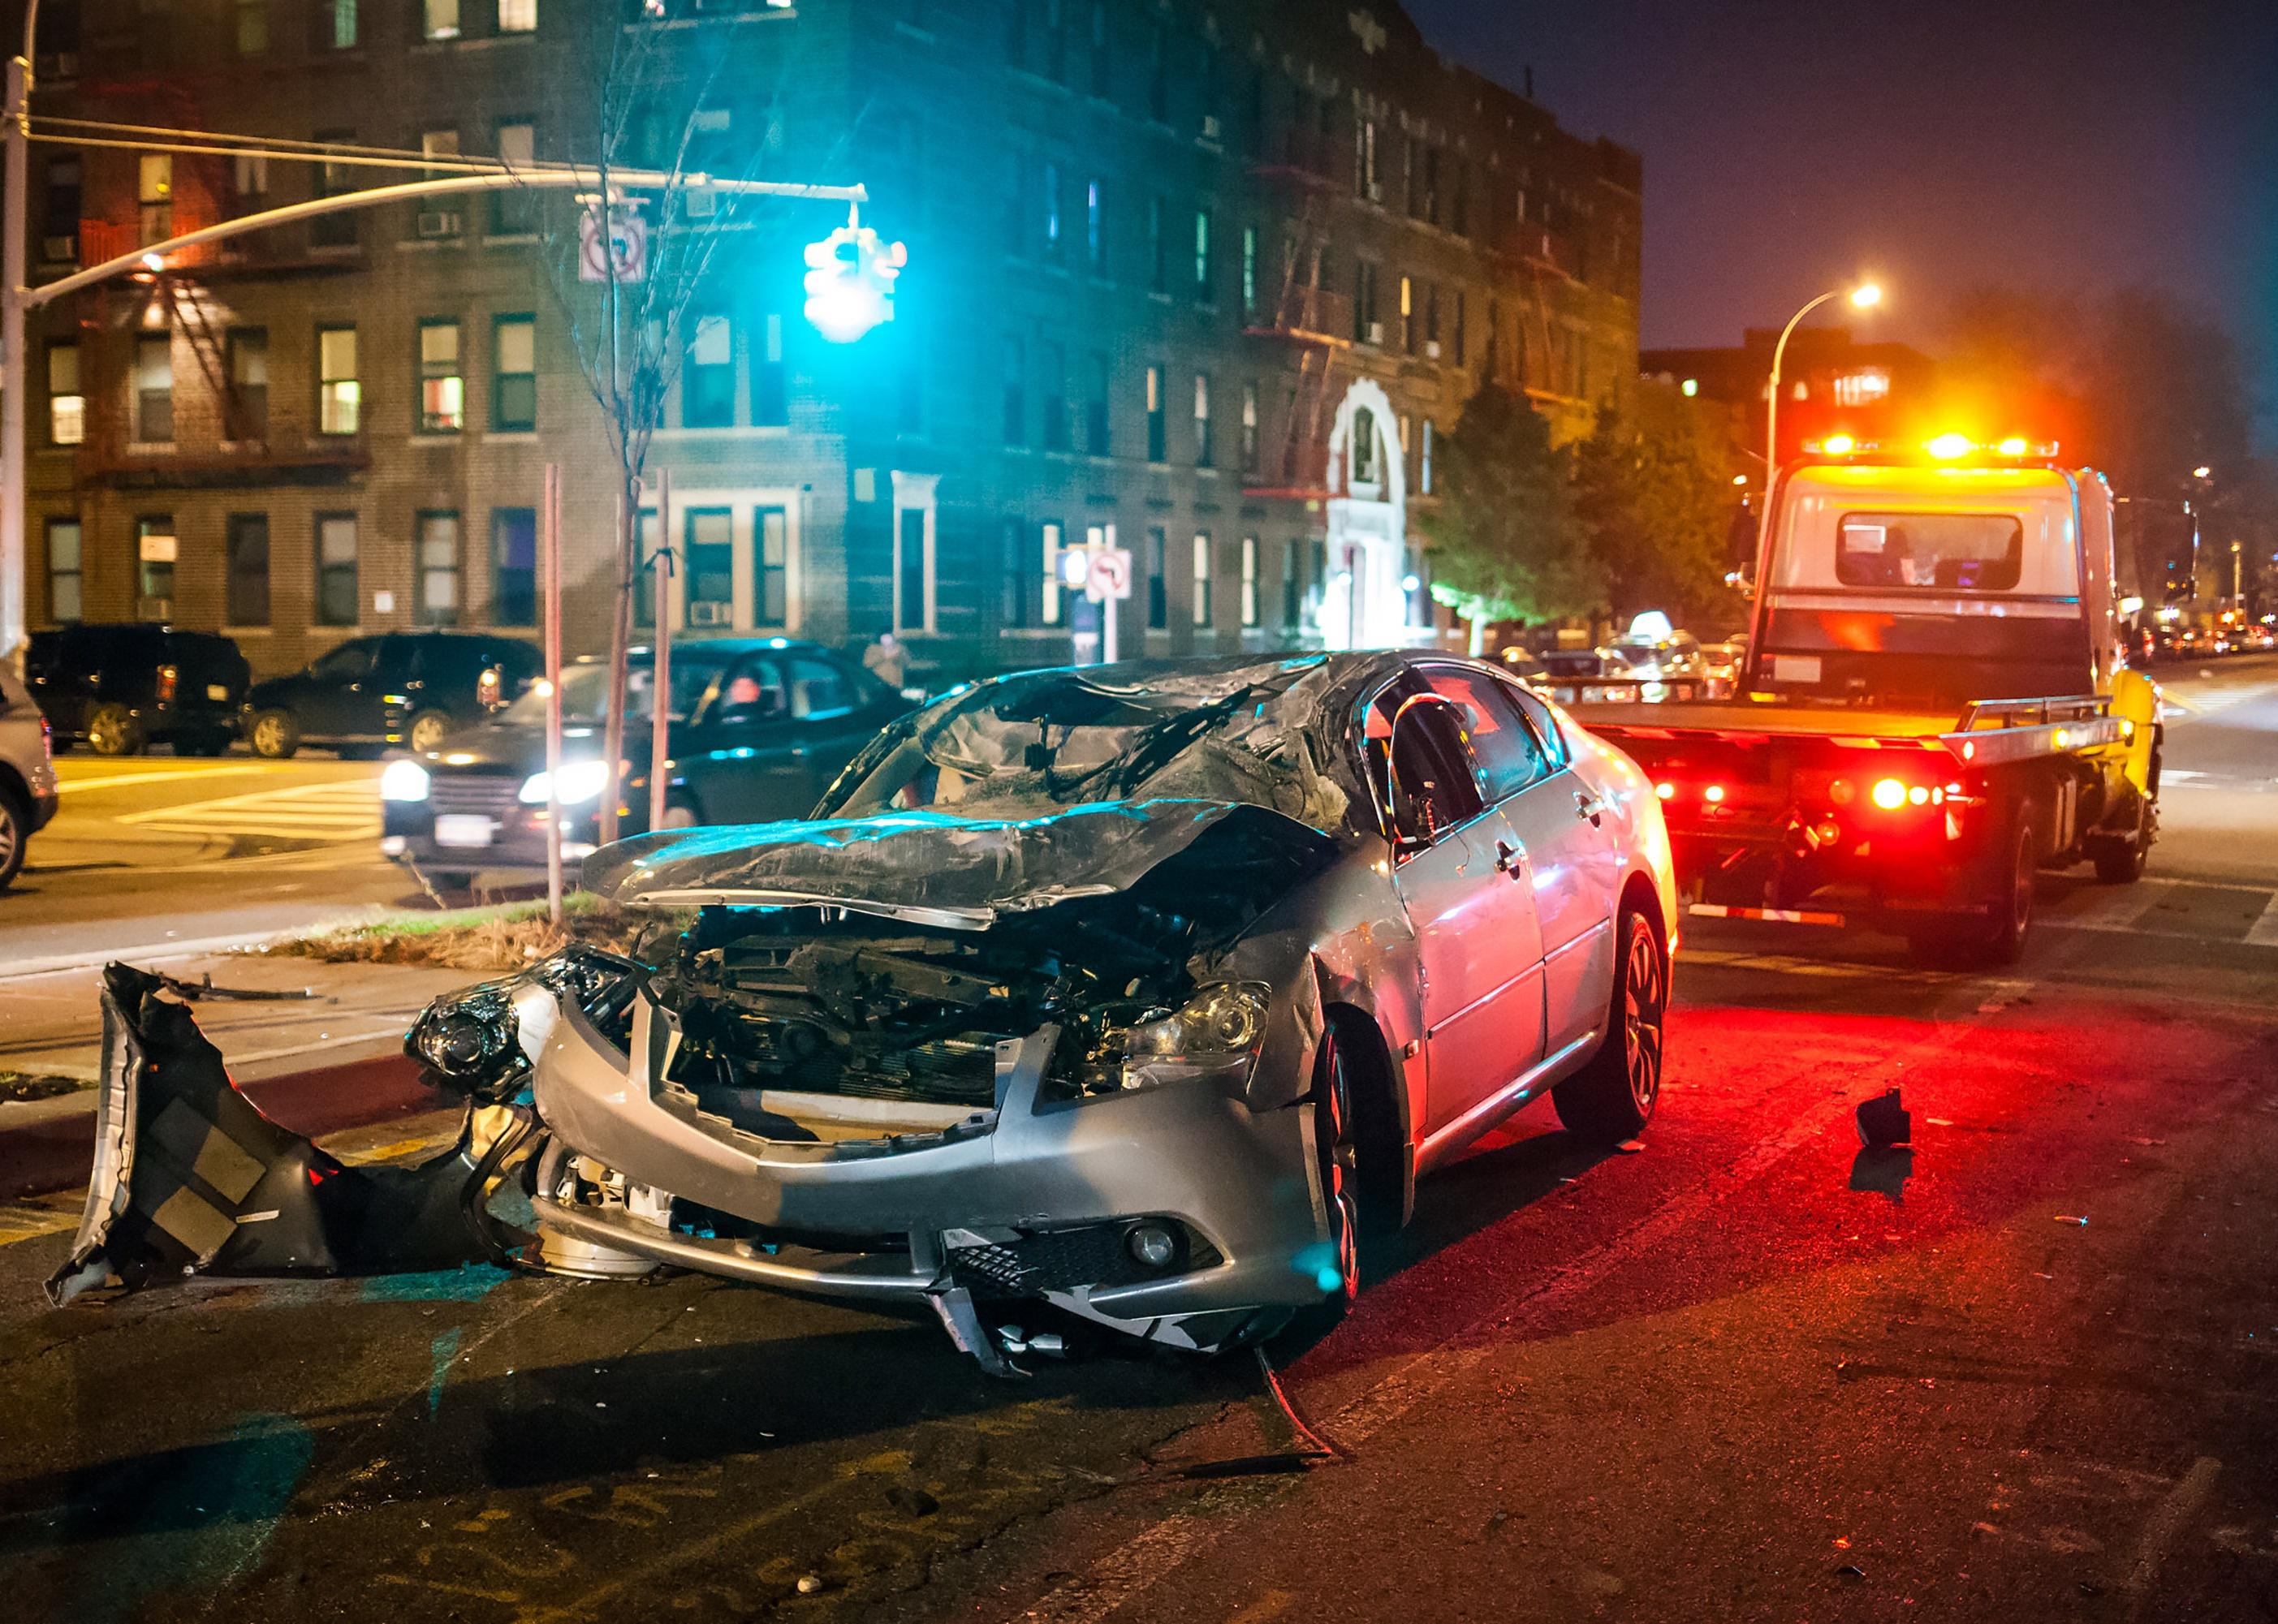
Photo Spirit // Shutterstock
Cities with the highest rate of motor vehicle fatalities
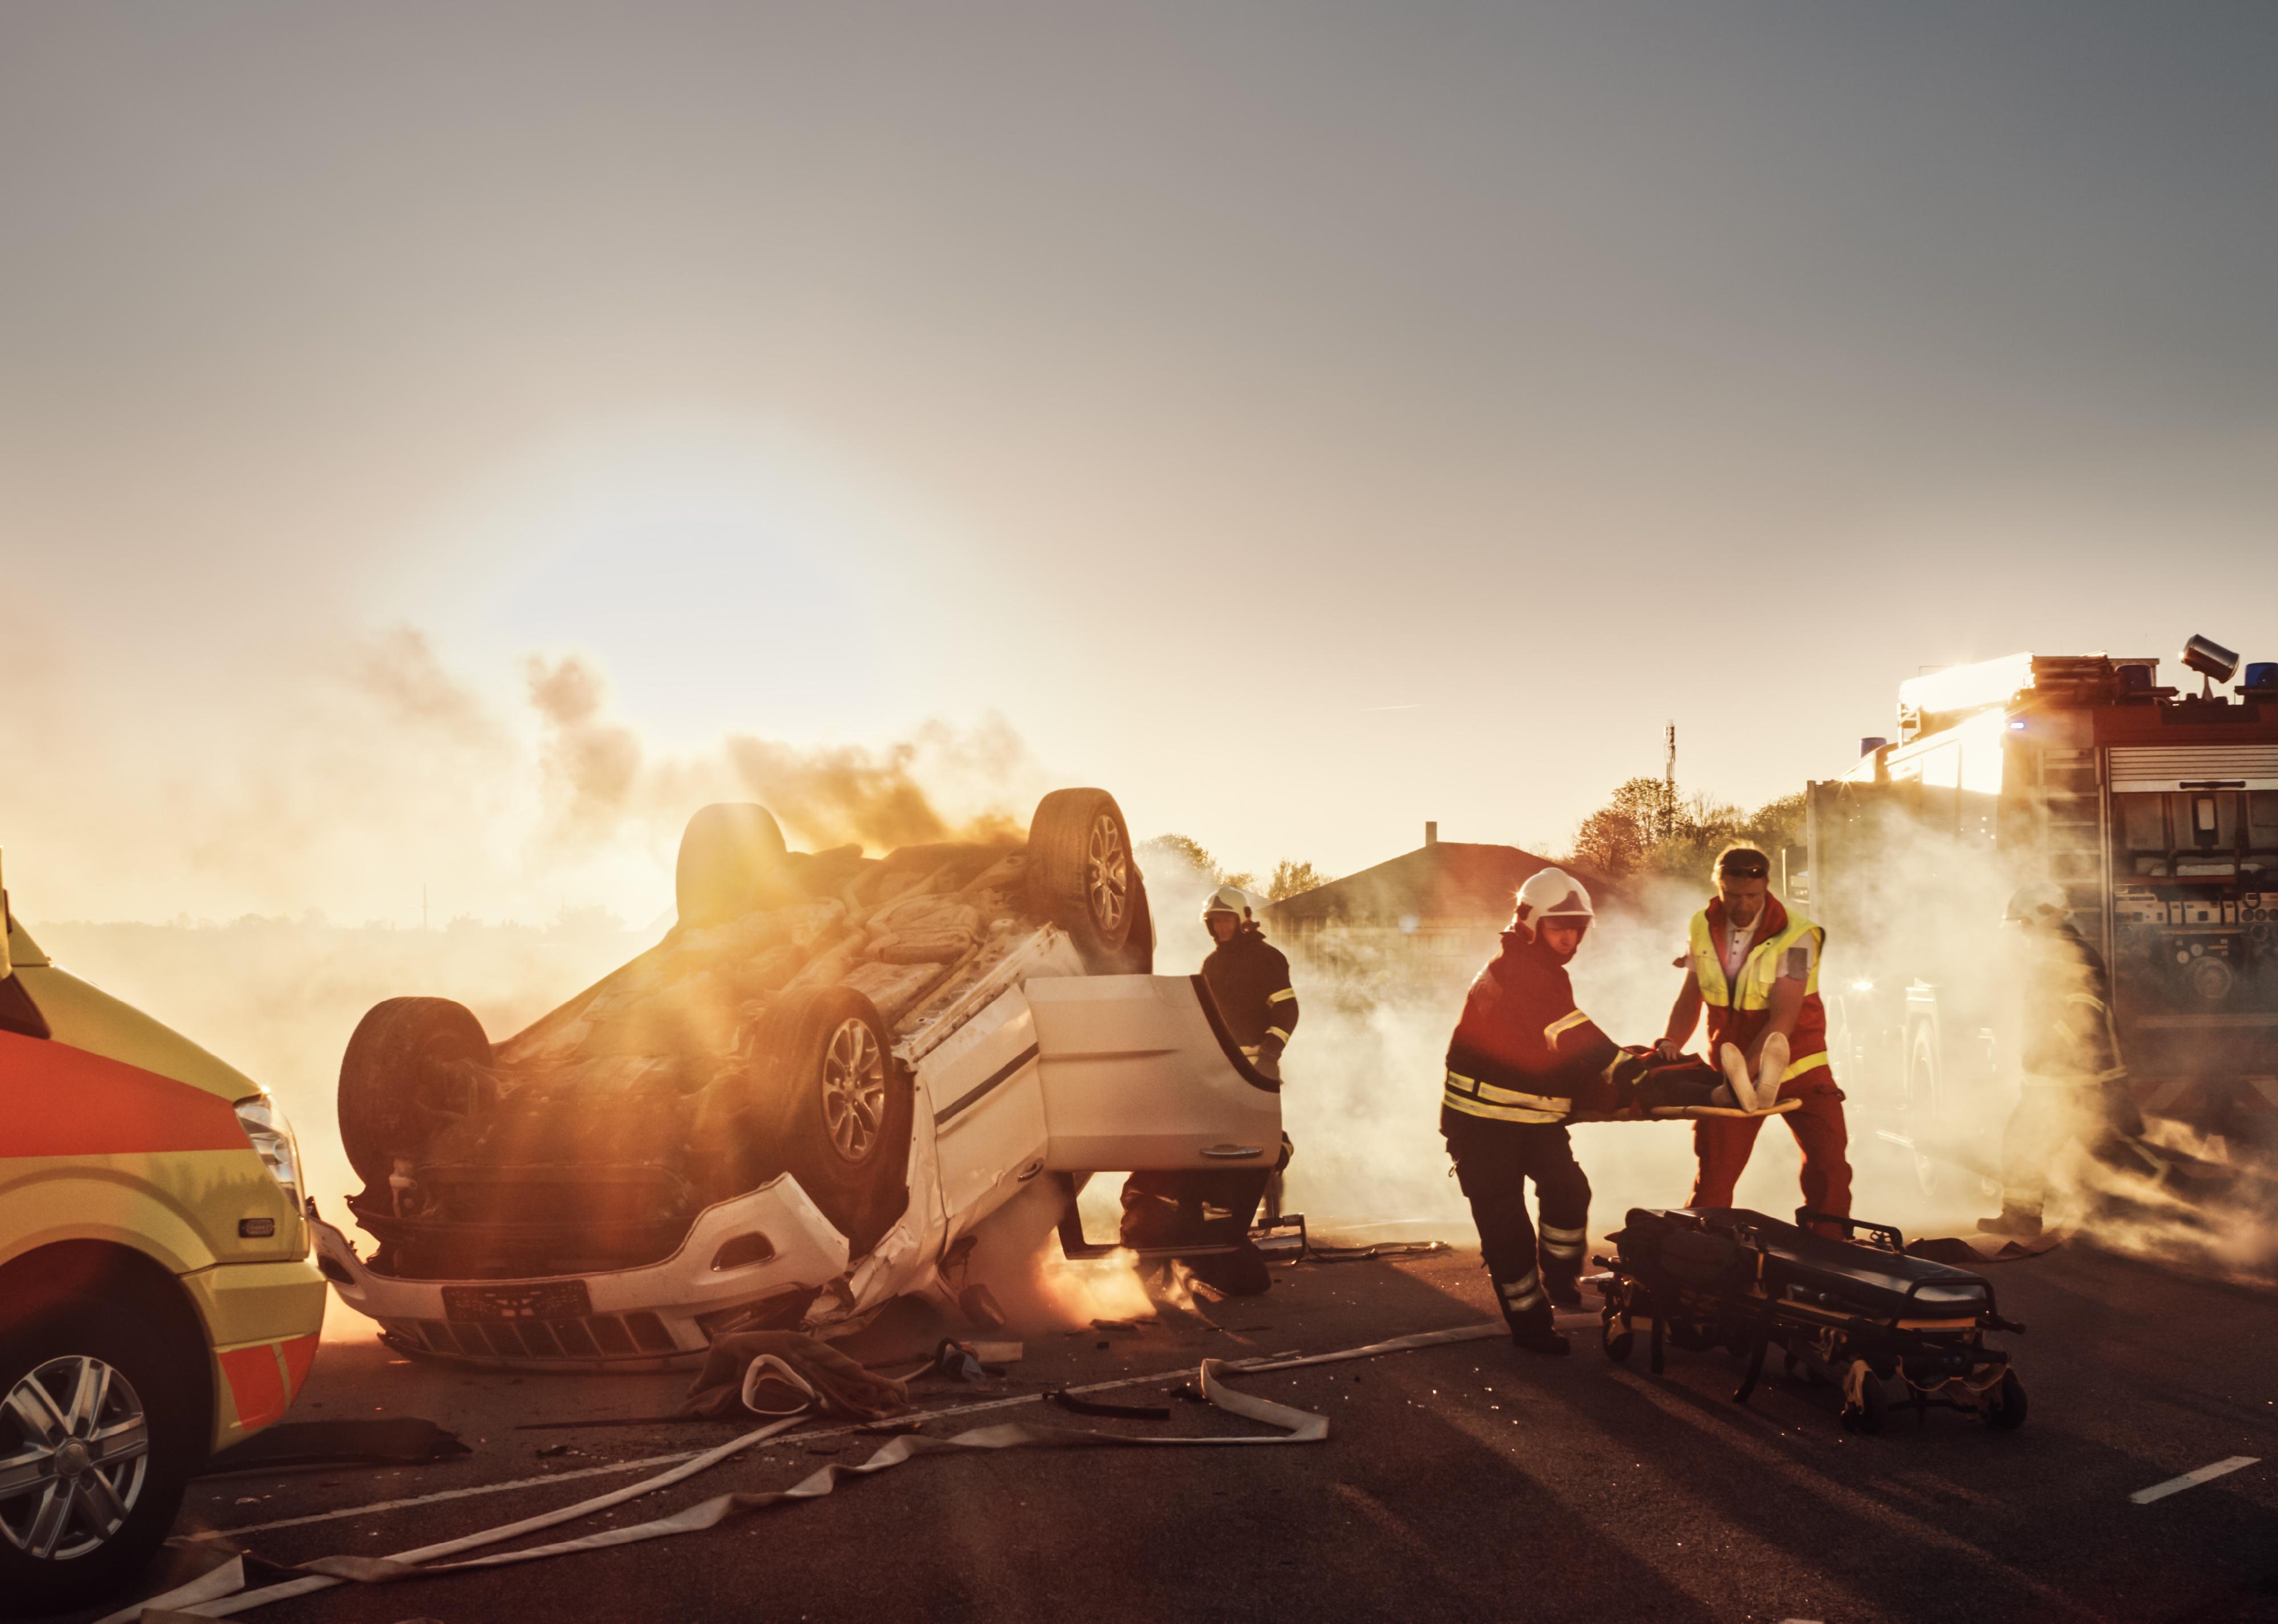
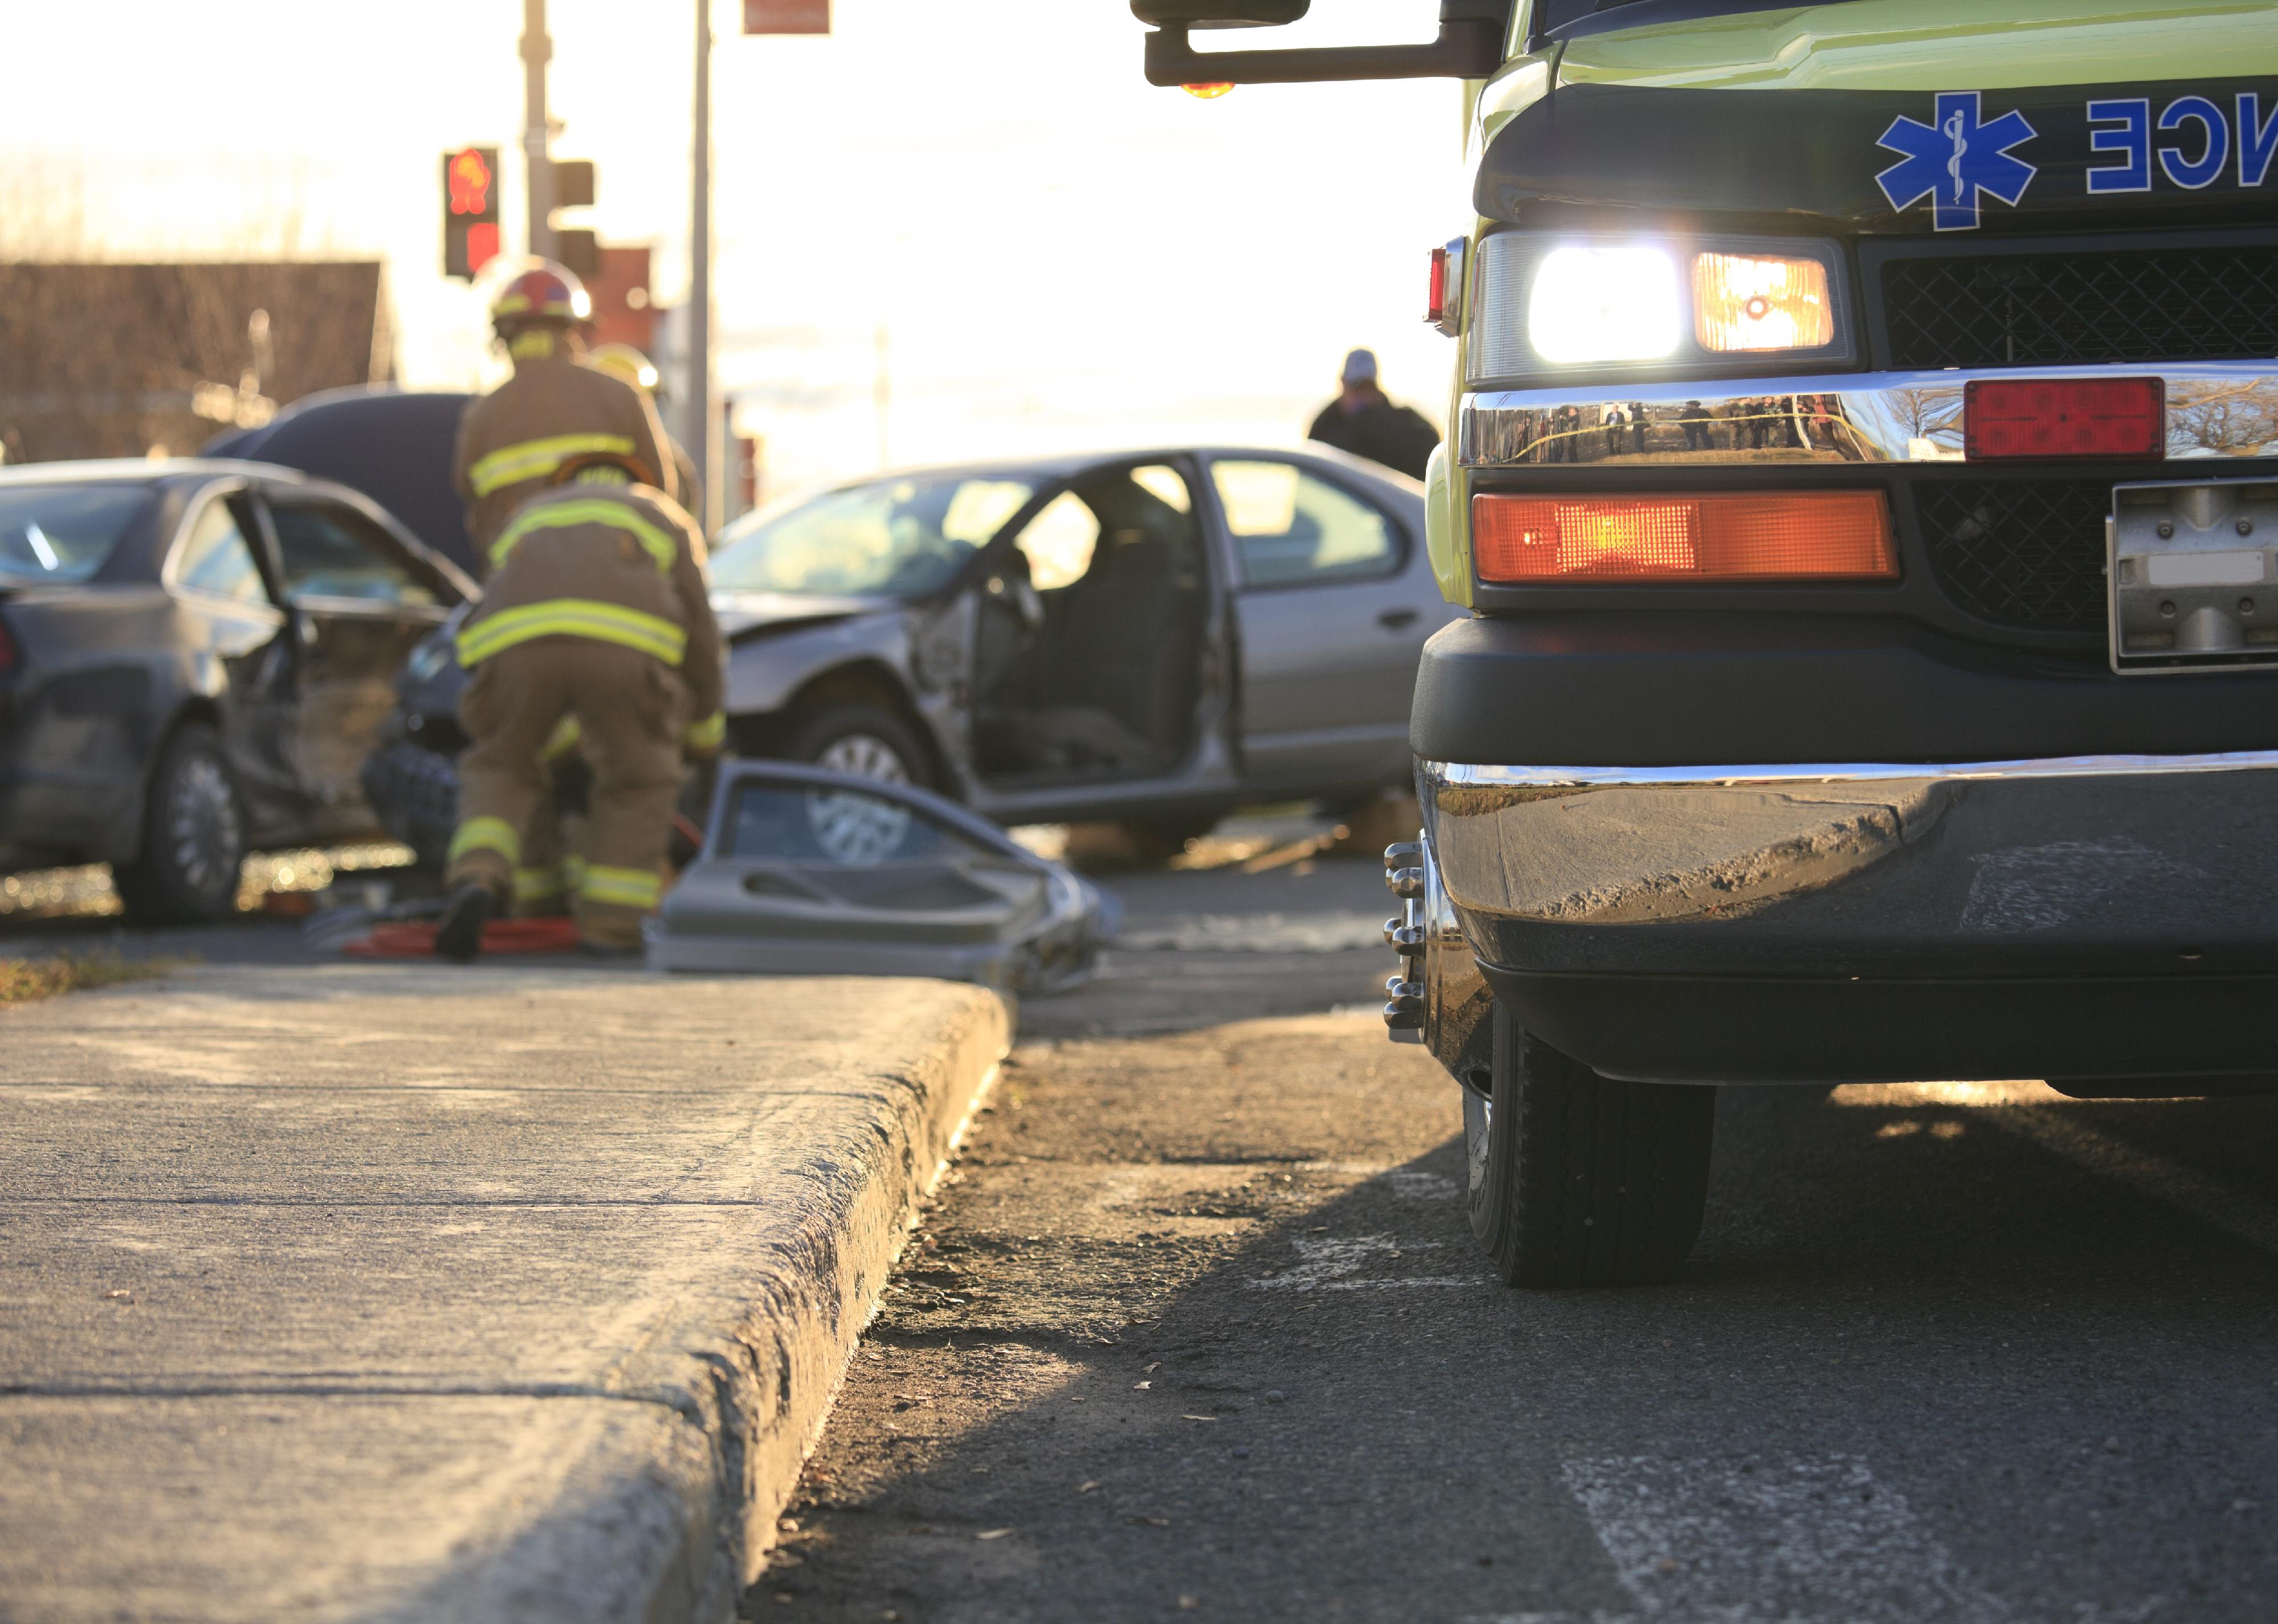
Car crash scene at night with emergency services around.
American roads haven’t been this deadly since 2007. And the situation isn’t getting any better; in fact, it may be getting worse. Across the U.S., nearly 39,000 people died in traffic crashes in 2020, amounting to about 11.78 deaths per 100,000 residents. Two in three deaths were vehicle occupants, while nearly 1 in 5 were pedestrians or cyclists.
Stacker used Department of Transportation data to rank the 50 cities with the highest motor vehicle crash fatality rates in 2020—the most recent data available—and broke ties by the total number of fatalities. Only cities with a population of at least 150,000 were considered.
When new data is released, it could show that roadways became even deadlier in 2021 and stayed similarly deadly in 2022.
The National Highway Traffic Safety Administration estimates that 2021 roadway fatalities grew by 10.5% from 2020, marking a 16-year high and the largest year-over-year increase since the agency began capturing data. Crashes involving more than one vehicle and those that occur on city roads as opposed to rural ones grew the most, according to those estimates. The projection also points to an increase in deaths on roadways during the day and for those who are older than 65.
The latest estimates reflect a public health crisis that officials at the traffic safety agency have called “urgent and preventable.” The biggest contributing factor to fatal car wrecks is the speed of the vehicle. In 2020, NHTSA recorded more than 11,000 deaths as a result of speeding.
Surveys also reveal that drivers admit they have increasingly taken part in risky driving behaviors in recent years. According to a AAA survey of drivers in 2021, 12% more drivers said they drove significantly faster than the speed limit, and roughly 24% more drivers admitted to driving under the influence compared with the year prior. The association condemned the growth in risky driving behaviors as “disturbing.”
Psychologists have also pointed to stress associated with the pandemic as a potential factor in the increase in traffic fatalities.
Many of the cities that rank among the most deadly according to 2020 data are located in the southern U.S. Read on to see where your city ranks on this list.
You may also like: How alcohol-related deaths have changed in every state over the past two decades
![]()
SKT Studio // Shutterstock
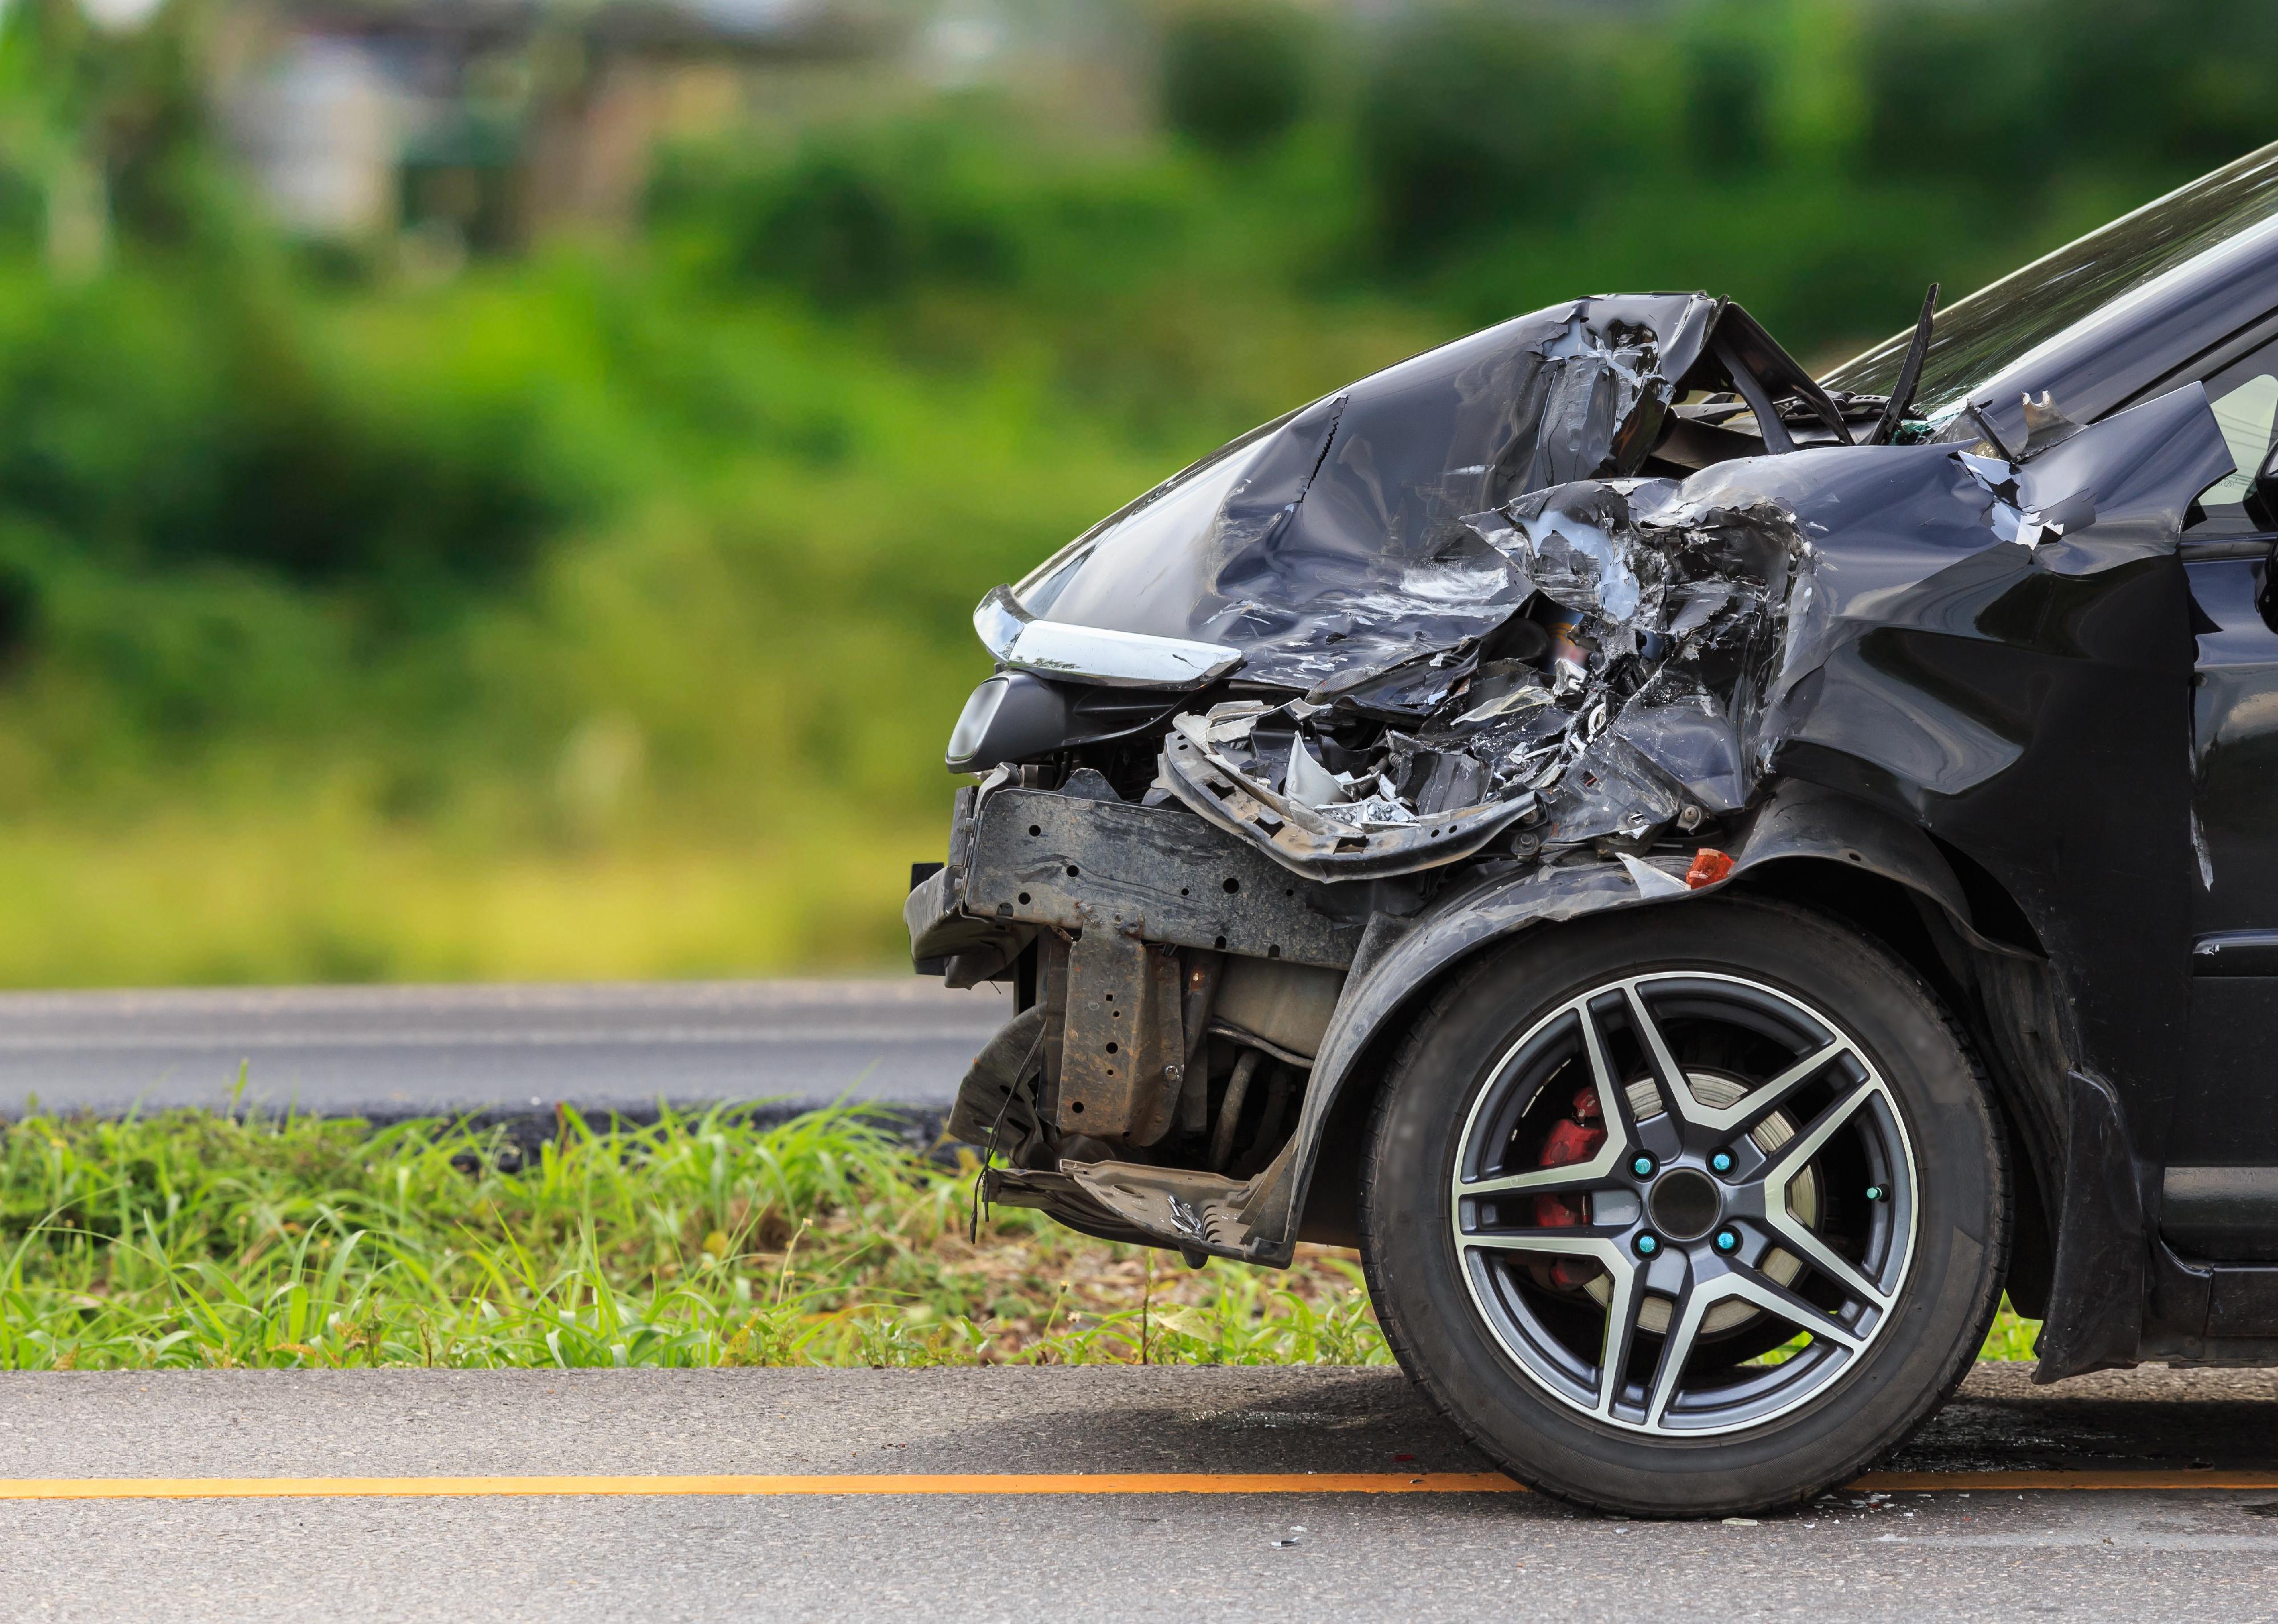
#50. Oklahoma City
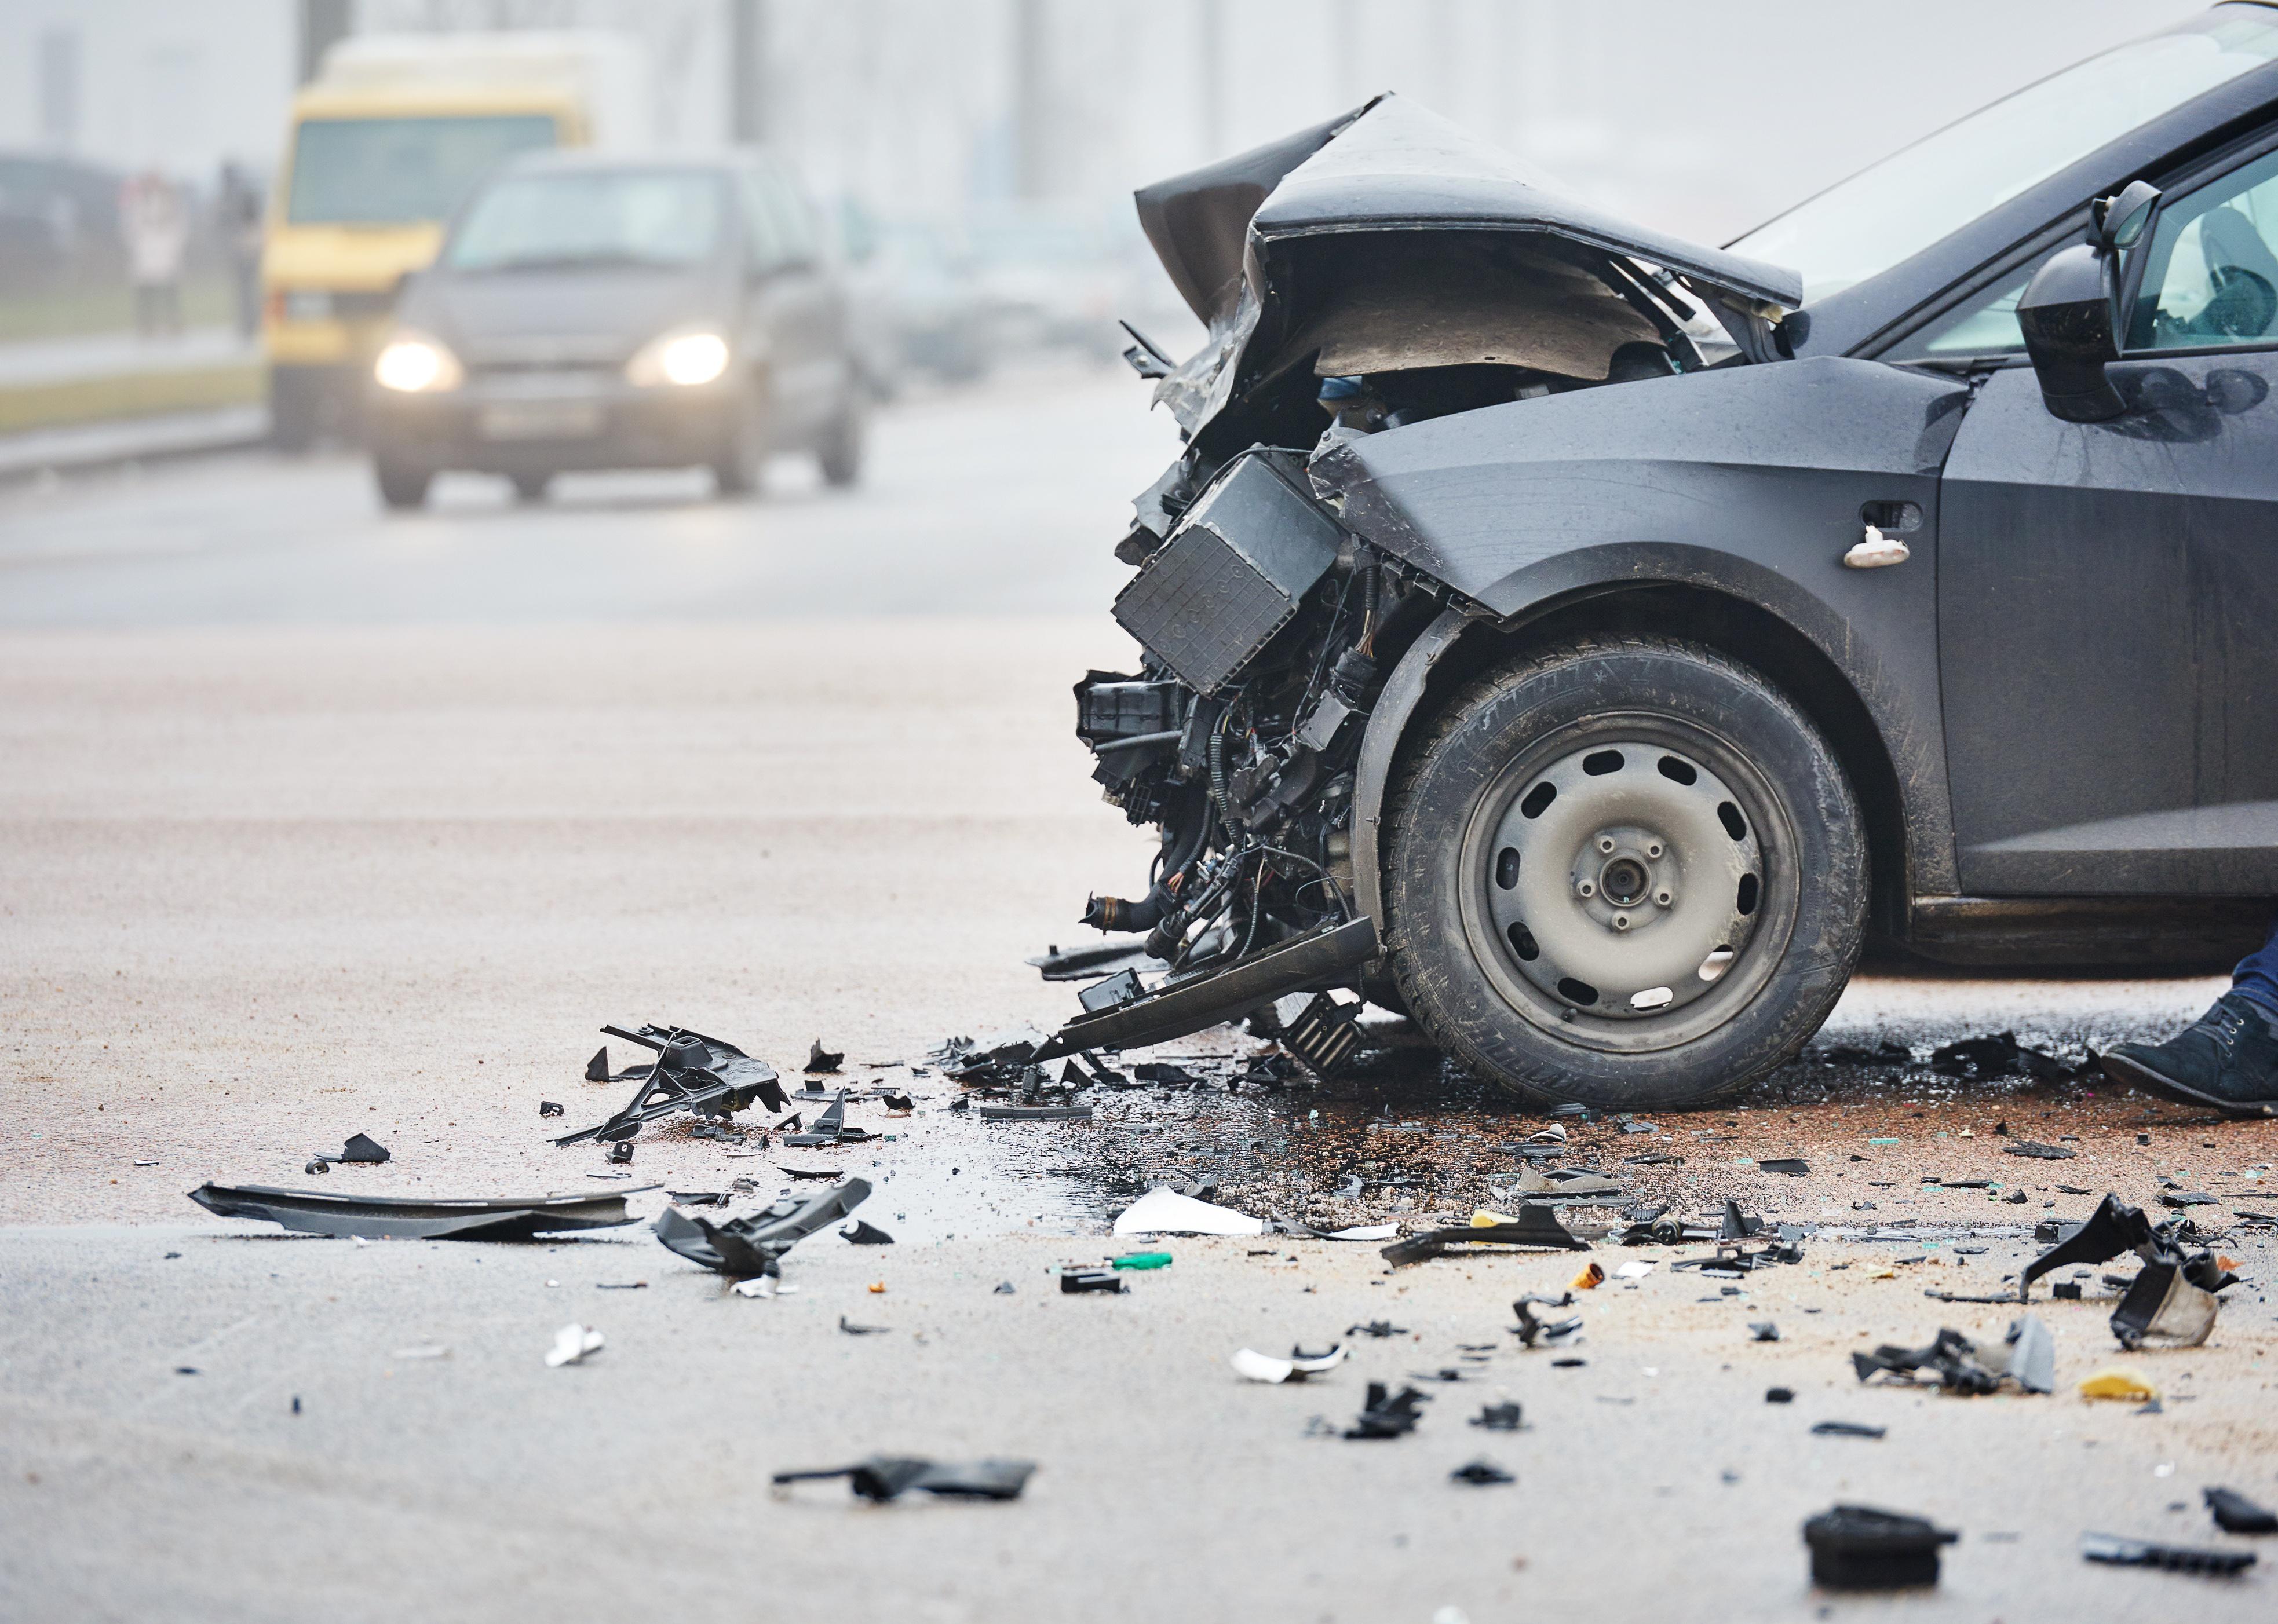
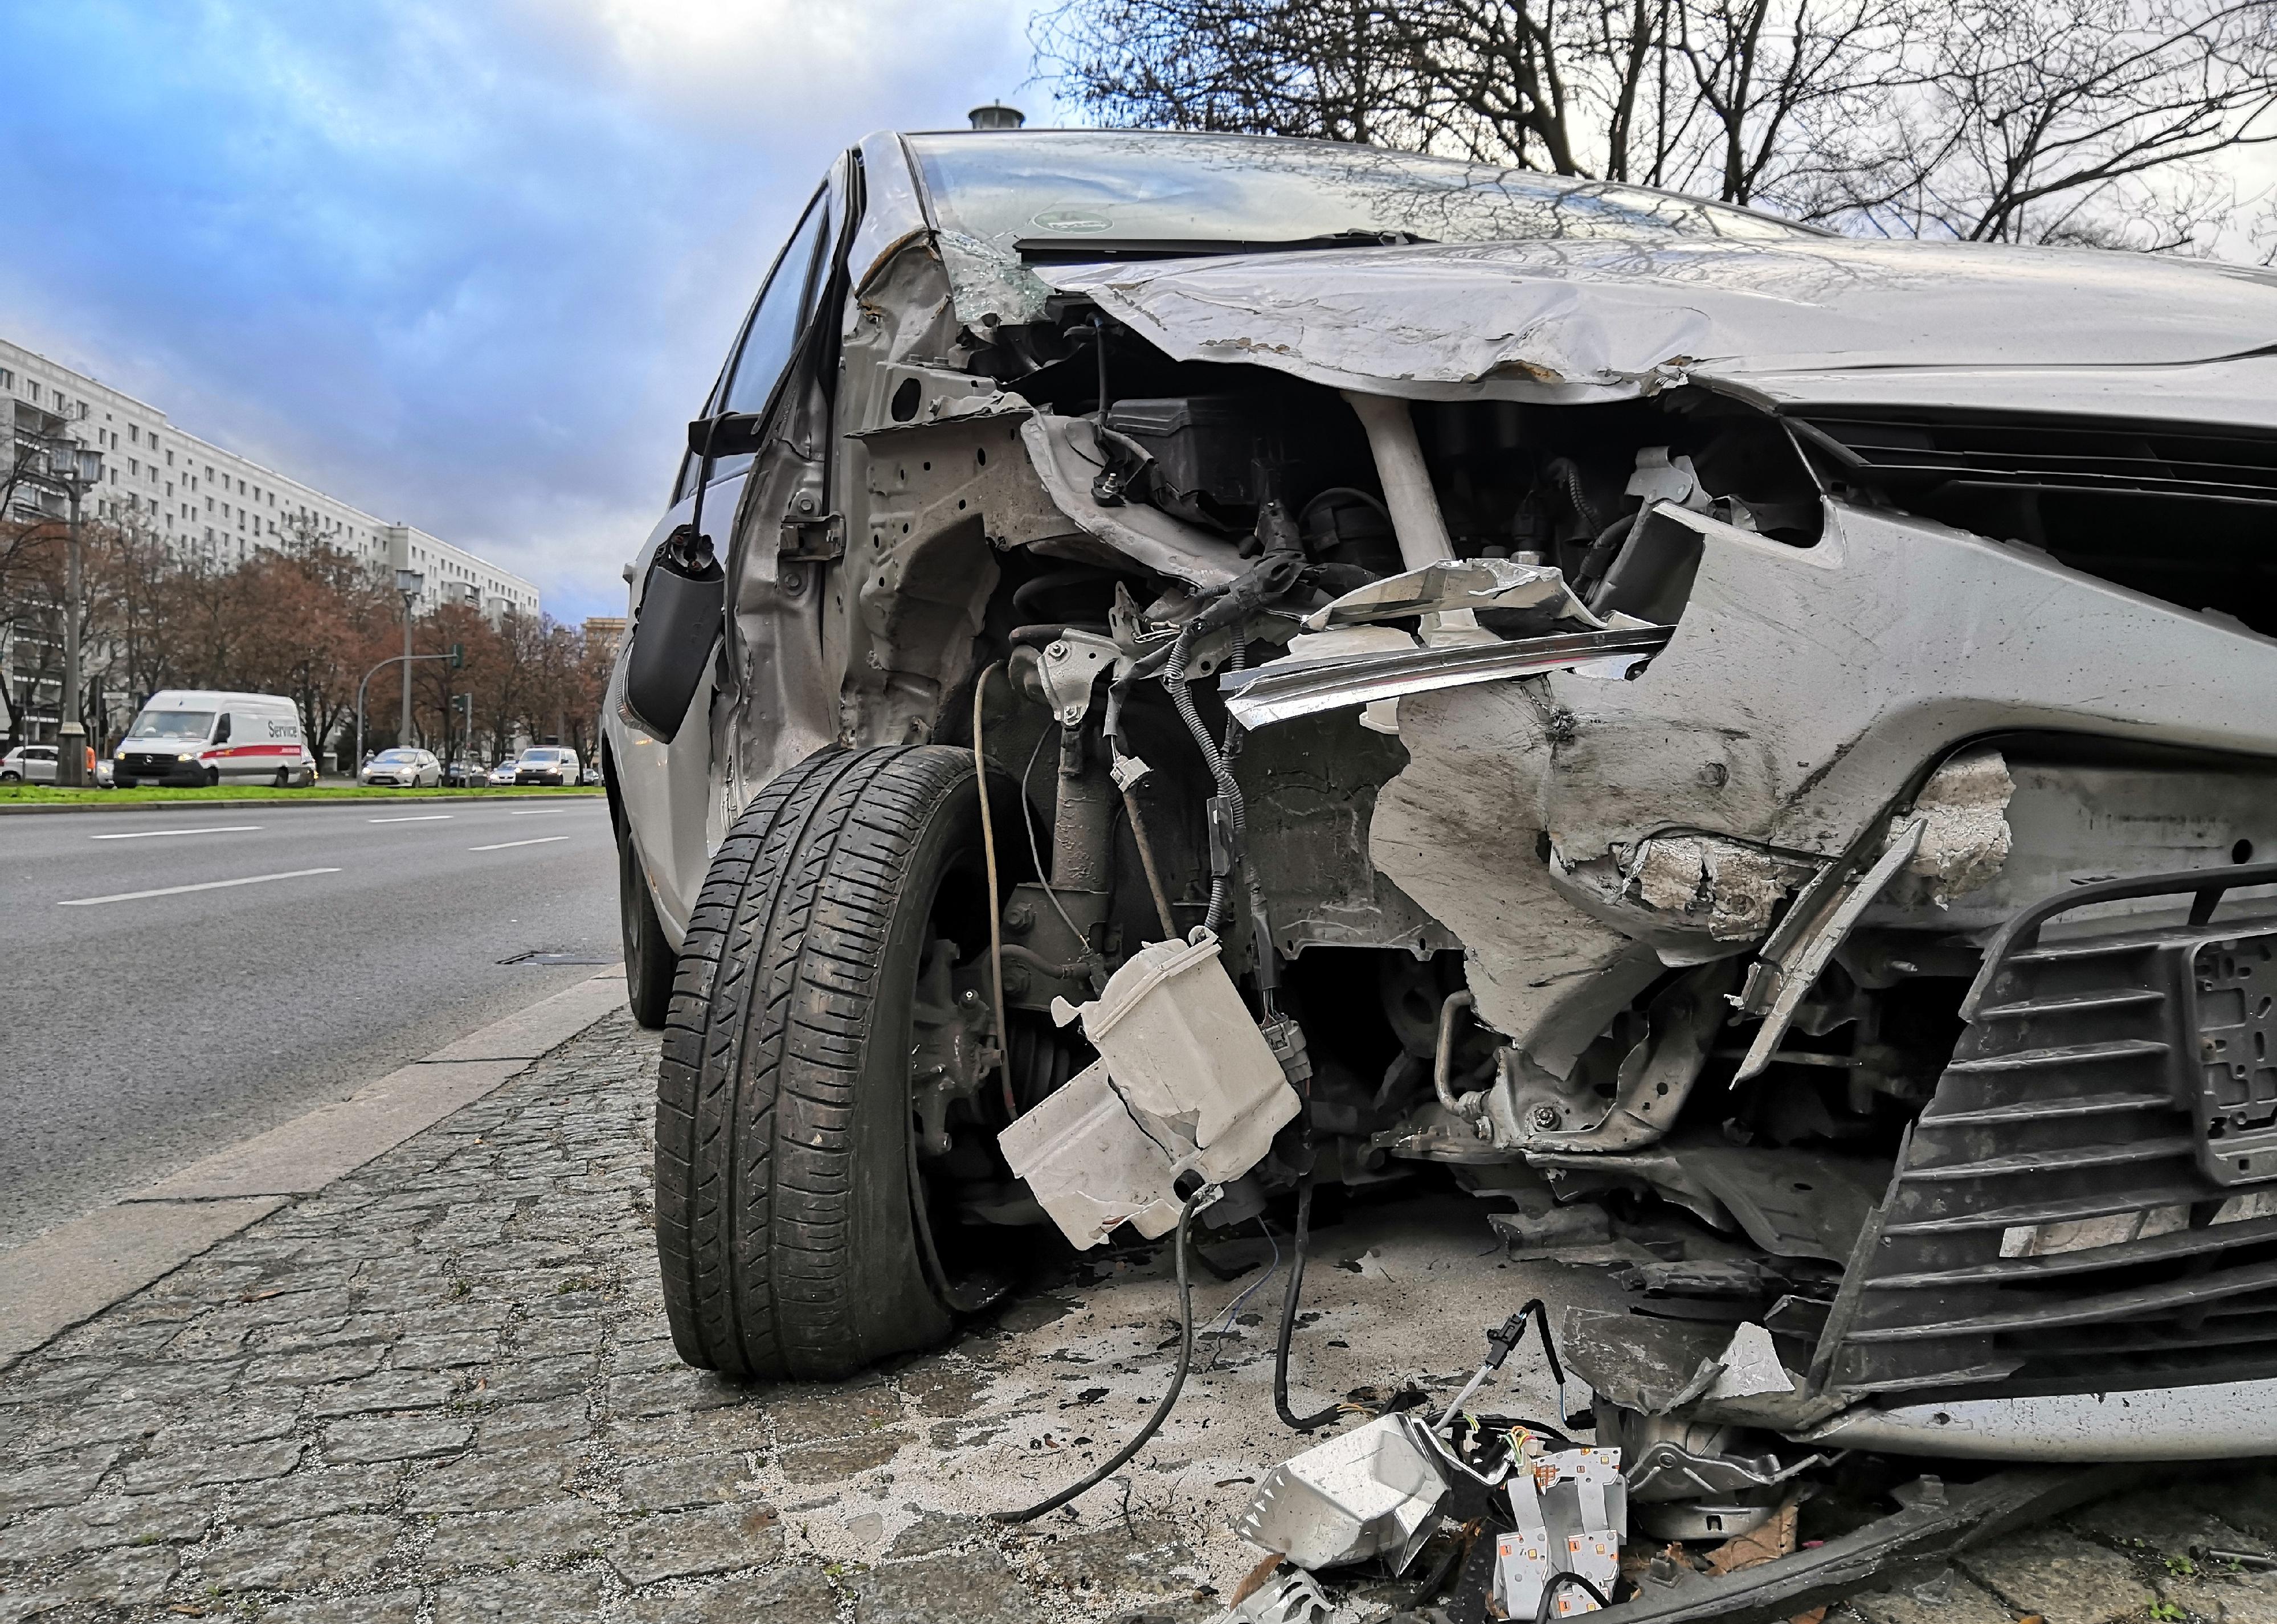
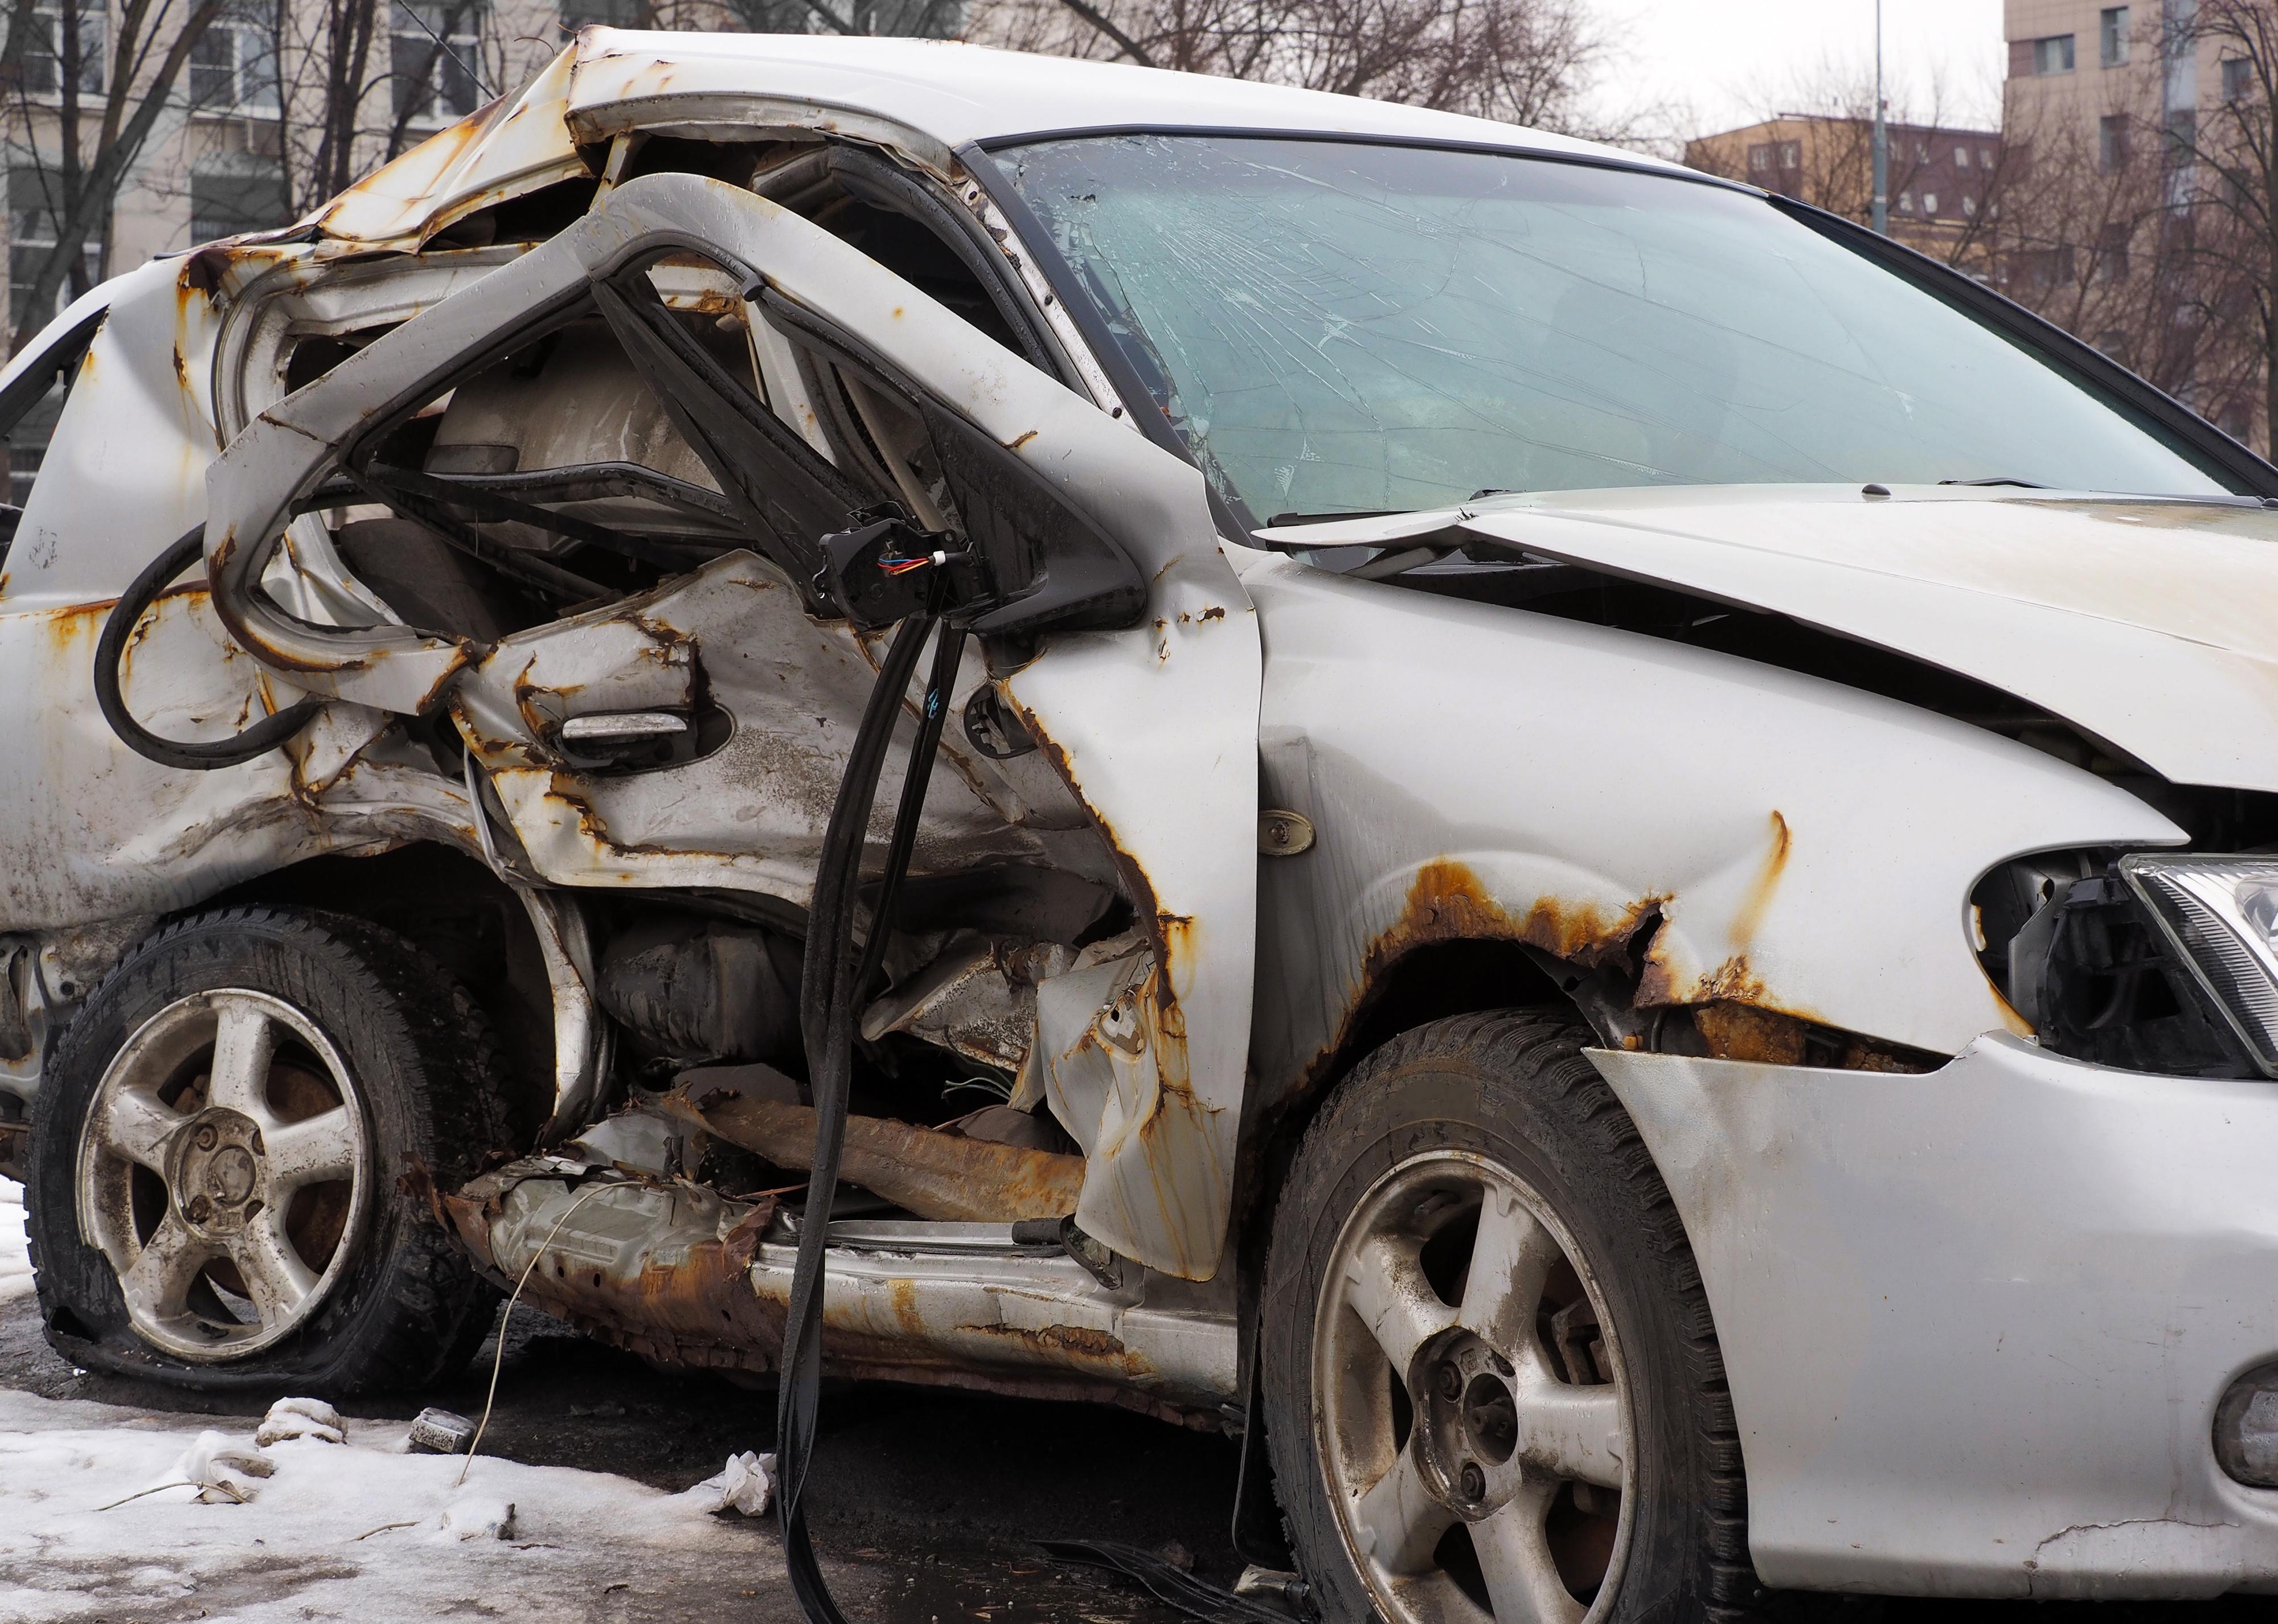
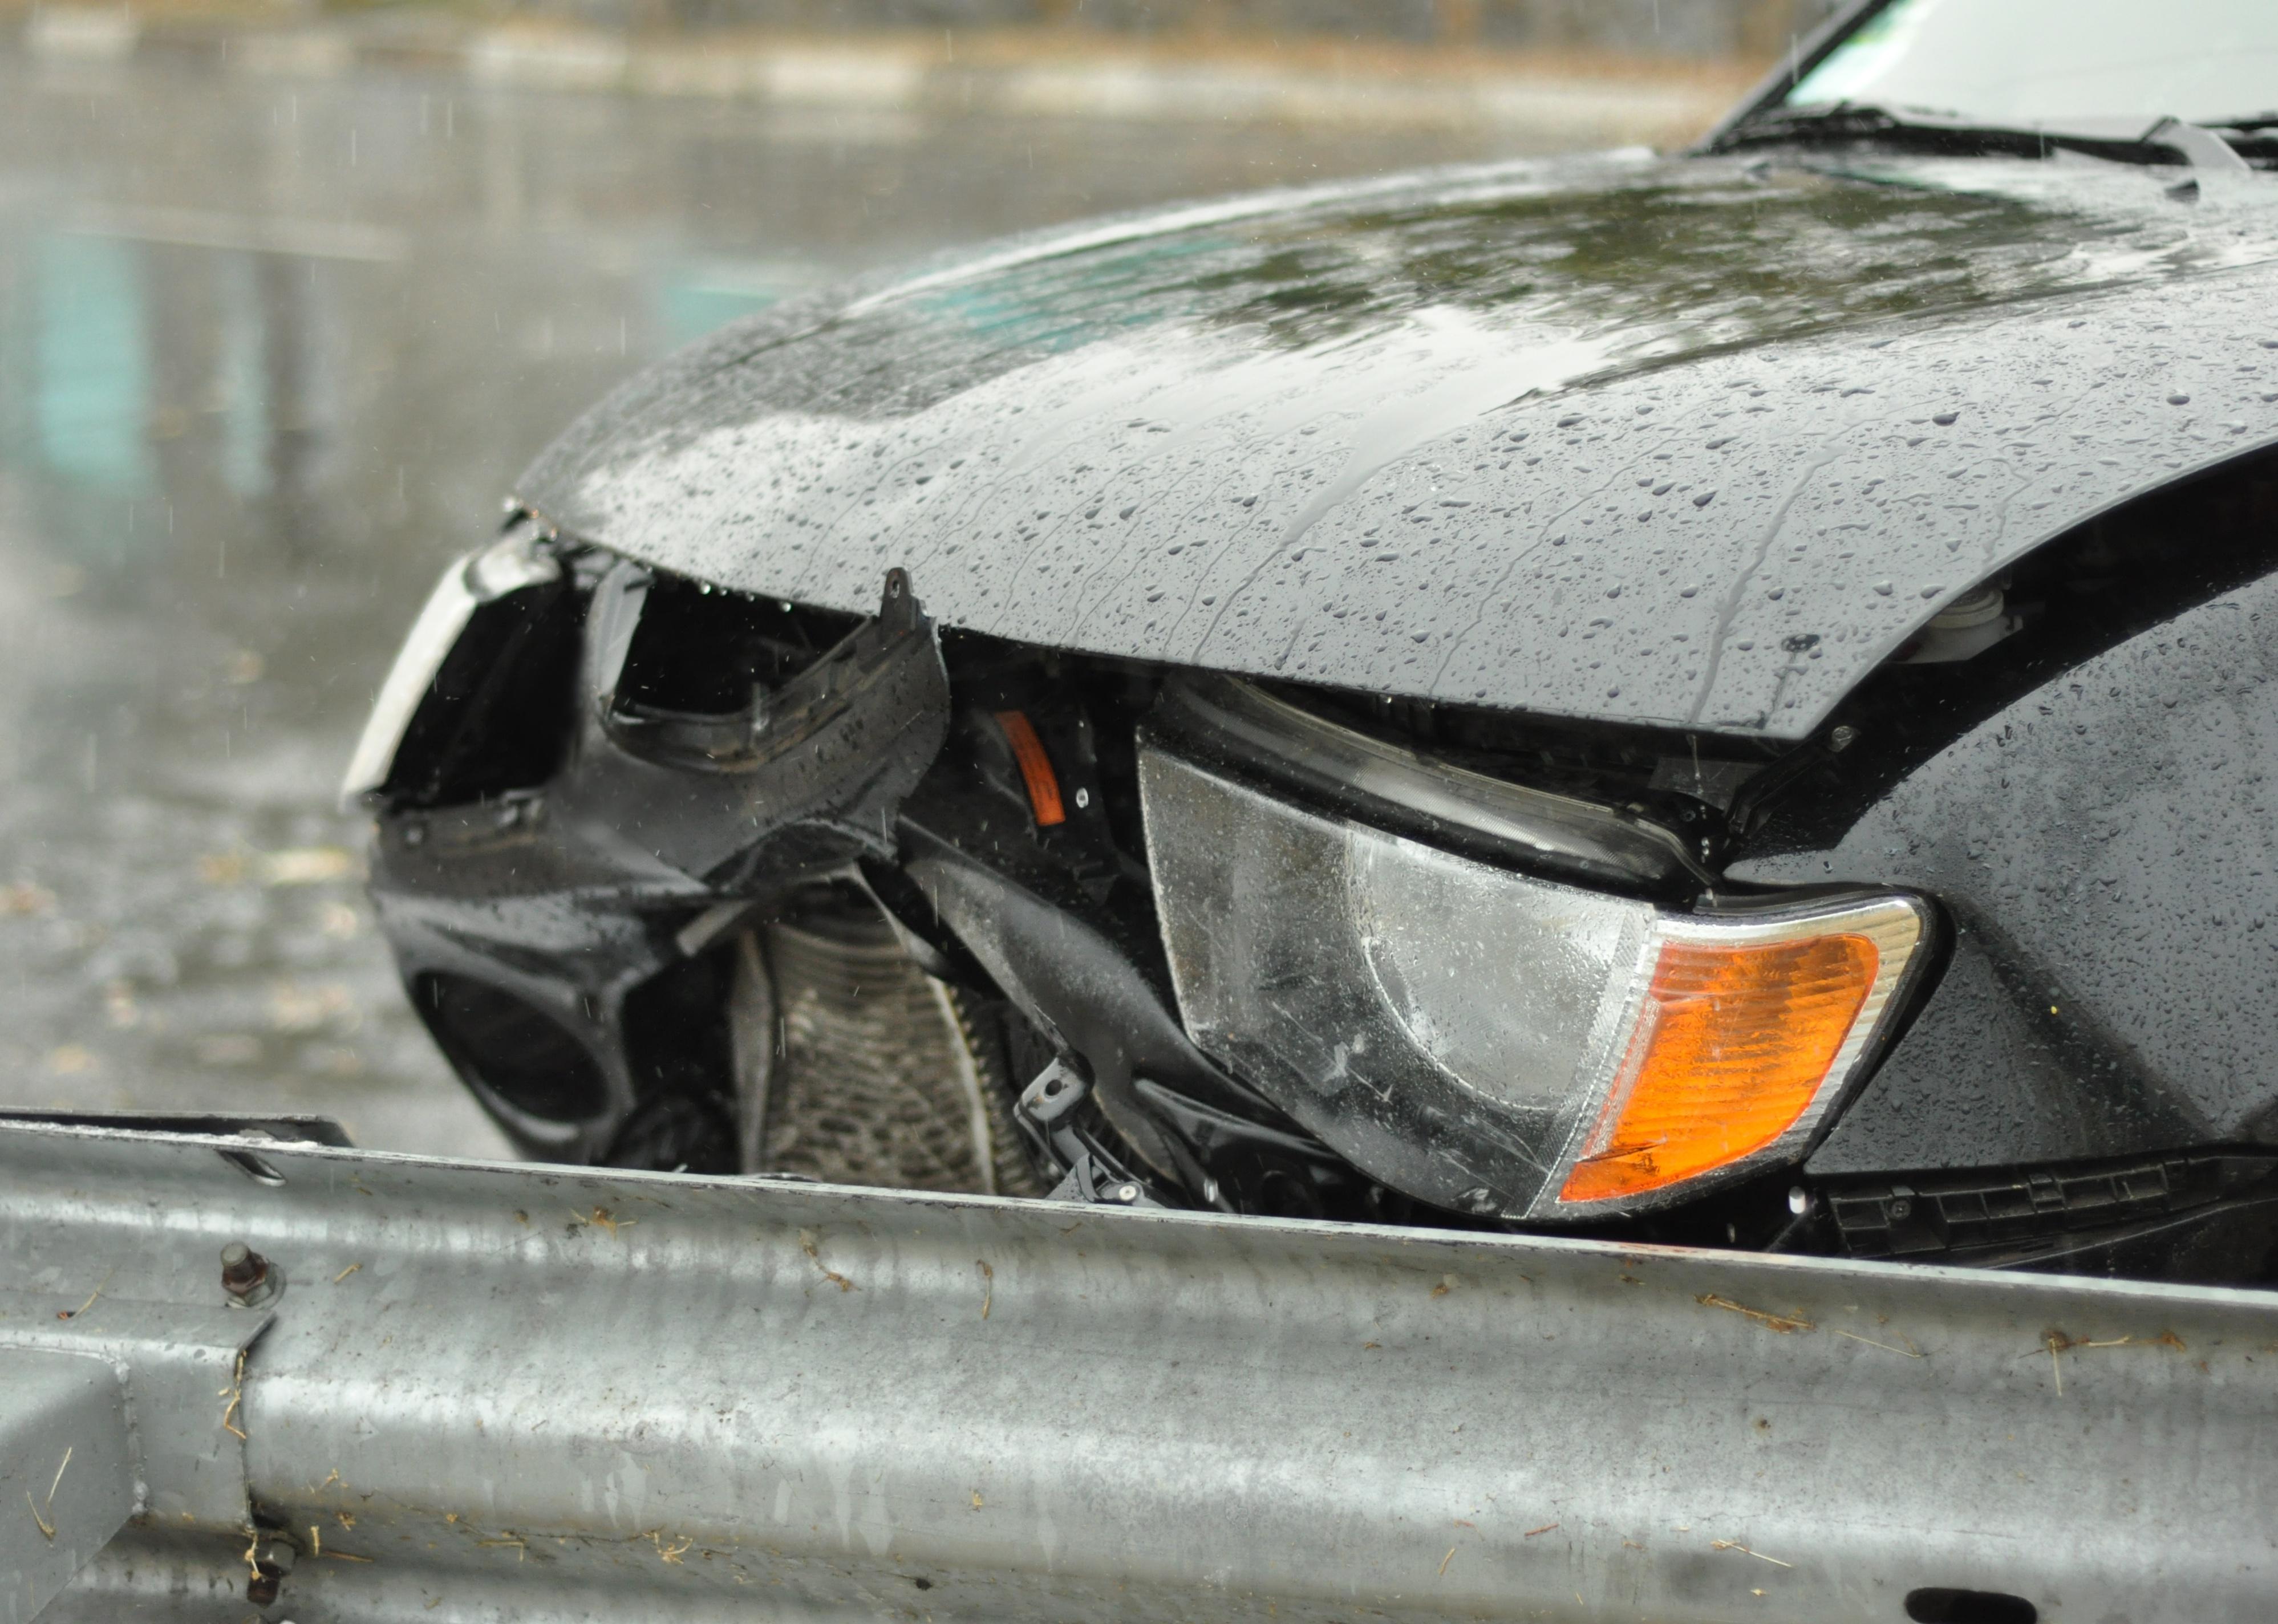
Front of black car damaged by accident.
– Motor vehicle crash fatalities: 12.23 per 100,000 residents (81 total)
– Pedestrian fatalities from vehicle crashes: 3.77 per 100,000 residents (25 total)
William A. Morgan // Shutterstock
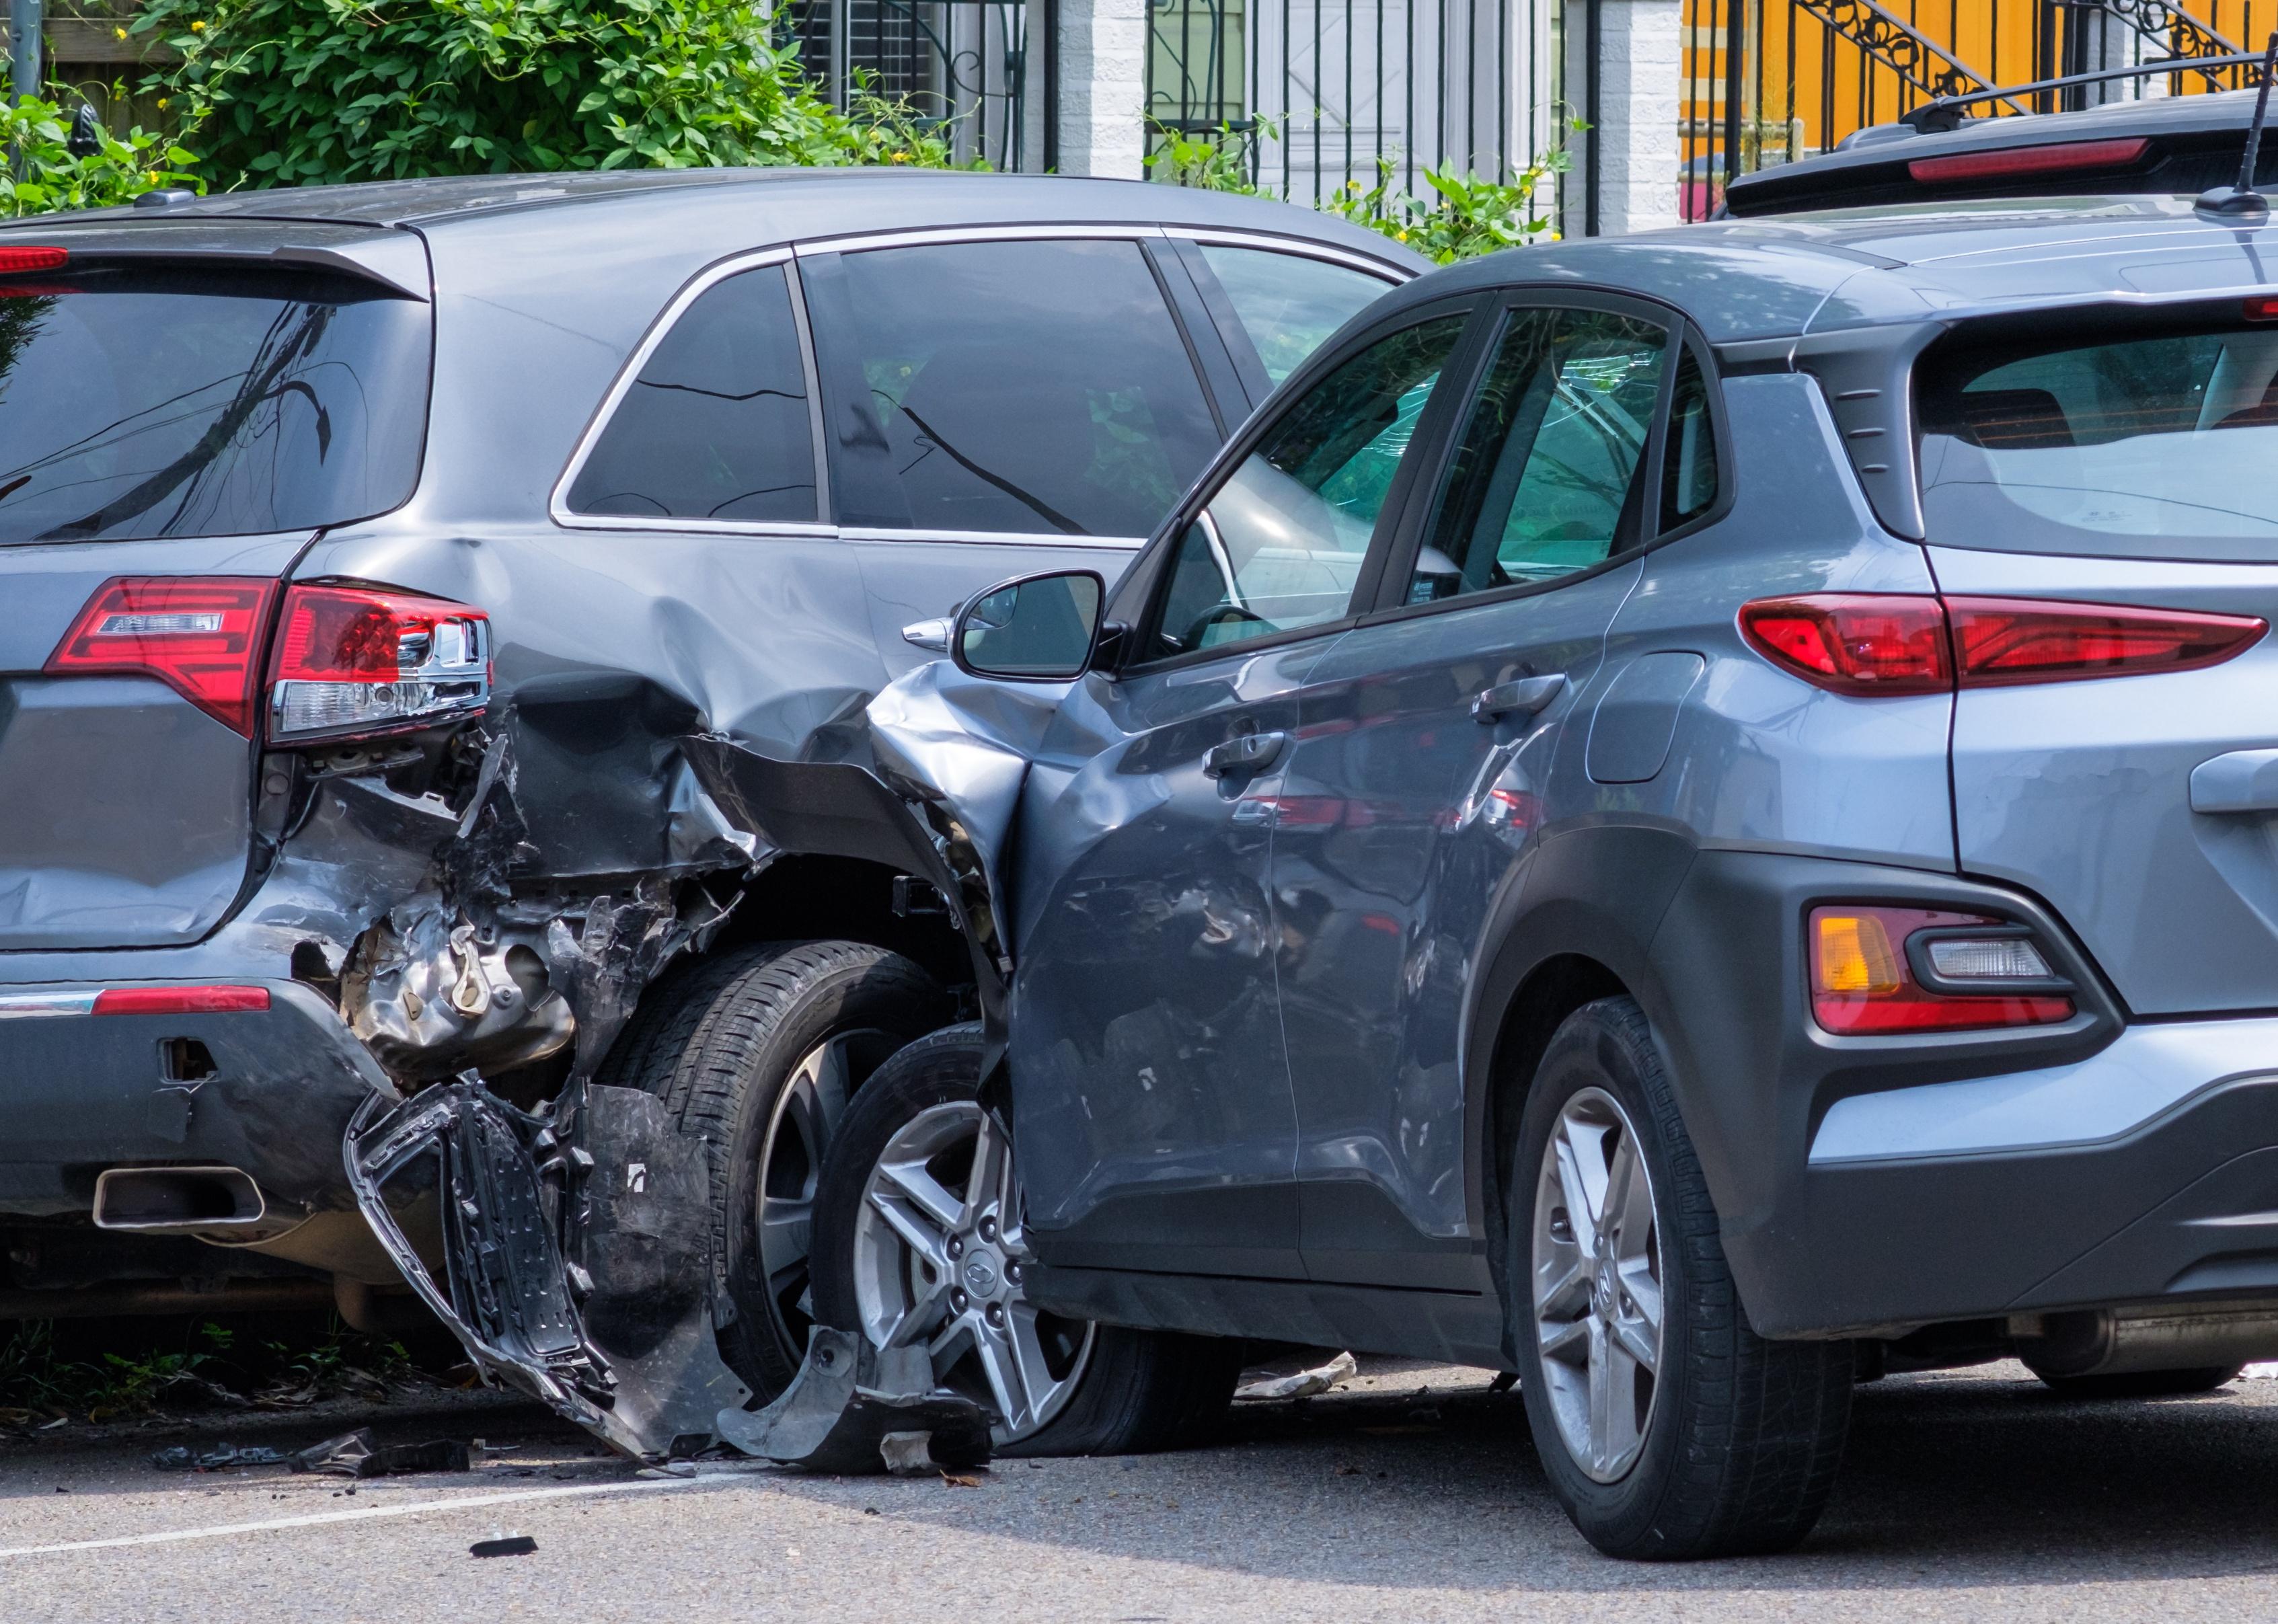
#49. Salt Lake City
Car crashed into parked car on neighborhood street.
– Motor vehicle crash fatalities: 12.25 per 100,000 residents (25 total)
– Pedestrian fatalities from vehicle crashes: 1.96 per 100,000 residents (4 total)
Dmitry Kalinovsky // Shutterstock
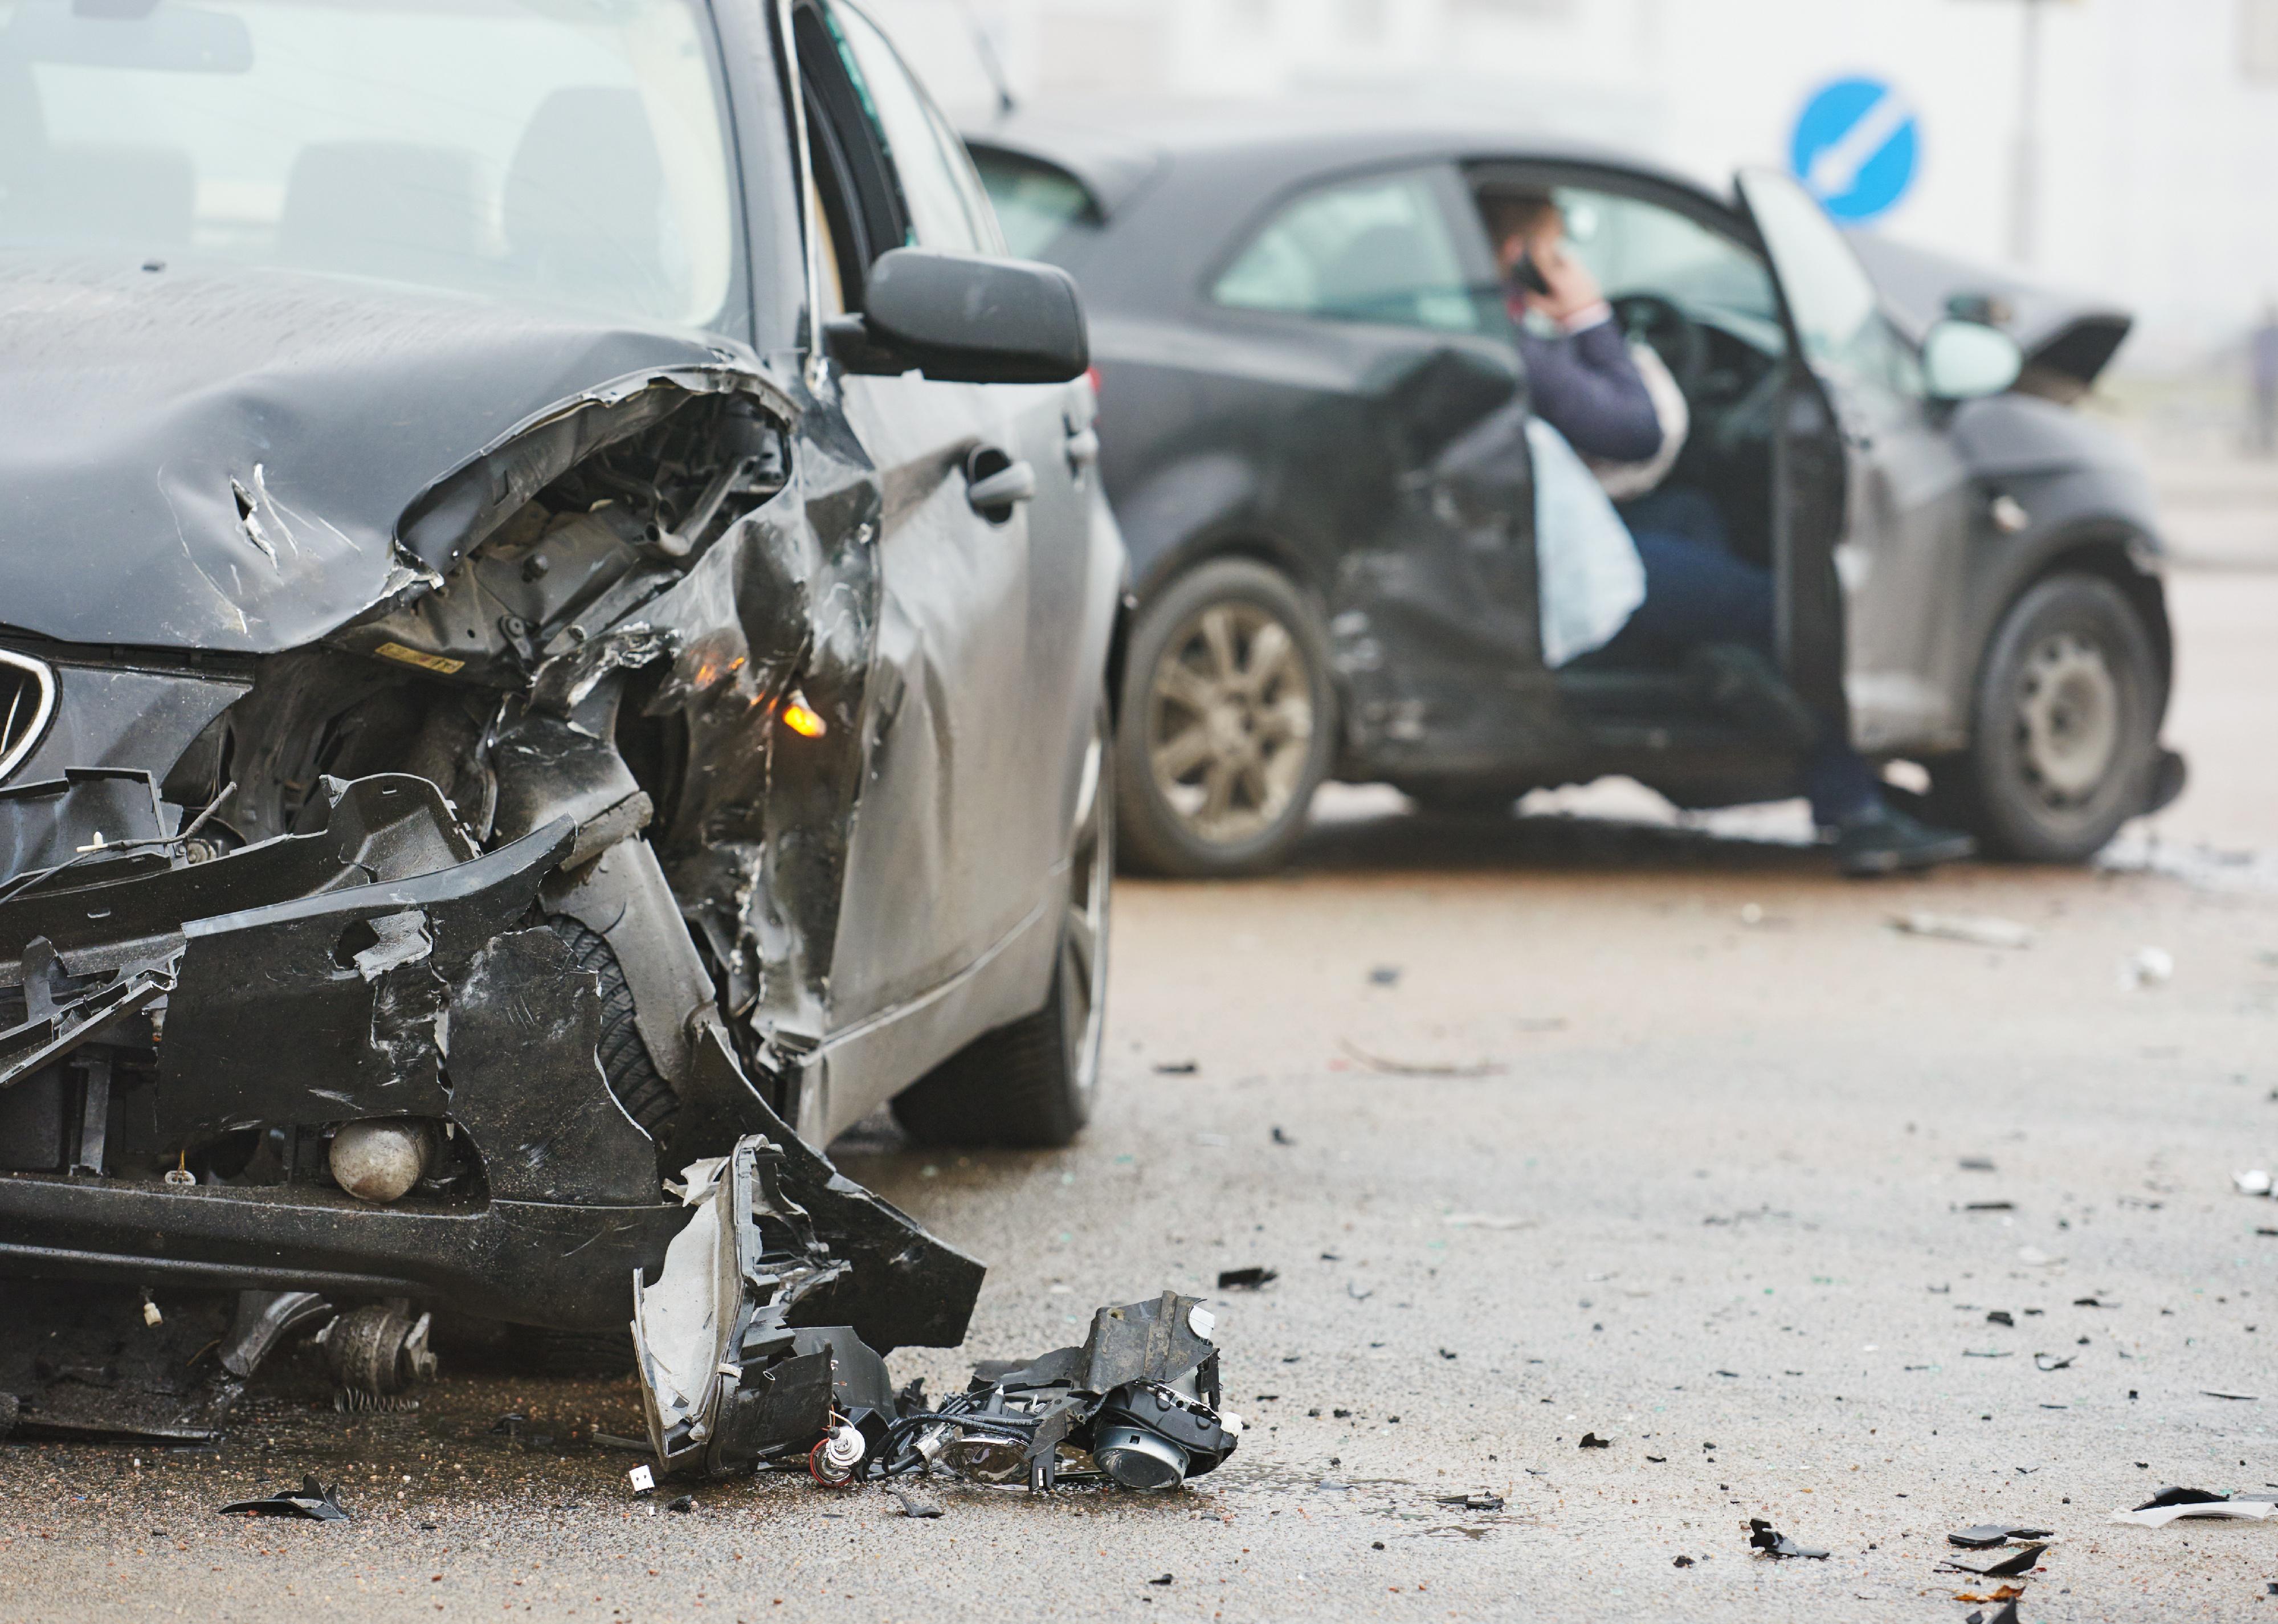
#48. Wichita, Kansas
Car crash accident on street.
– Motor vehicle crash fatalities: 12.25 per 100,000 residents (48 total)
– Pedestrian fatalities from vehicle crashes: 1.28 per 100,000 residents (5 total)
Gorodenkoff // Shutterstock
#47. Newport News, Virginia
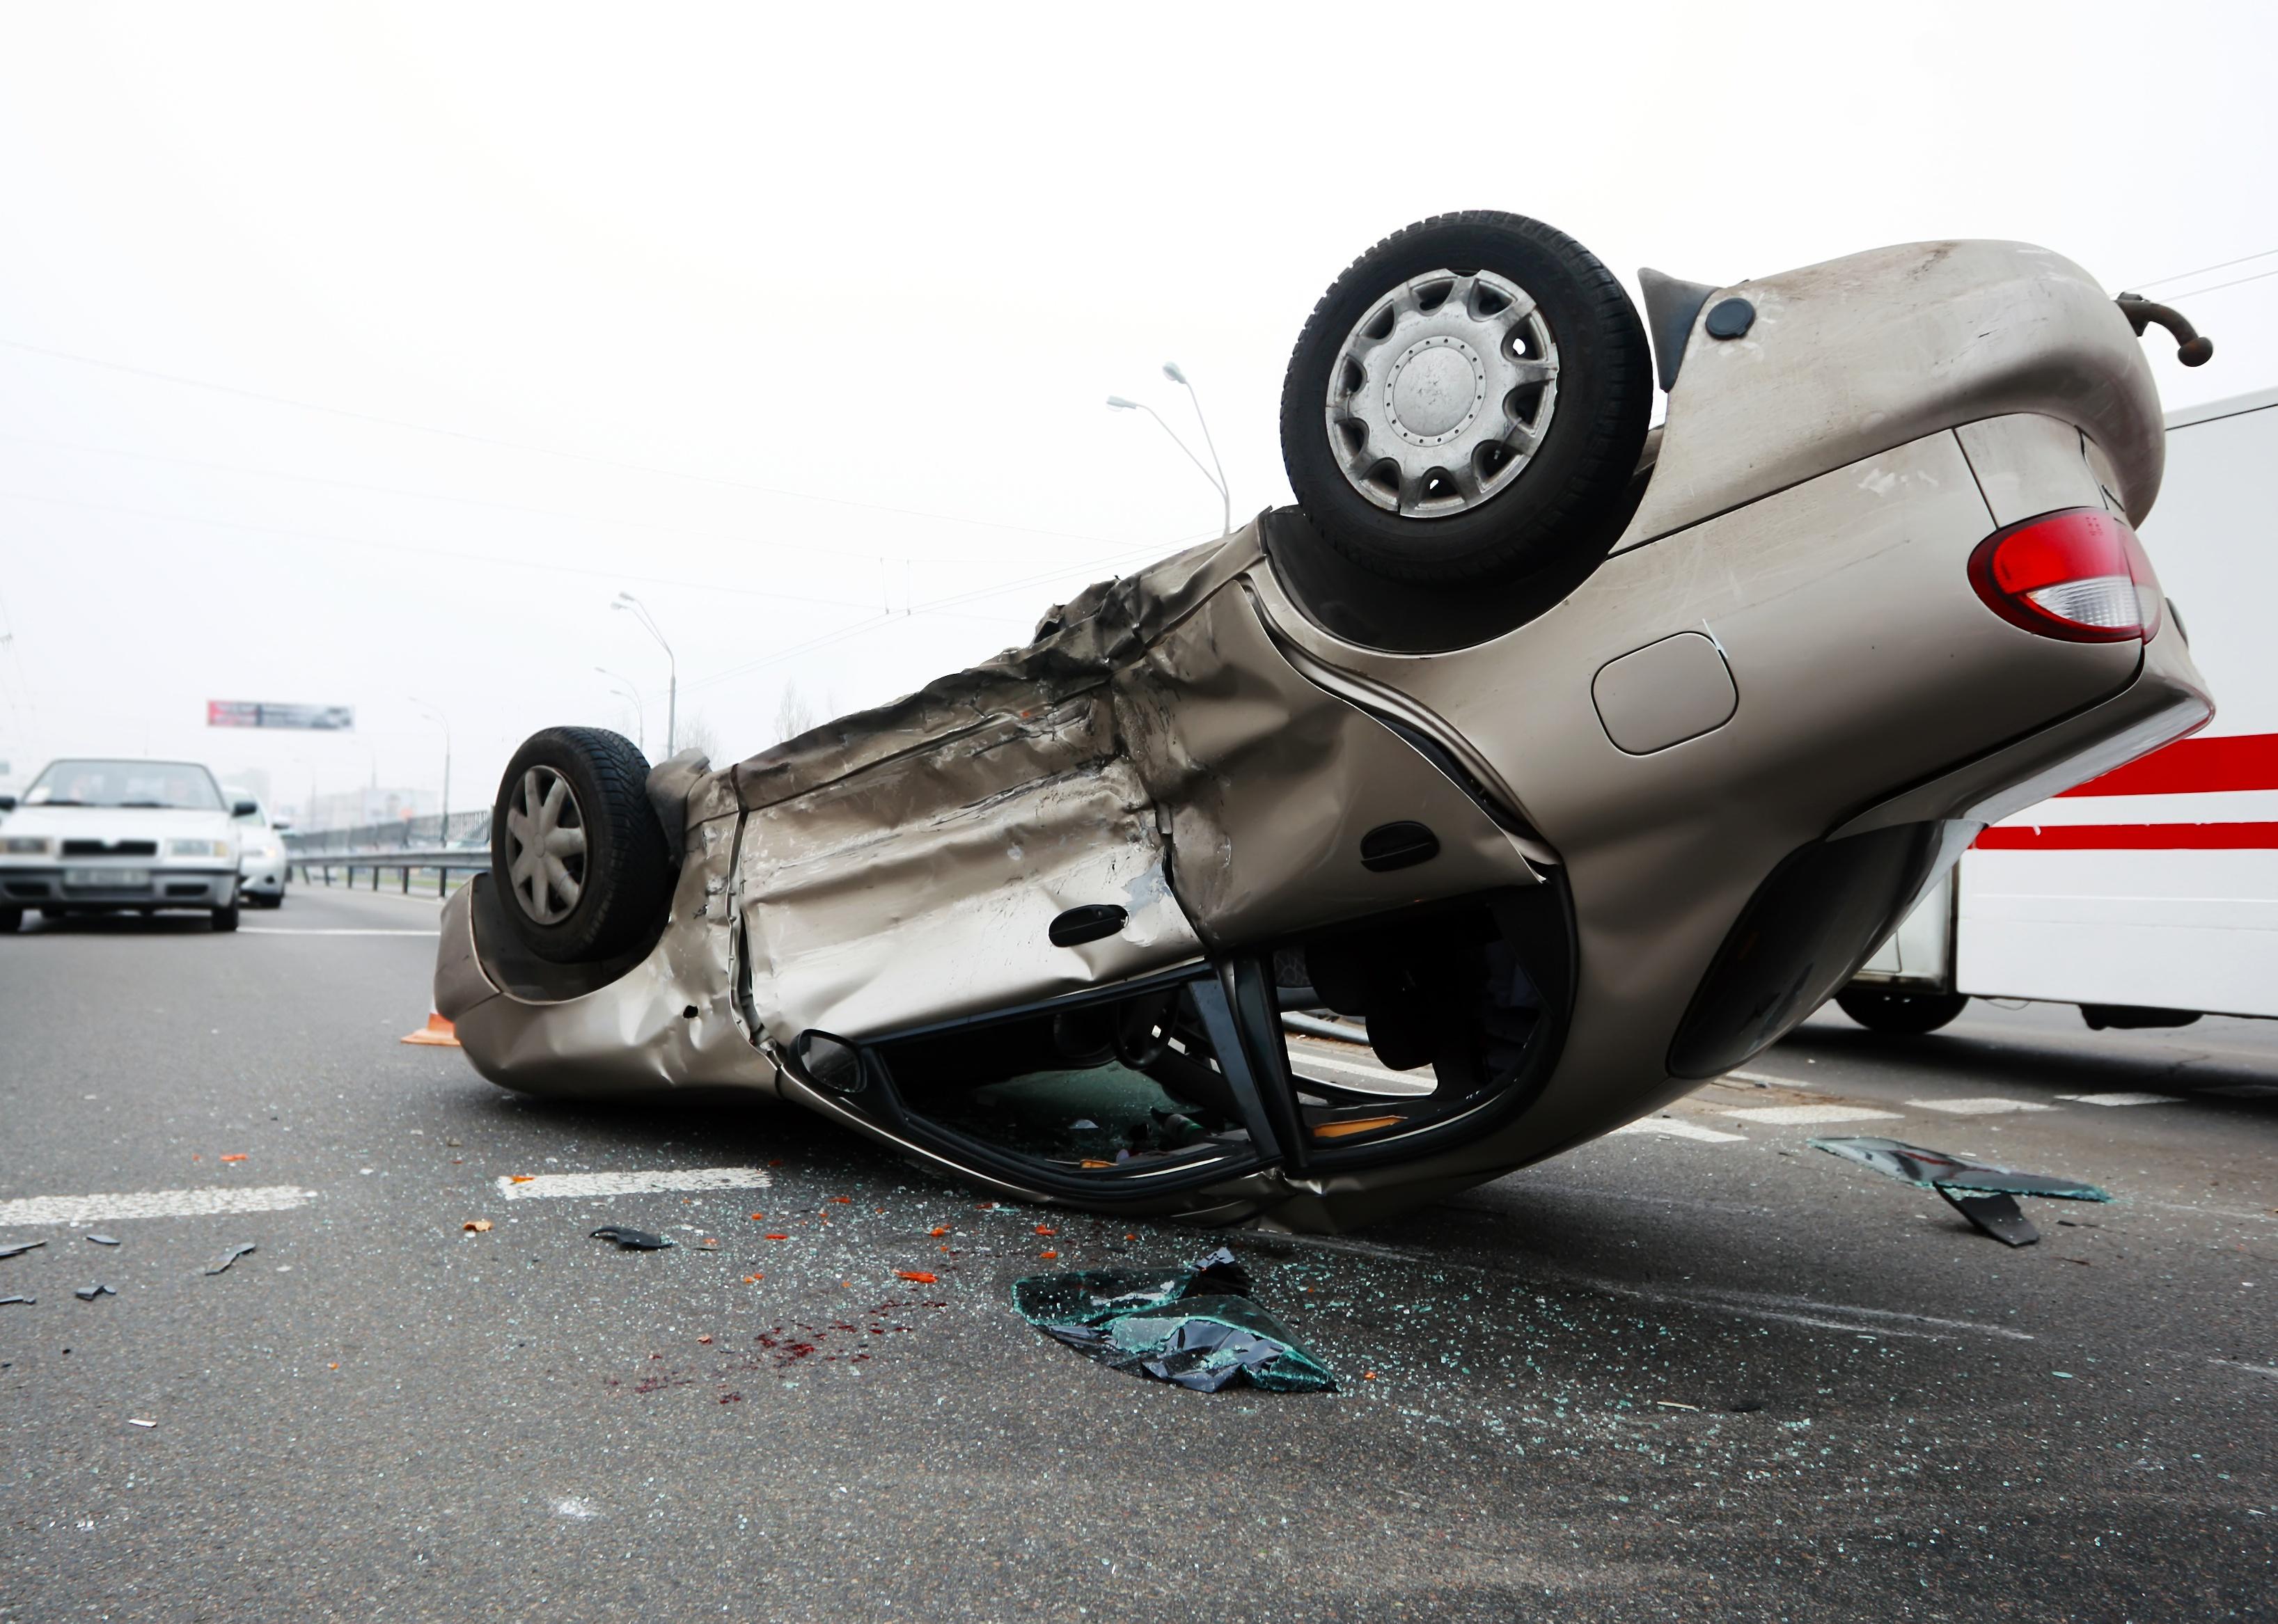
Vehicle lying on its roof in the middle of the road.
– Motor vehicle crash fatalities: 12.29 per 100,000 residents (22 total)
– Pedestrian fatalities from vehicle crashes: 1.68 per 100,000 residents (3 total)
Kwangmoozaa // Shutterstock
#46. St. Petersburg, Florida
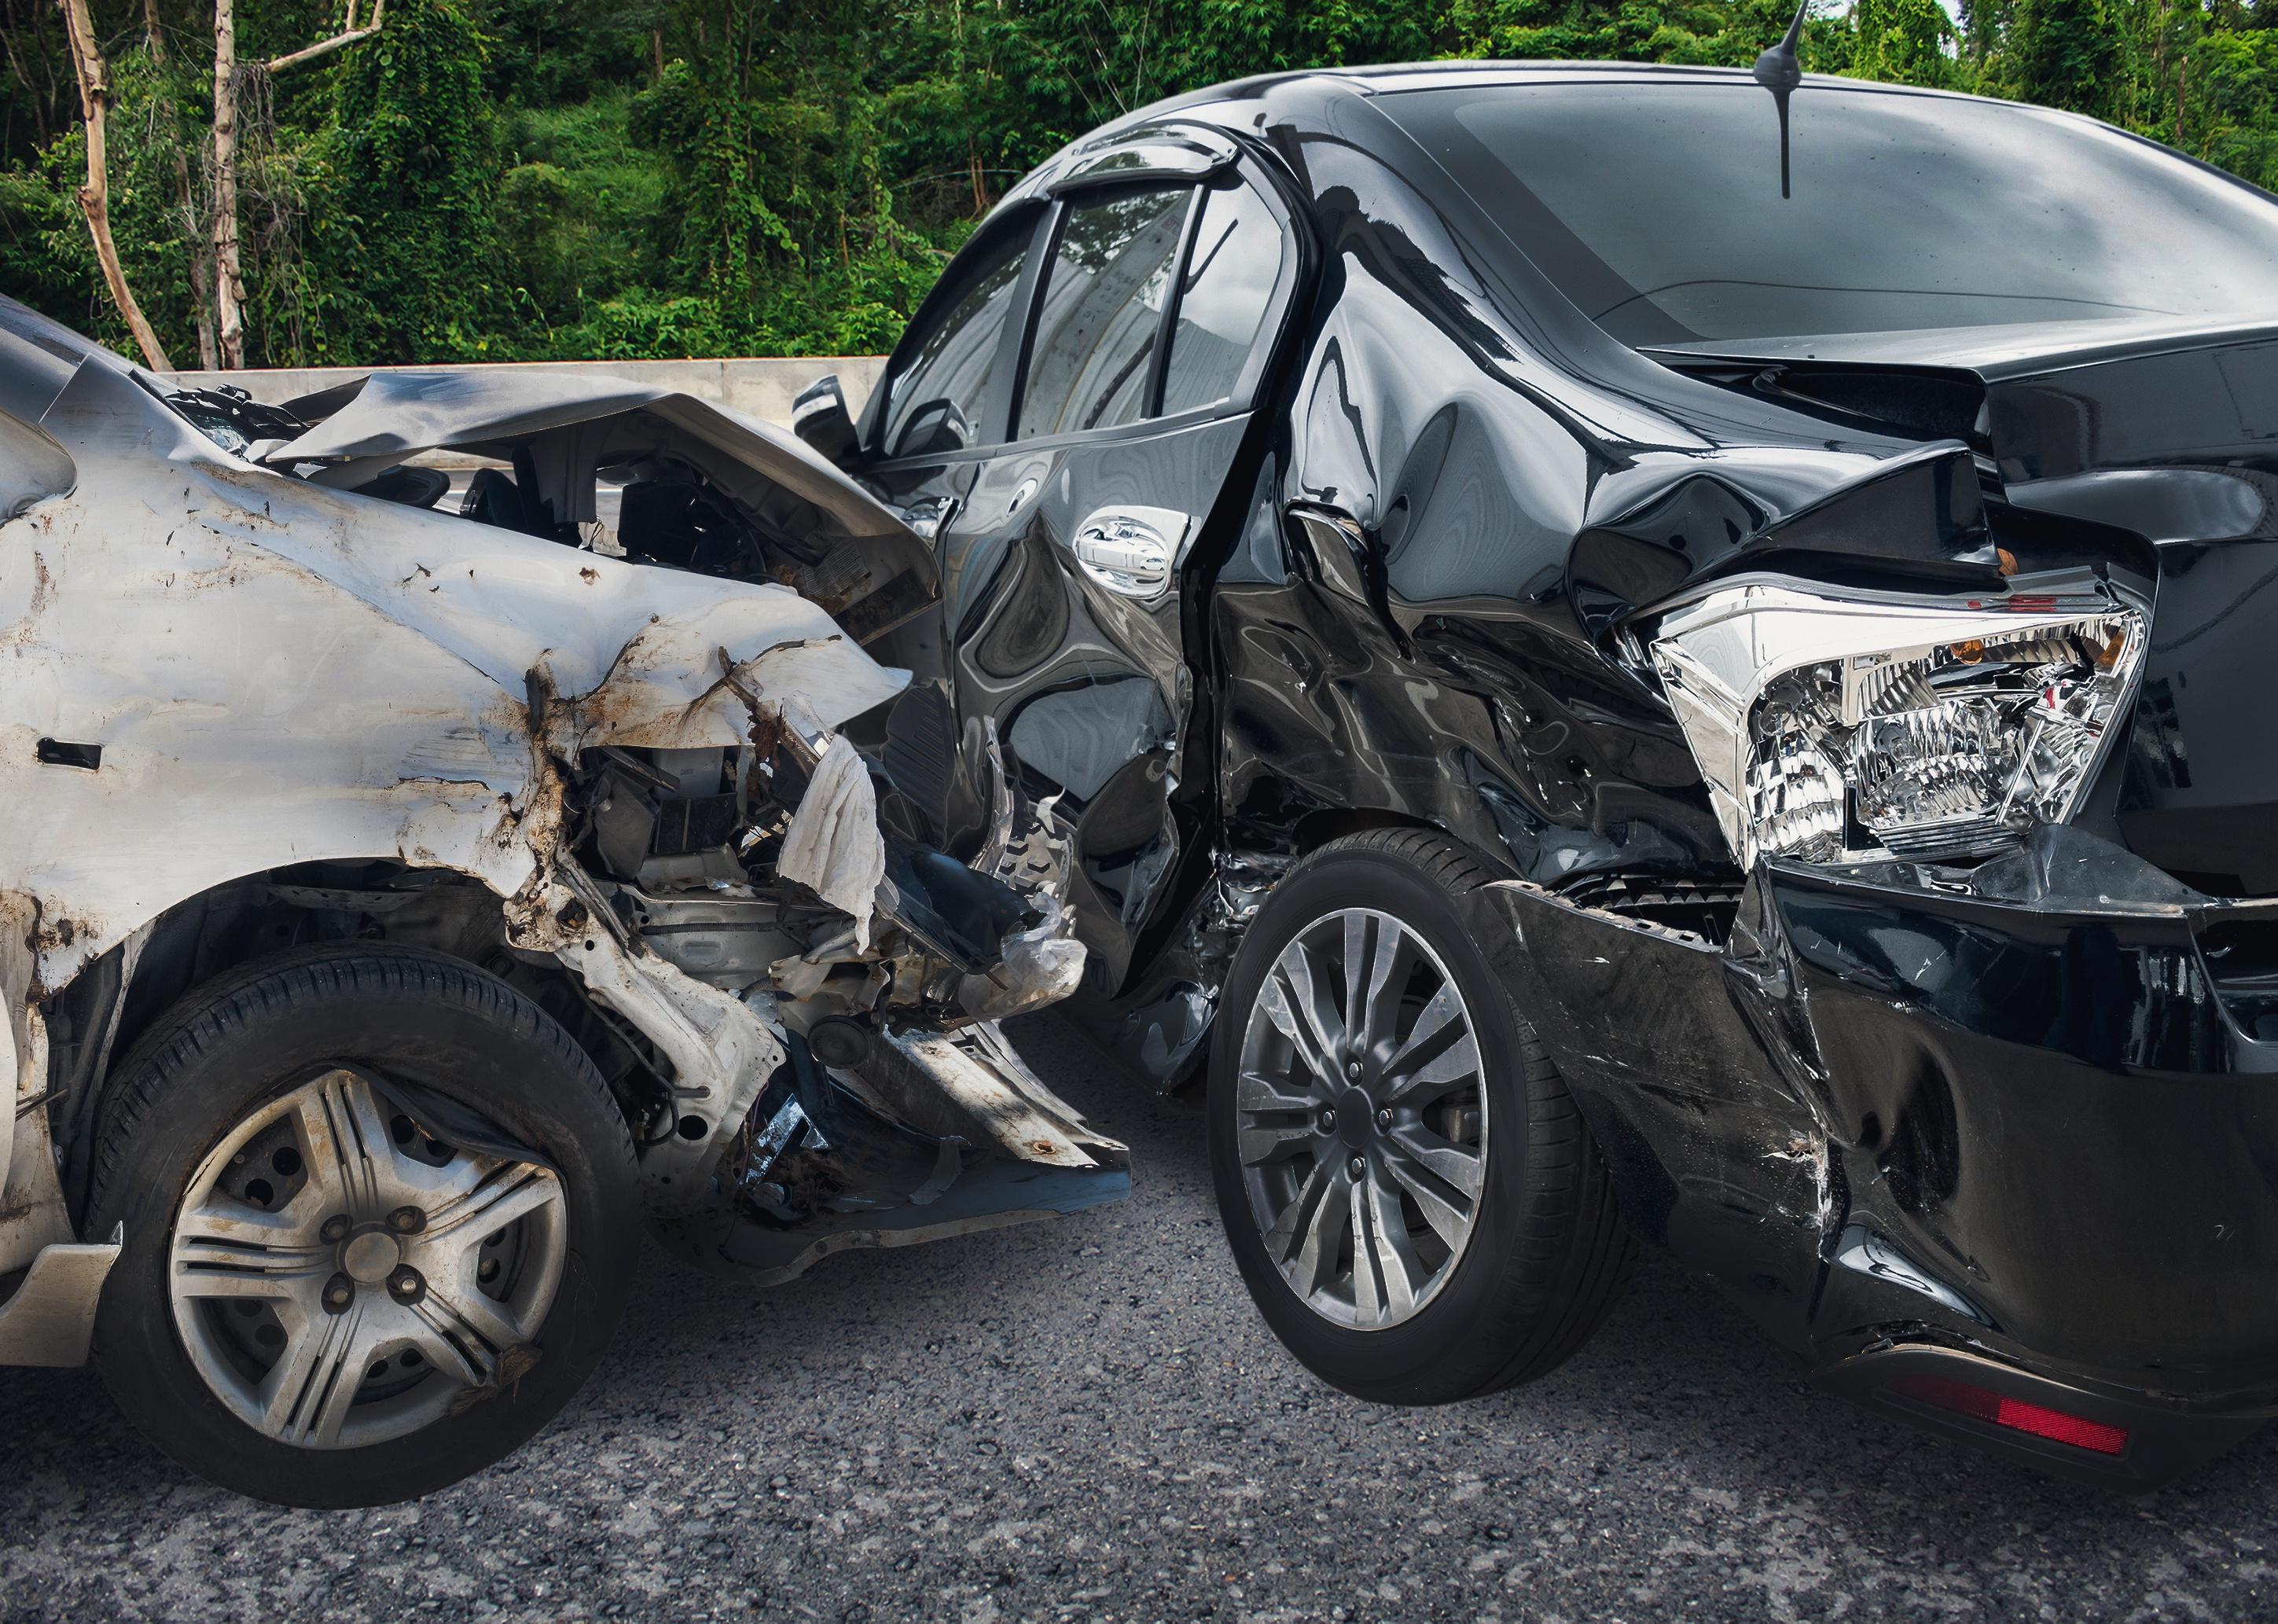
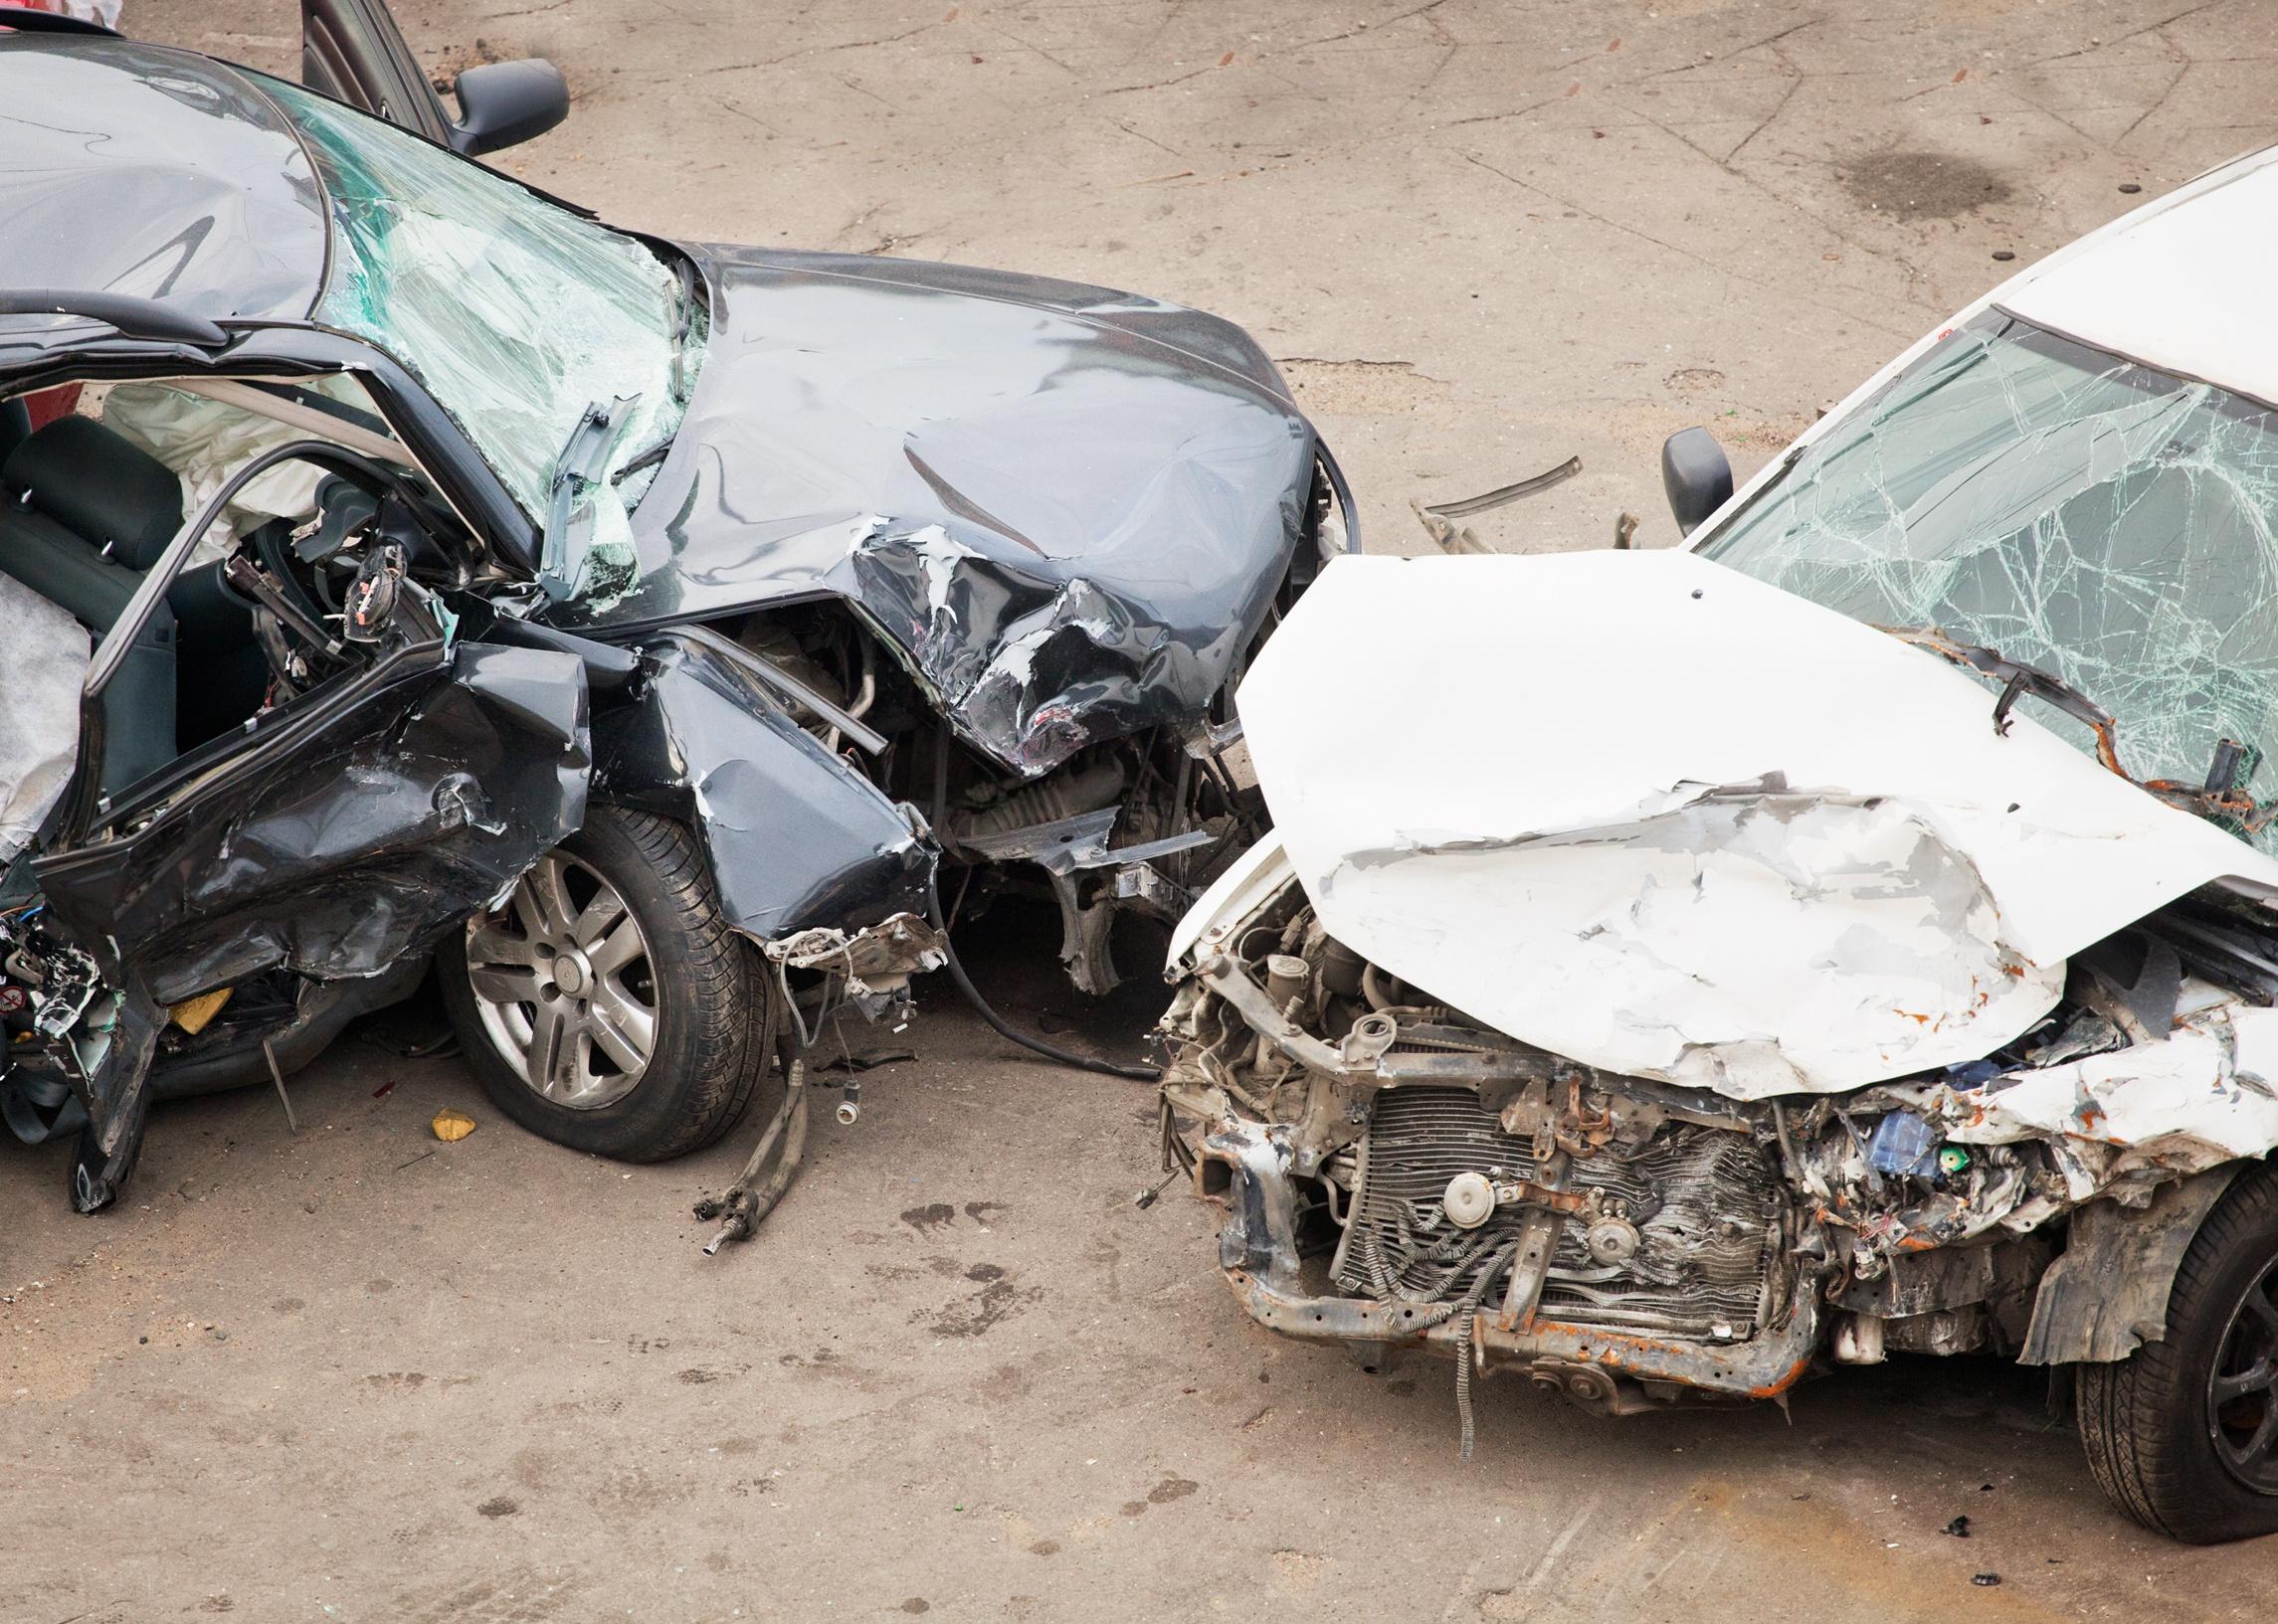
Two cars crashed into each other.
– Motor vehicle crash fatalities: 12.70 per 100,000 residents (34 total)
– Pedestrian fatalities from vehicle crashes: 2.24 per 100,000 residents (6 total)
You may also like: The most financially damaging cybercrimes in your state
Godlikeart // Shutterstock
#45. Miami
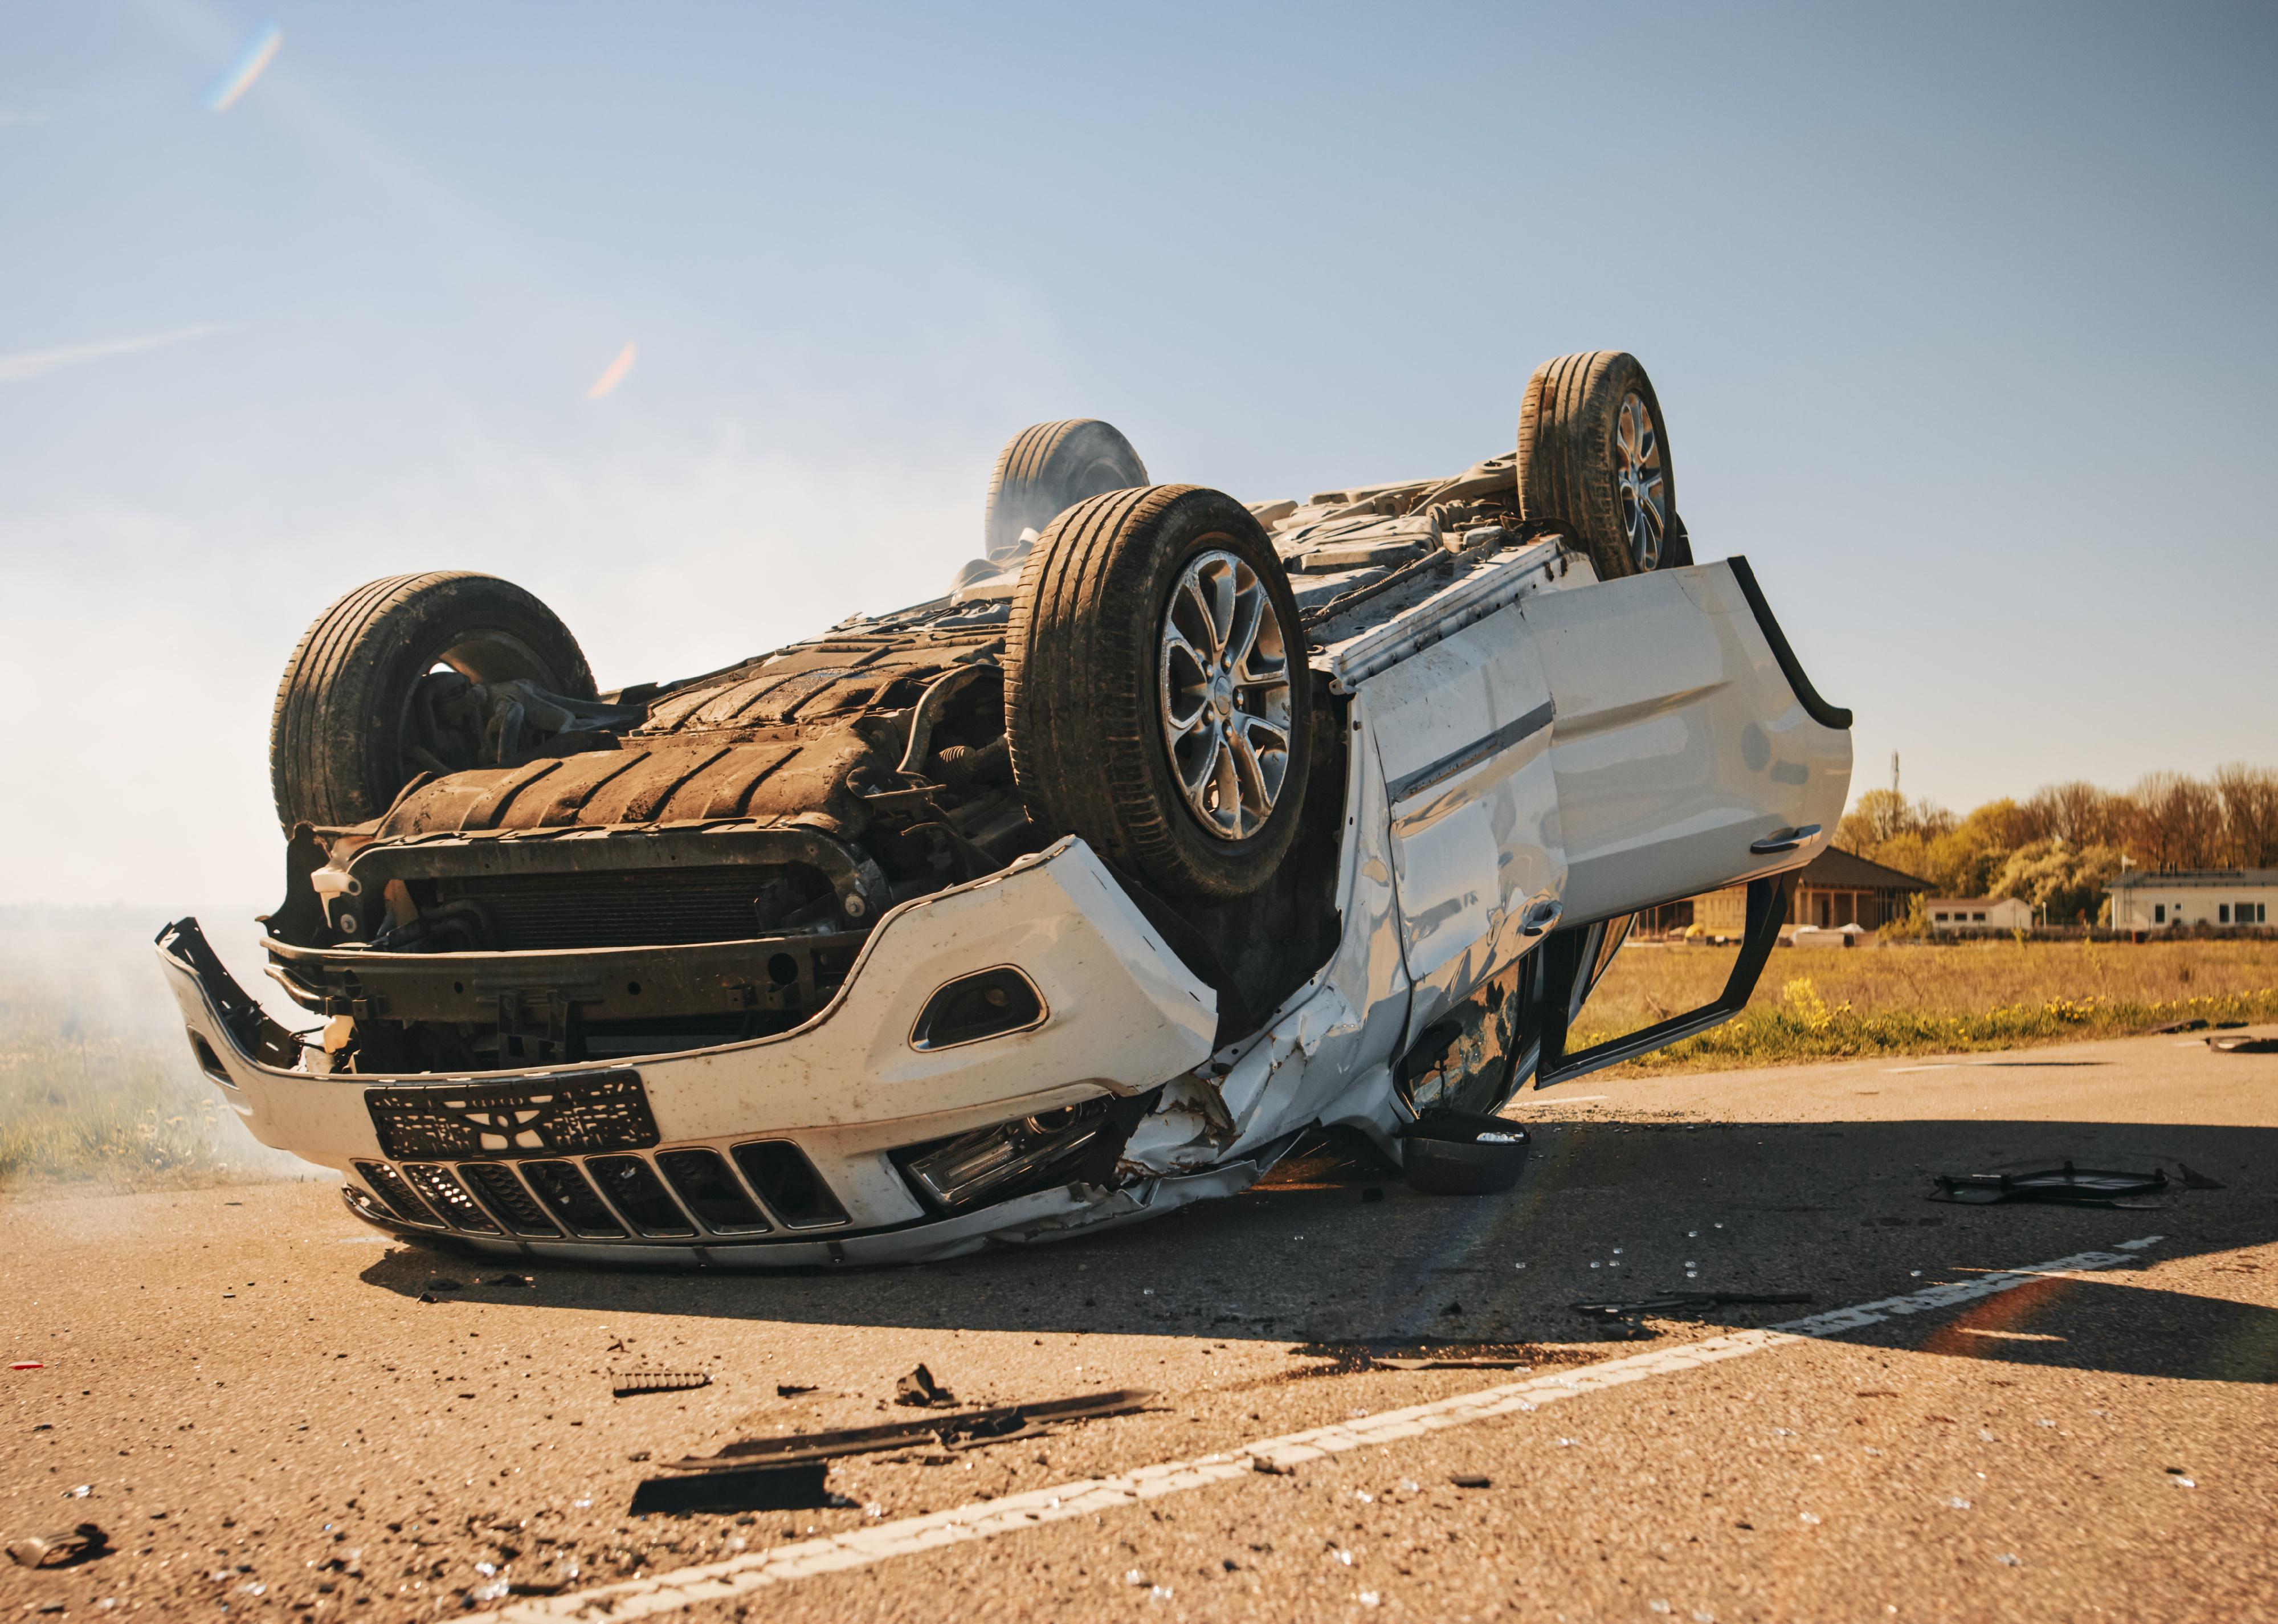
Car turned over after an accident.
– Motor vehicle crash fatalities: 12.72 per 100,000 residents (60 total)
– Pedestrian fatalities from vehicle crashes: 4.45 per 100,000 residents (21 total)
Dmitry Kalinovsky // Shutterstock
#44. Montgomery, Alabama
Broken front of a car after a collision.
– Motor vehicle crash fatalities: 12.74 per 100,000 residents (25 total)
– Pedestrian fatalities from vehicle crashes: 4.08 per 100,000 residents (8 total)
Vereshchagin Dmitry // Shutterstock
#43. Huntsville, Alabama
A white and black car pictured after a crash.
– Motor vehicle crash fatalities: 12.81 per 100,000 residents (26 total)
– Pedestrian fatalities from vehicle crashes: 3.94 per 100,000 residents (8 total)
Gorodenkoff // Shutterstock
#42. Toledo, Ohio
Scene of a car crash with paramedics.
– Motor vehicle crash fatalities: 12.89 per 100,000 residents (35 total)
– Pedestrian fatalities from vehicle crashes: 2.21 per 100,000 residents (6 total)
Krummerchen // Shutterstock
#41. New Orleans
Destroyed front of a car after a crash.
– Motor vehicle crash fatalities: 13.09 per 100,000 residents (51 total)
– Pedestrian fatalities from vehicle crashes: 2.57 per 100,000 residents (10 total)
You may also like: Biggest Native American tribes in the U.S. today

Ground Picture // Shutterstock
#40. Phoenix
Close-up of policeman doing investigation at road accident area.
– Motor vehicle crash fatalities: 13.11 per 100,000 residents (224 total)
– Pedestrian fatalities from vehicle crashes: 4.27 per 100,000 residents (73 total)
Juice Flair // Shutterstock
#39. Bakersfield, California
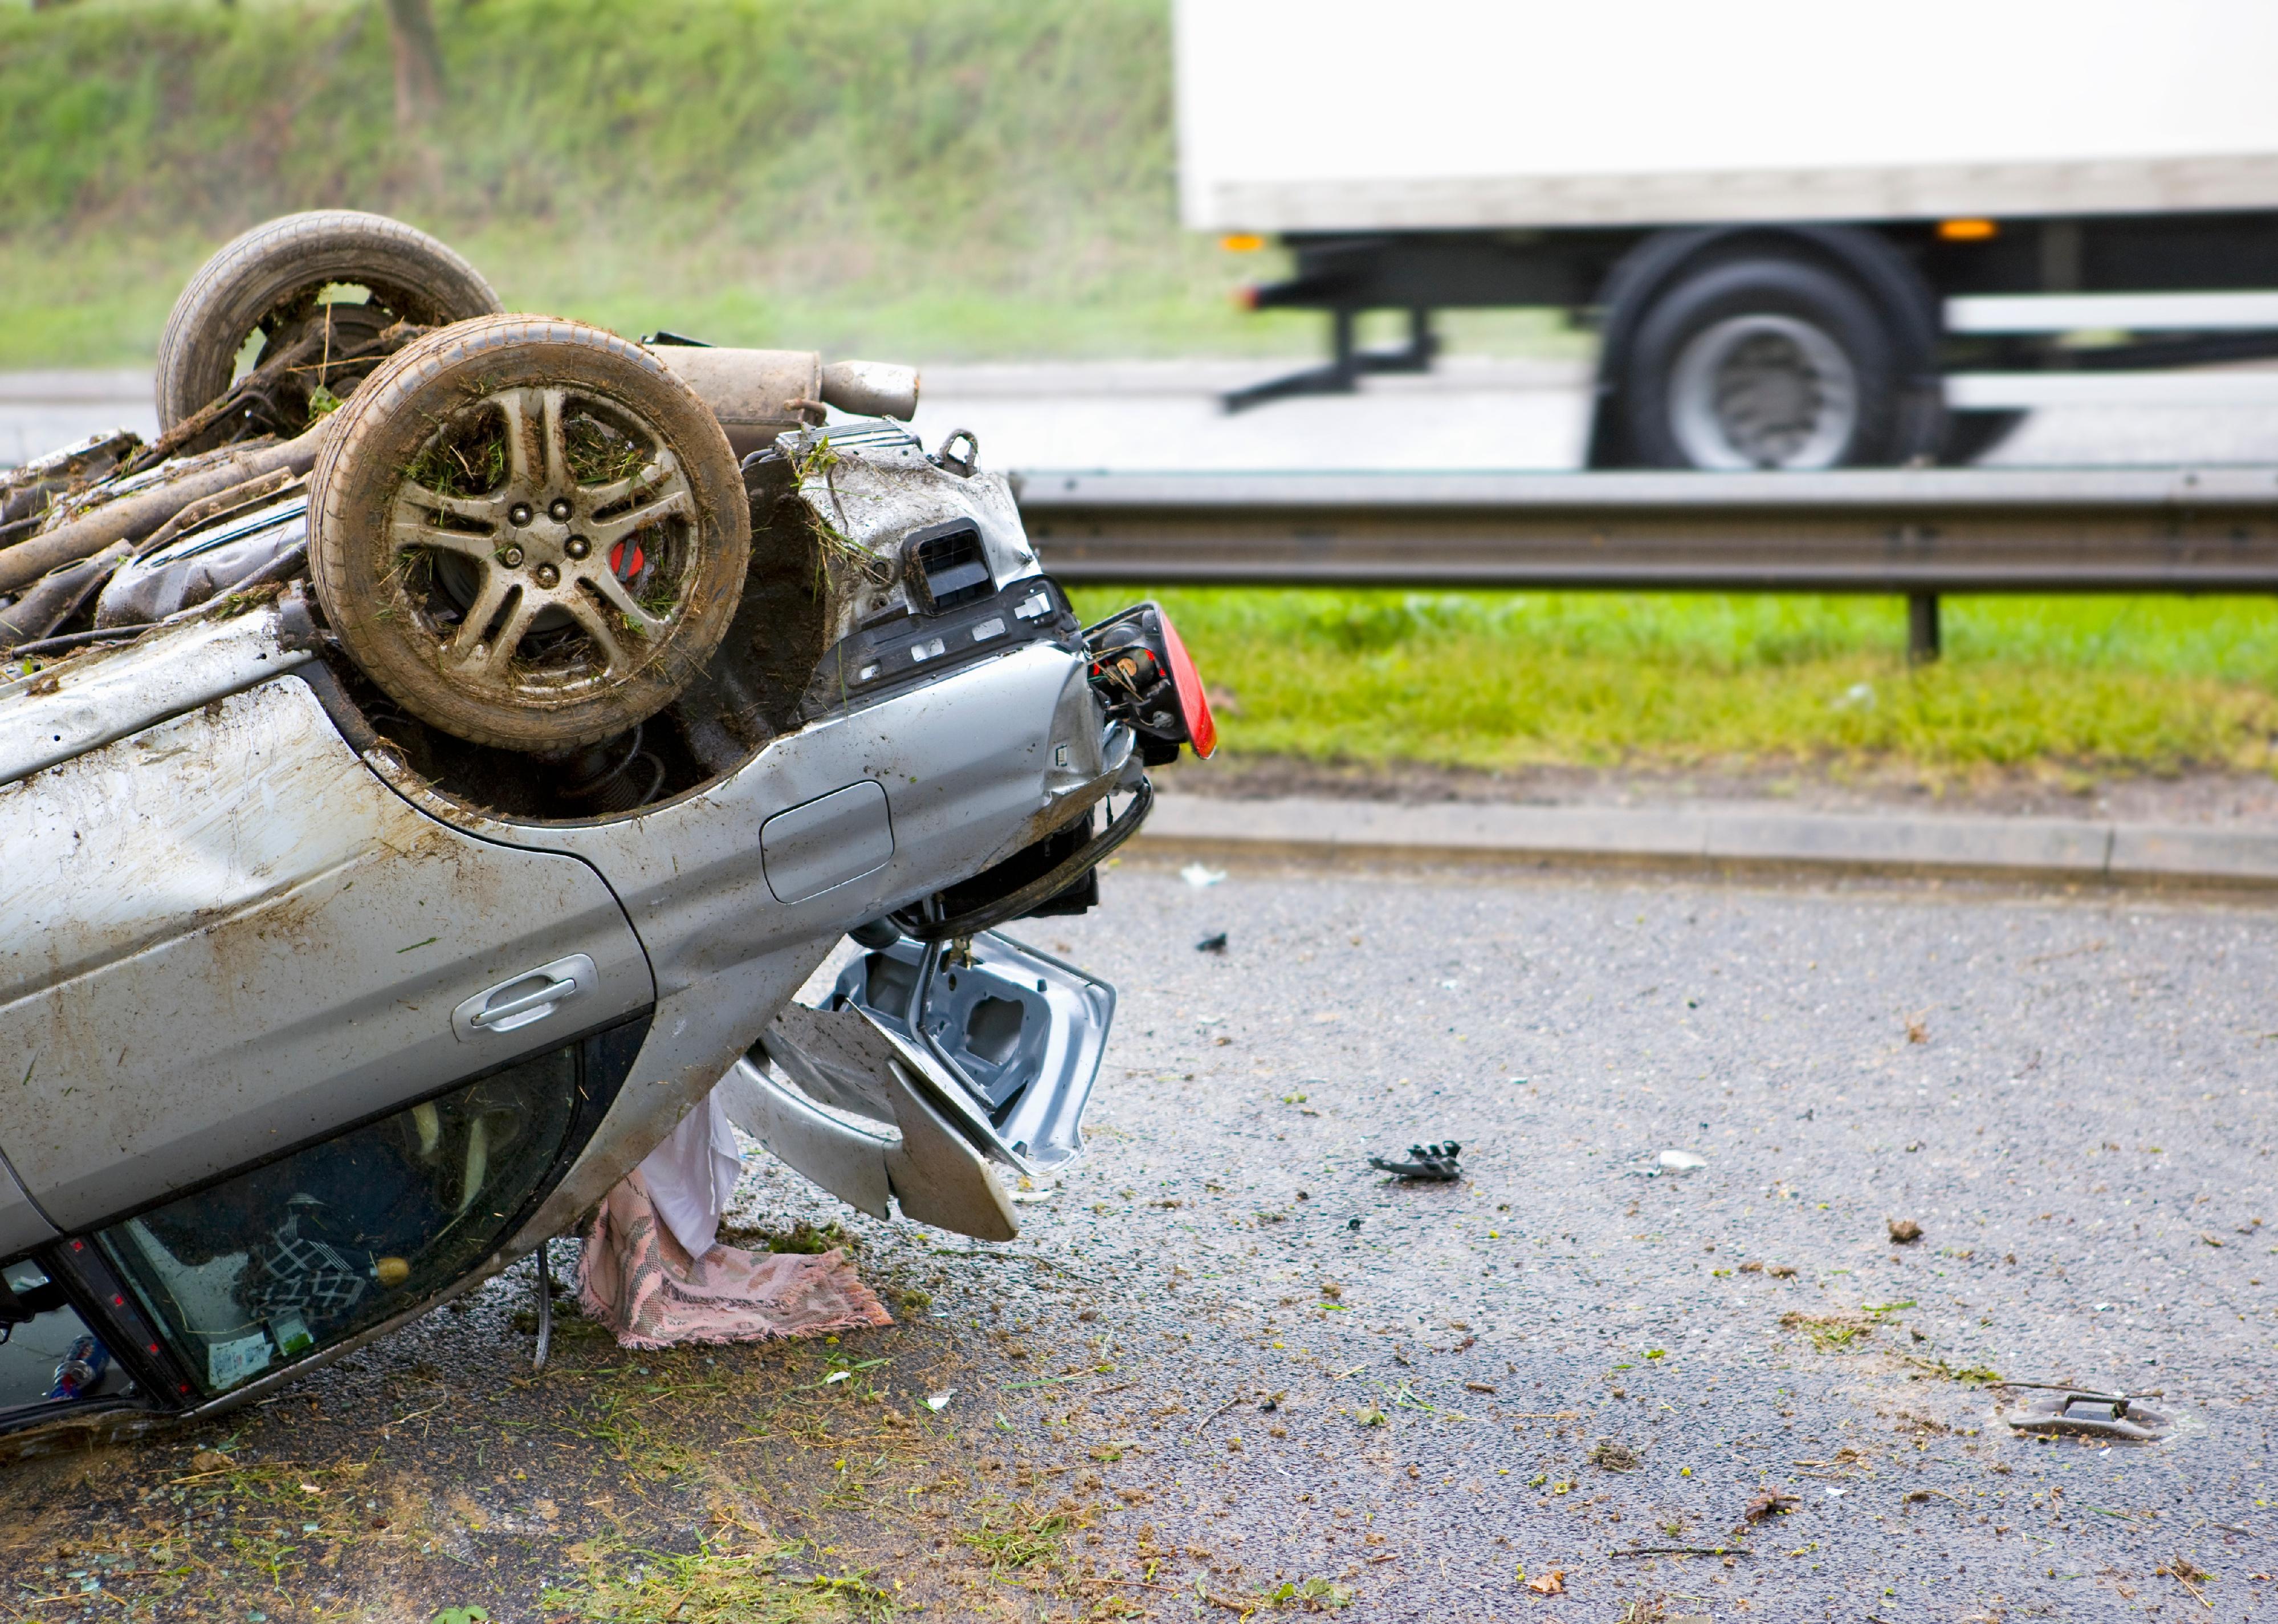
Close-up shot of the trunk of a car lying upside down after a crash on a motorway.
– Motor vehicle crash fatalities: 13.22 per 100,000 residents (51 total)
– Pedestrian fatalities from vehicle crashes: 3.63 per 100,000 residents (14 total)
osobystist // Shutterstock
#38. Fresno, California
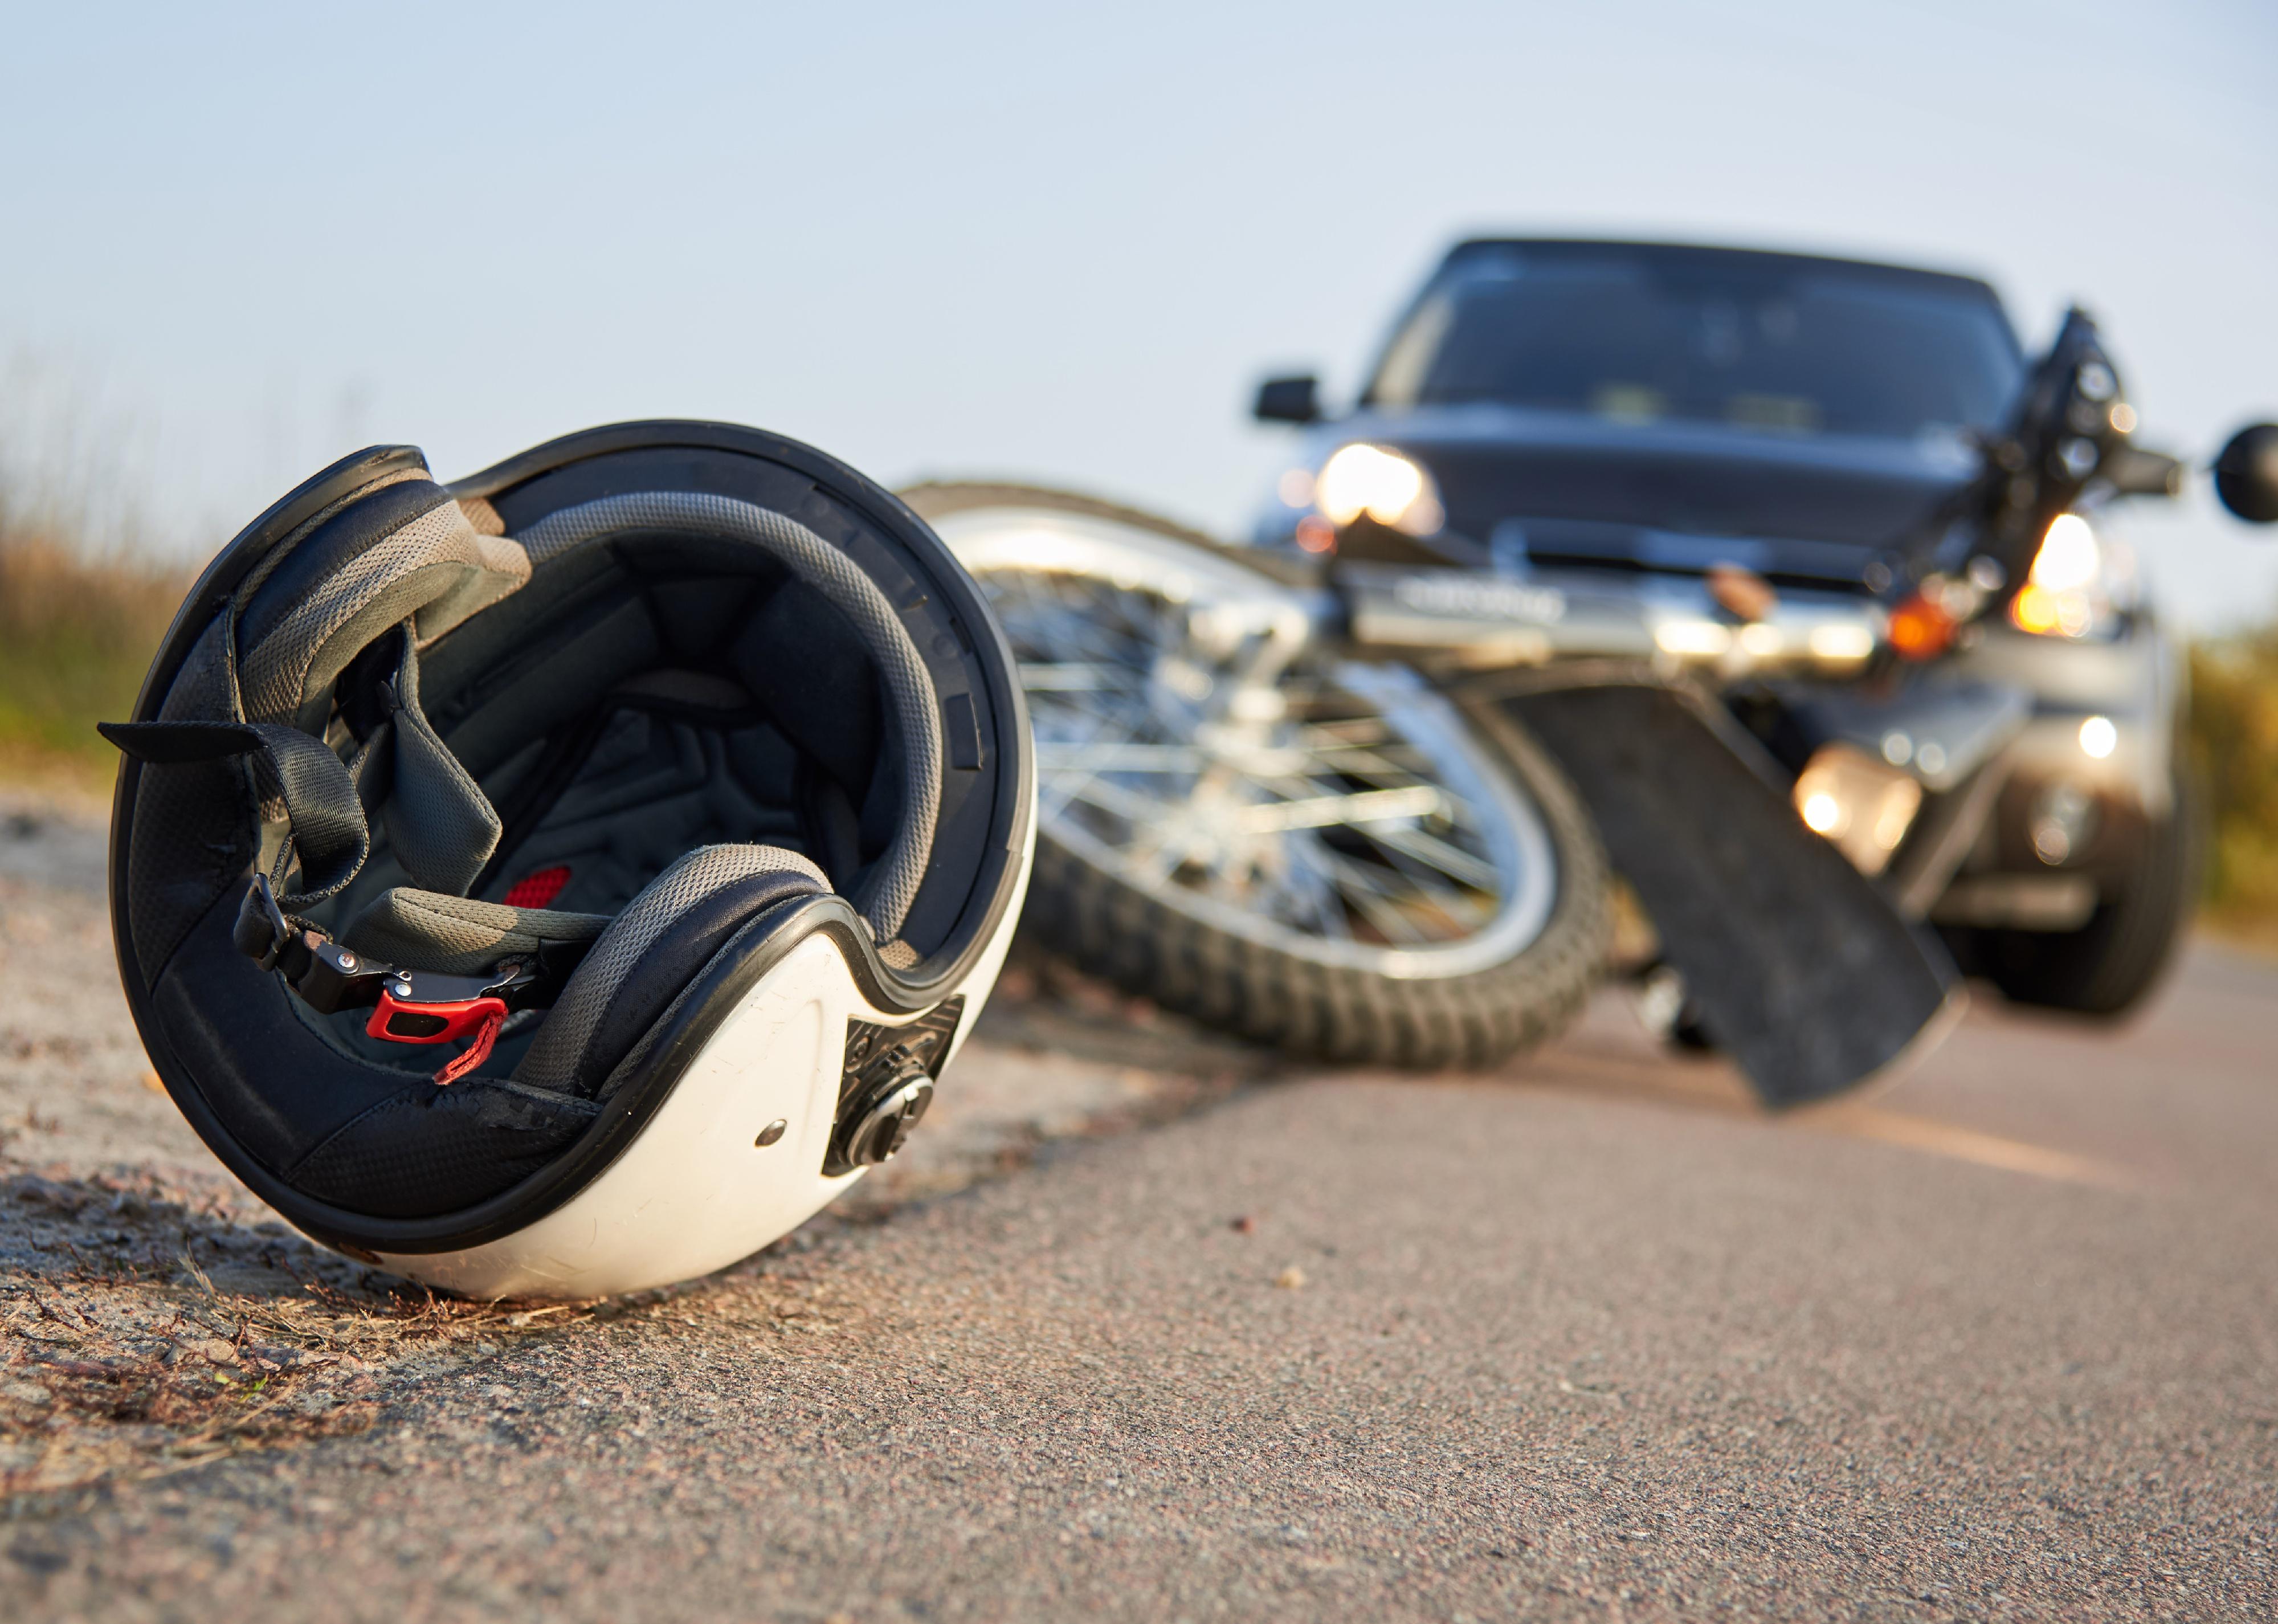
Photo of a car, helmet and motorcycle on road.
– Motor vehicle crash fatalities: 13.39 per 100,000 residents (71 total)
– Pedestrian fatalities from vehicle crashes: 5.47 per 100,000 residents (29 total)
pictoplay // Shutterstock
#37. Augusta-Richmond County consolidated government, Georgia
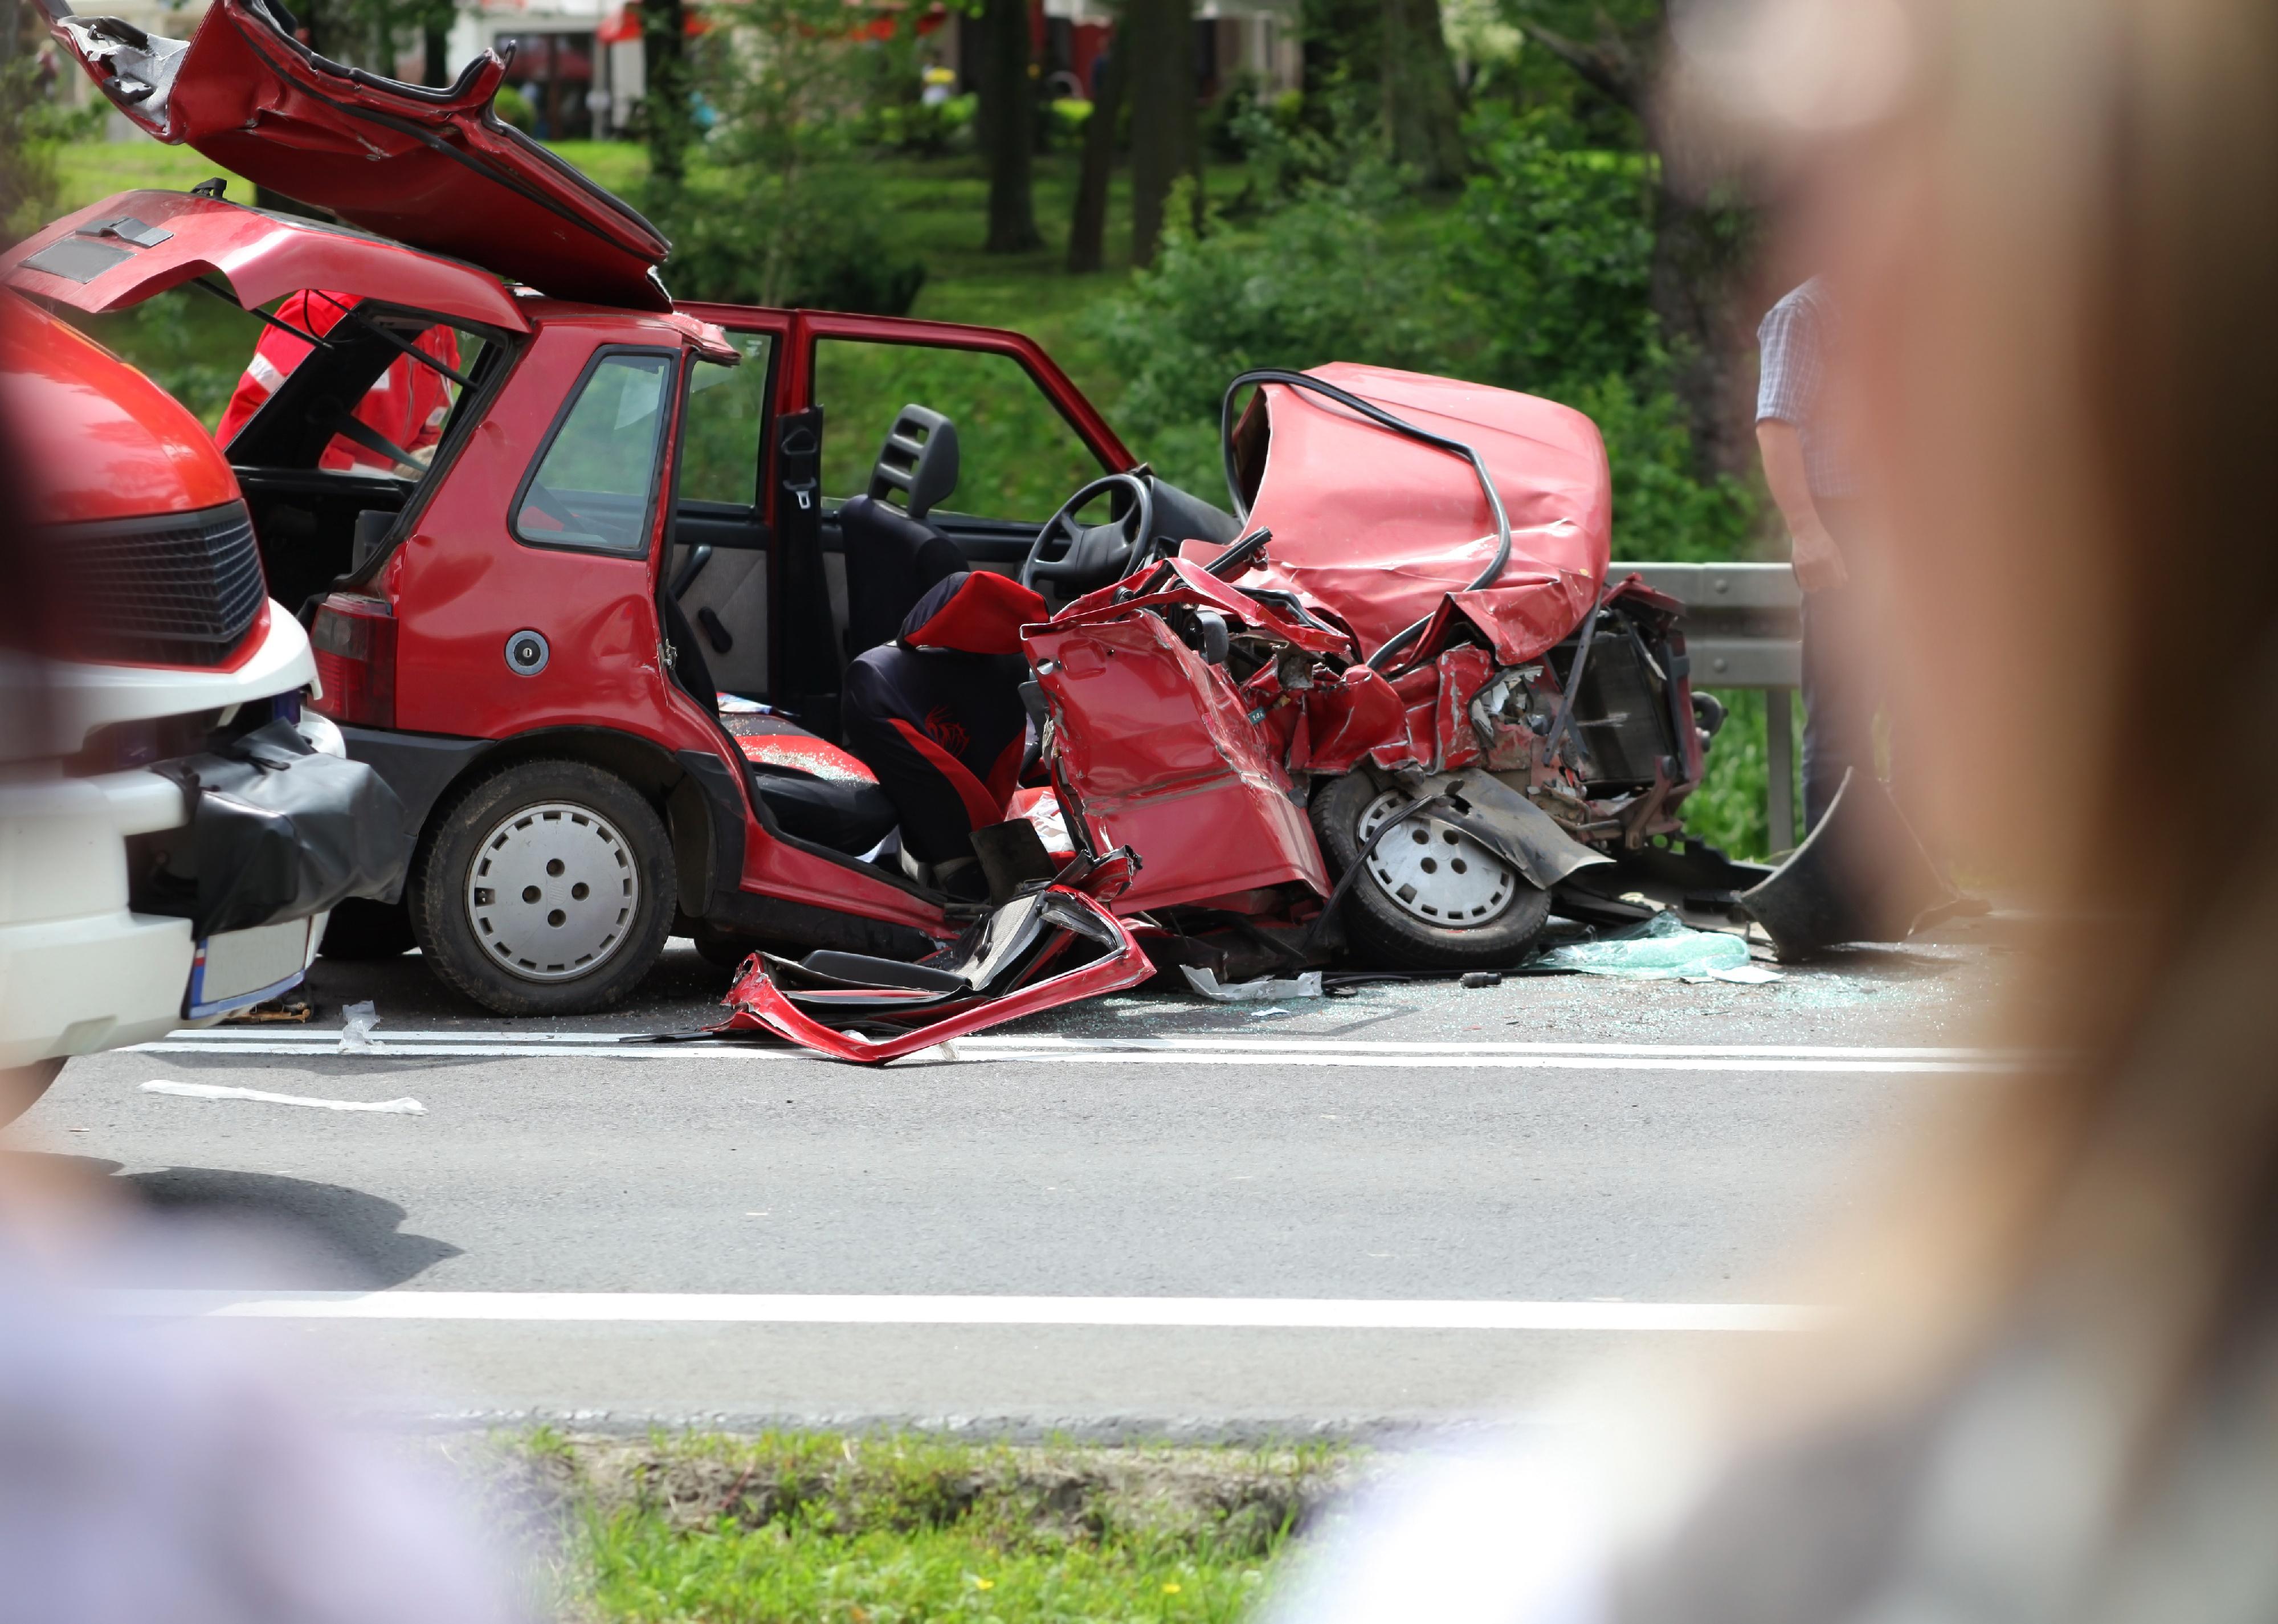
Fatal automobile accident on road, destroyed in a crash.
– Motor vehicle crash fatalities: 13.67 per 100,000 residents (27 total)
– Pedestrian fatalities from vehicle crashes: 5.06 per 100,000 residents (10 total)
Phase4Studios // Shutterstock
#36. Tulsa, Oklahoma
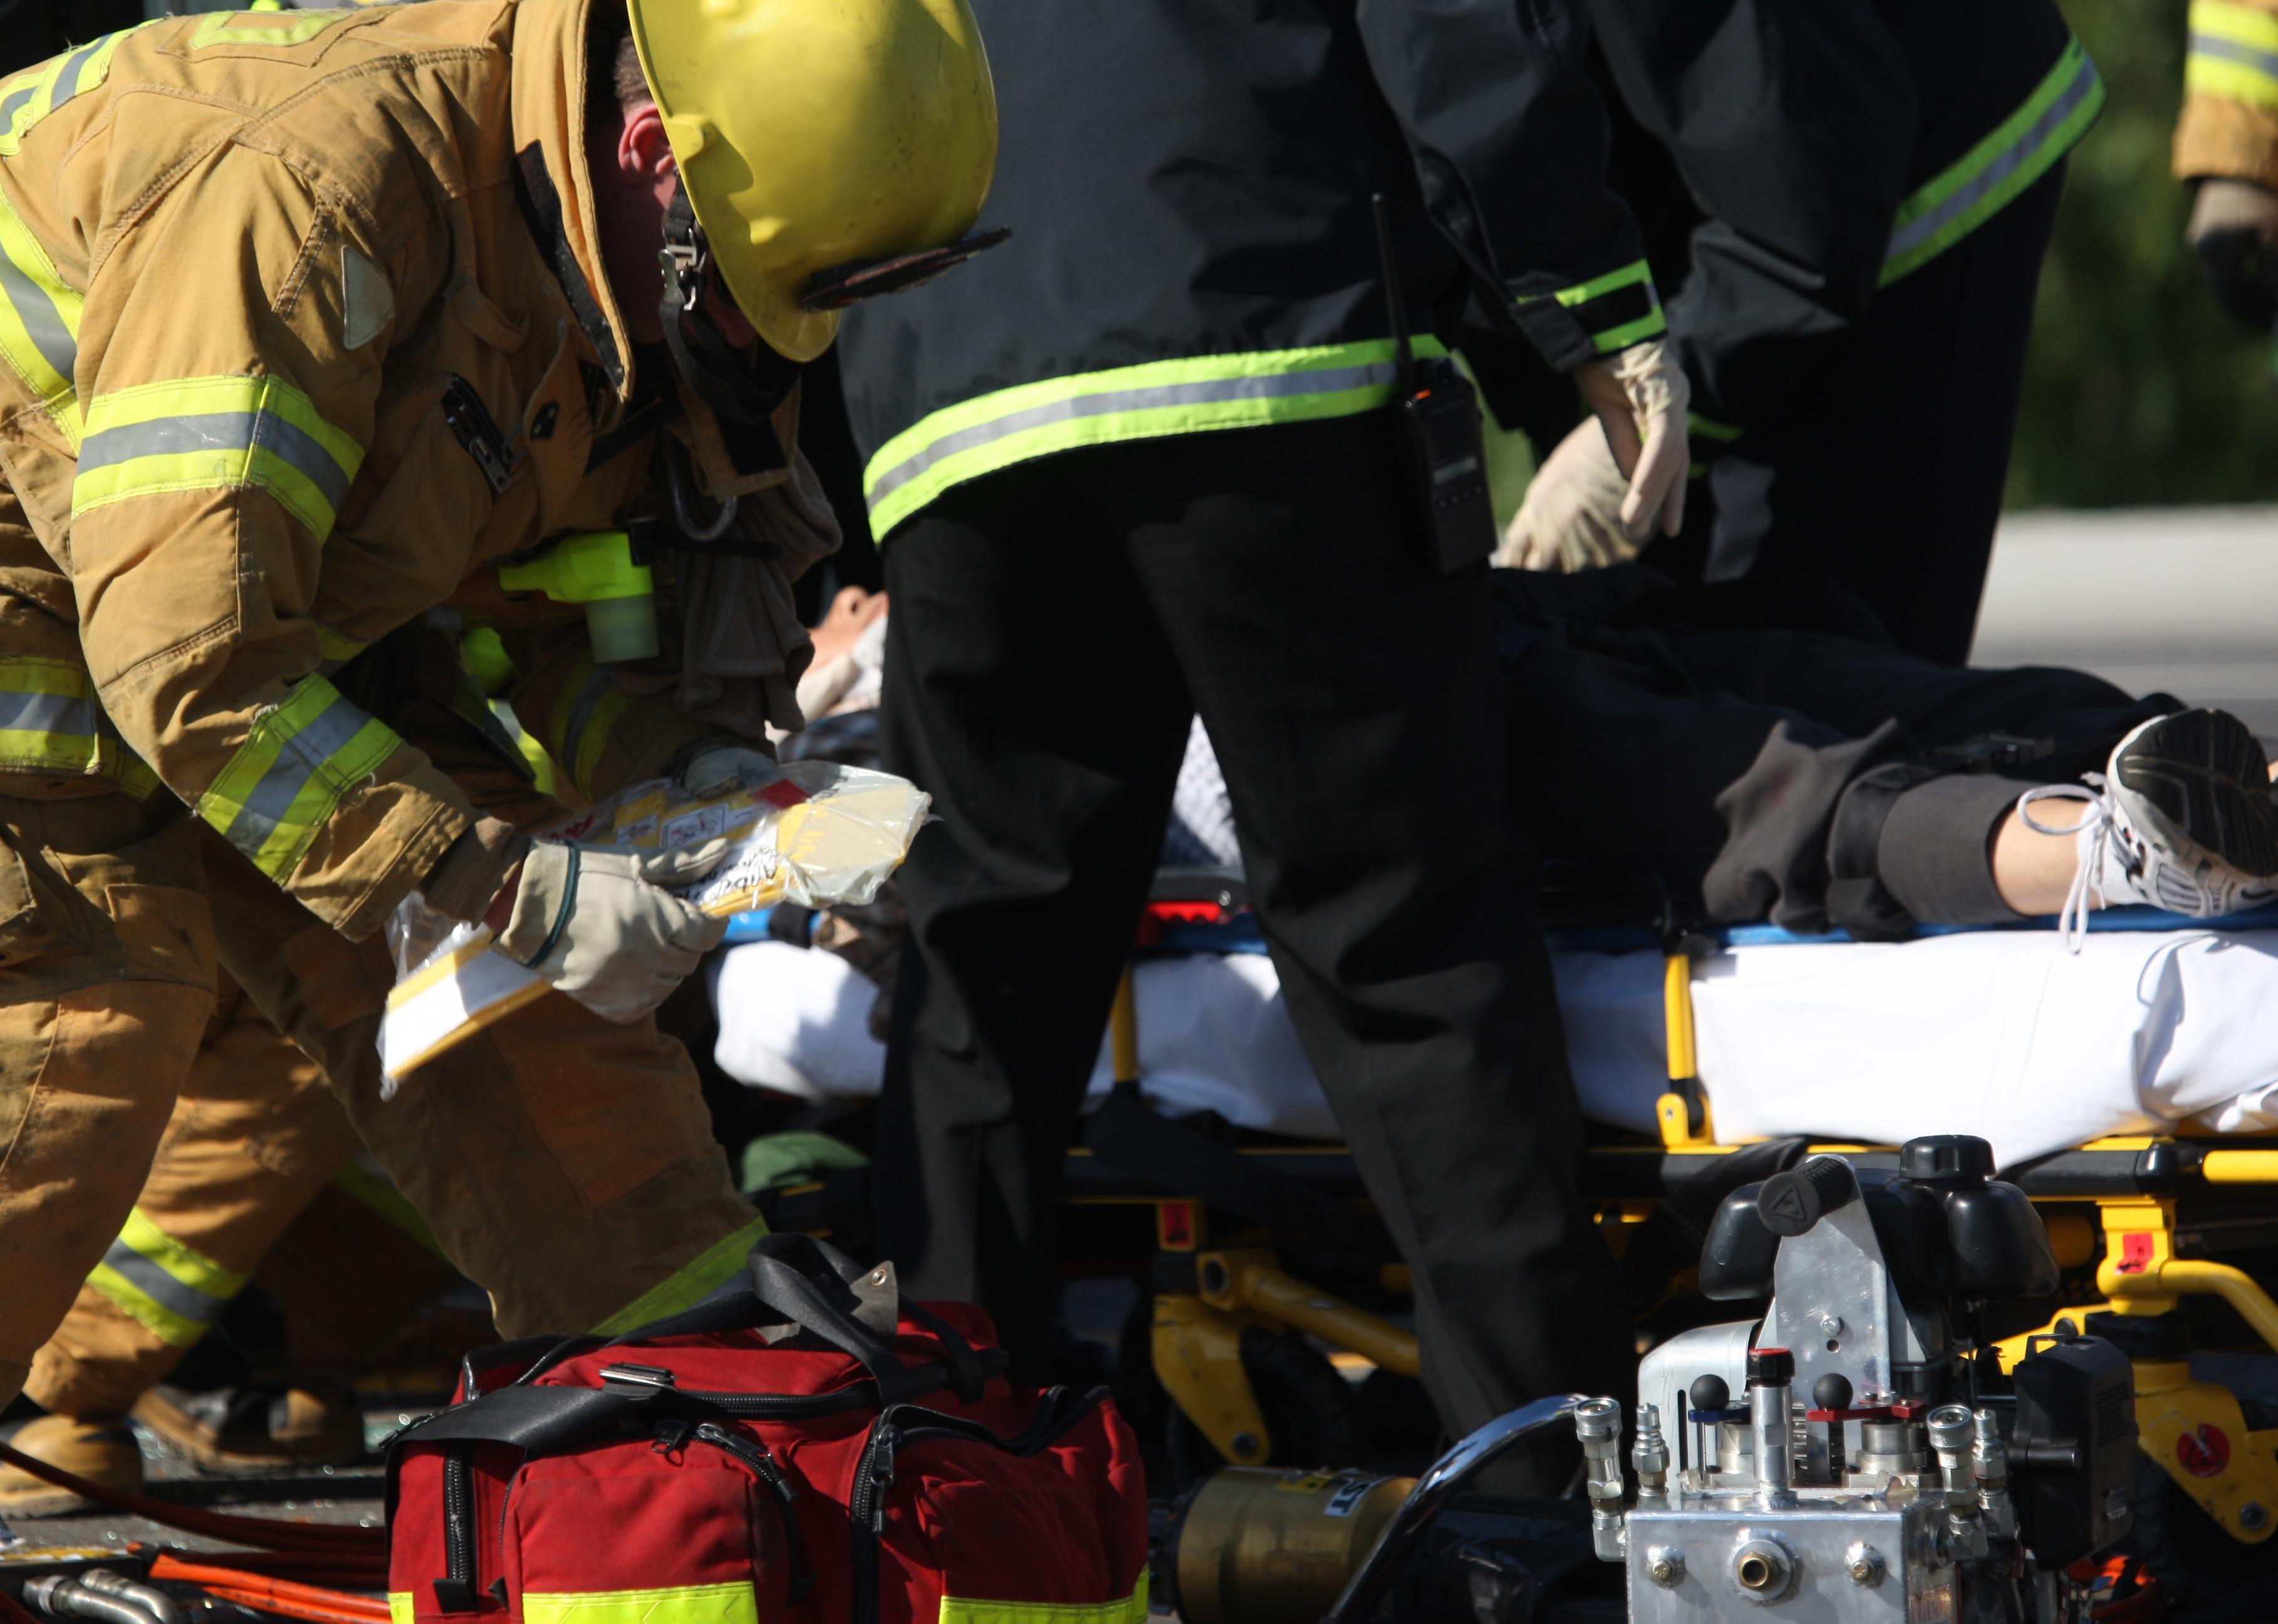
Emergency crew removing a victim from a car accident.
– Motor vehicle crash fatalities: 14.63 per 100,000 residents (59 total)
– Pedestrian fatalities from vehicle crashes: 3.97 per 100,000 residents (16 total)
You may also like: Here’s how much legislation in each state restricts or protects trans youth
Ground Picture // Shutterstock
#35. Fayetteville, North Carolina
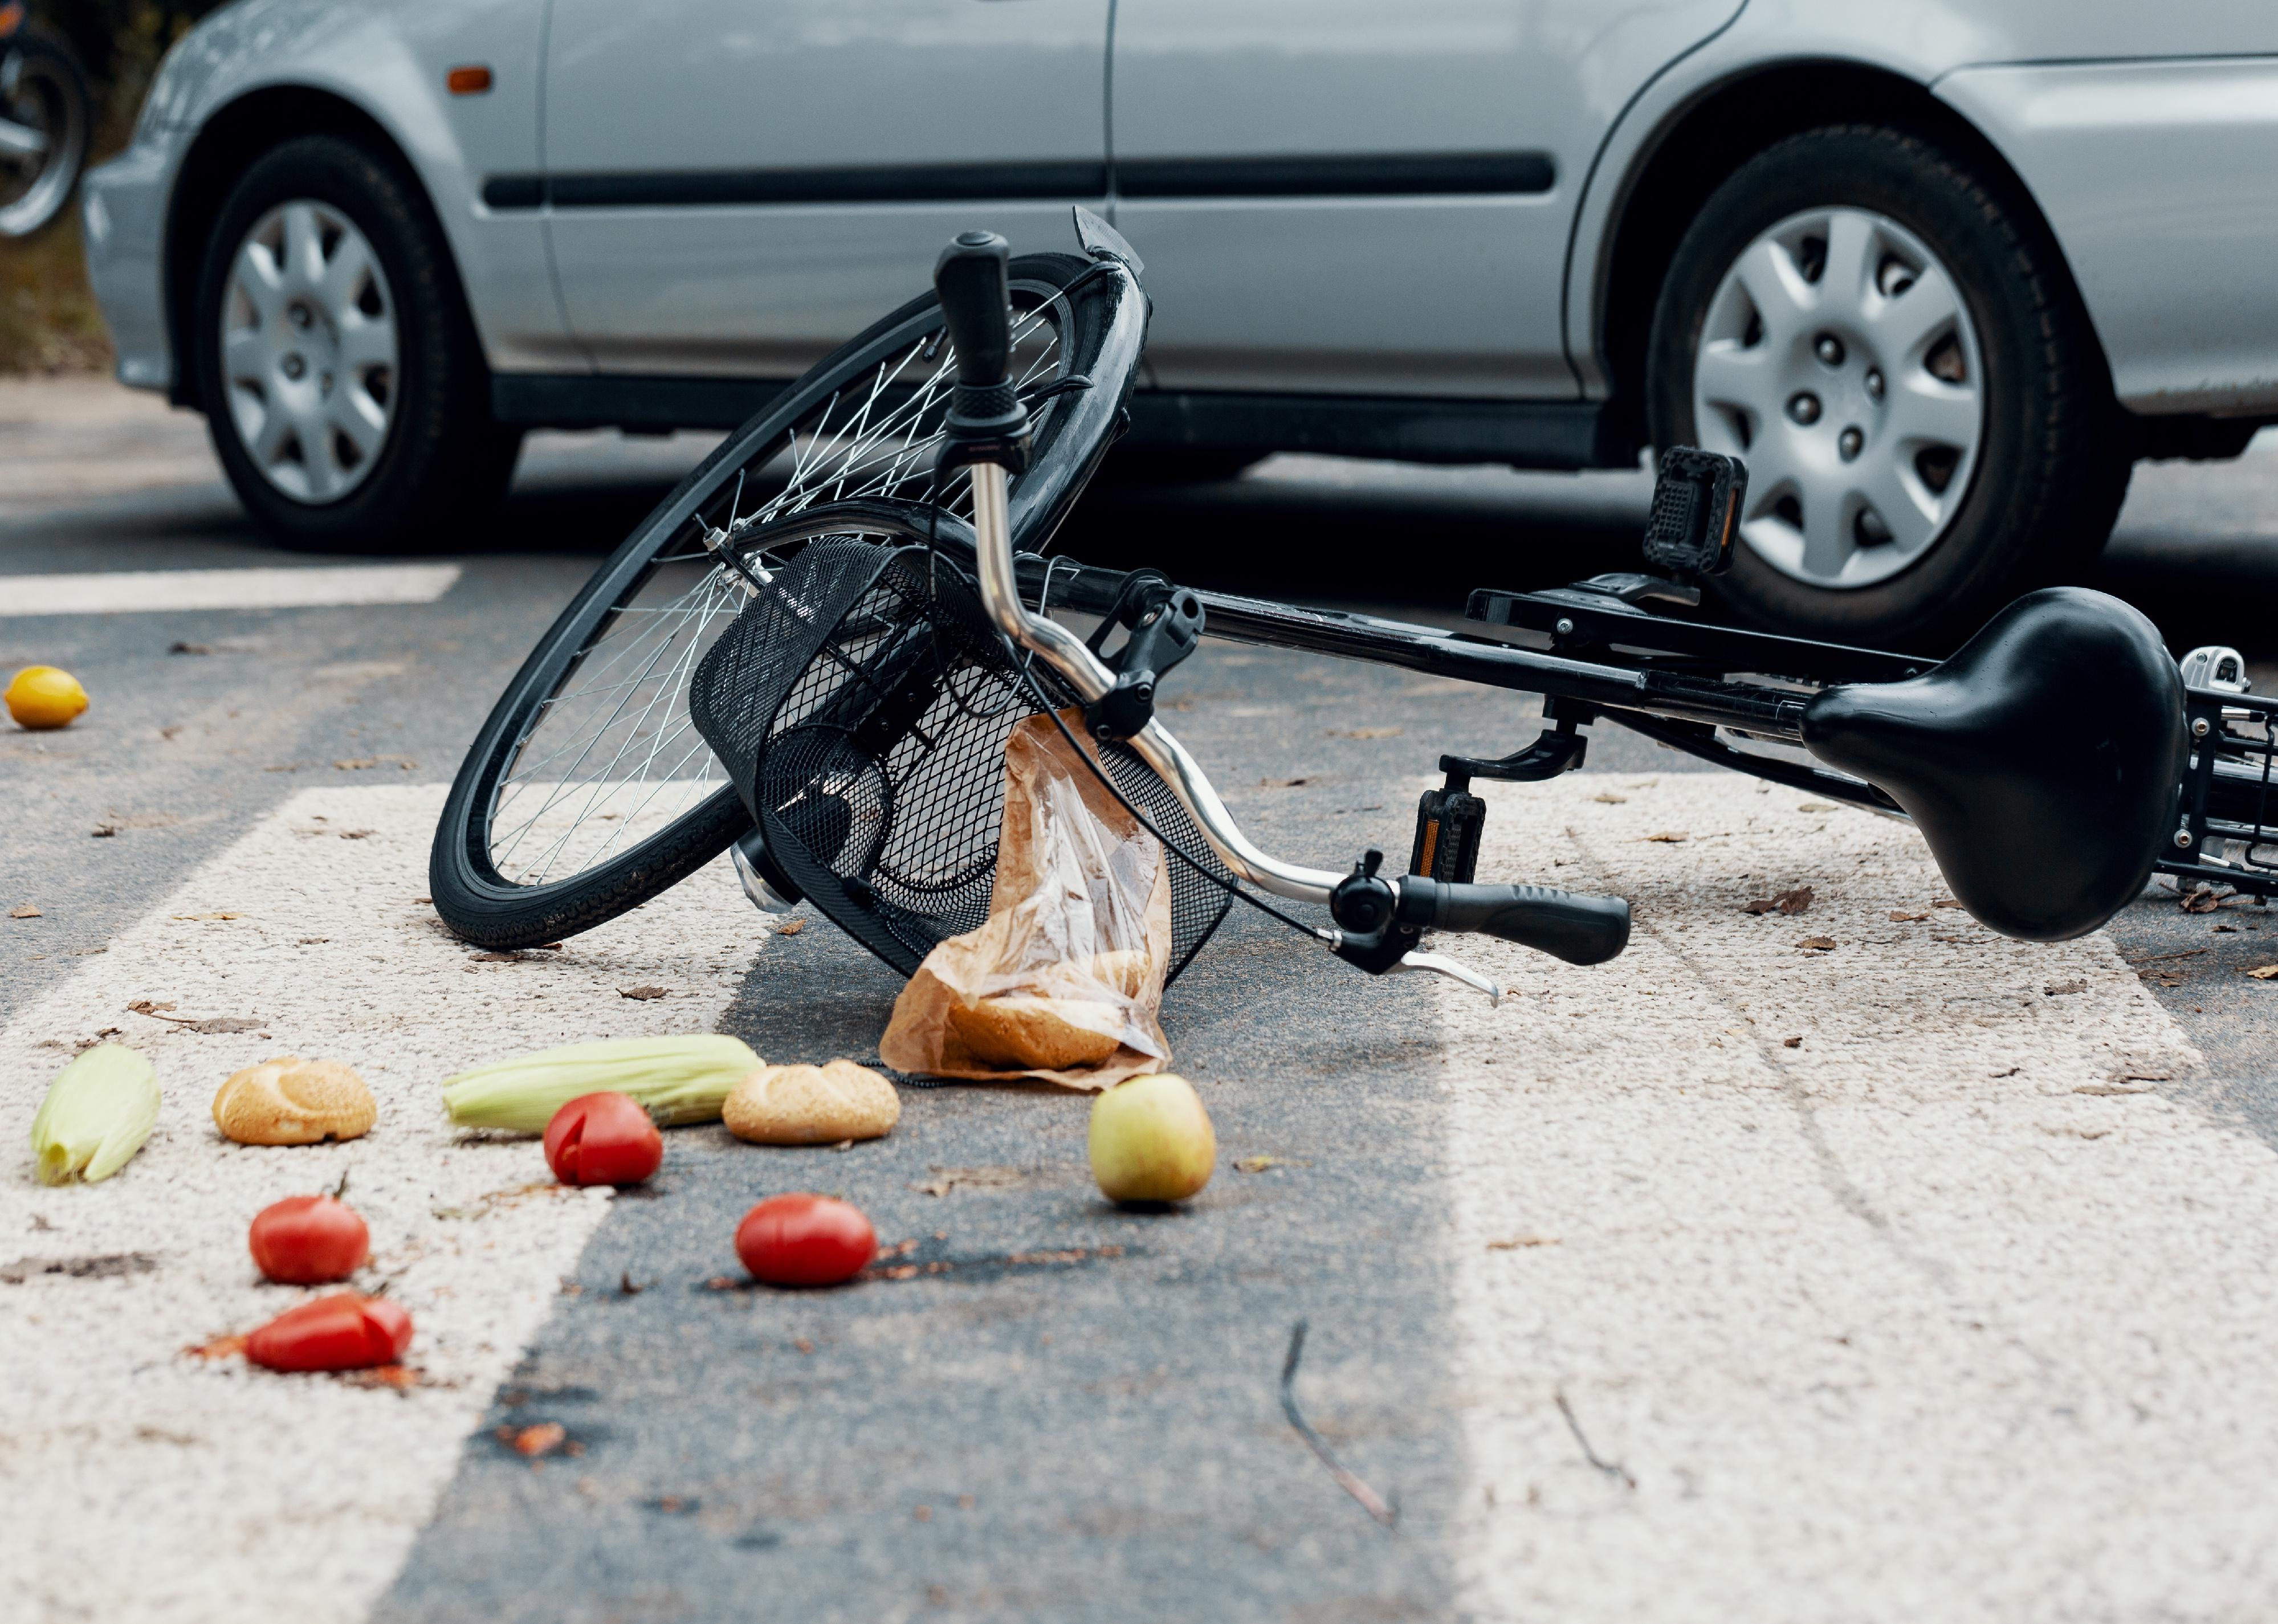
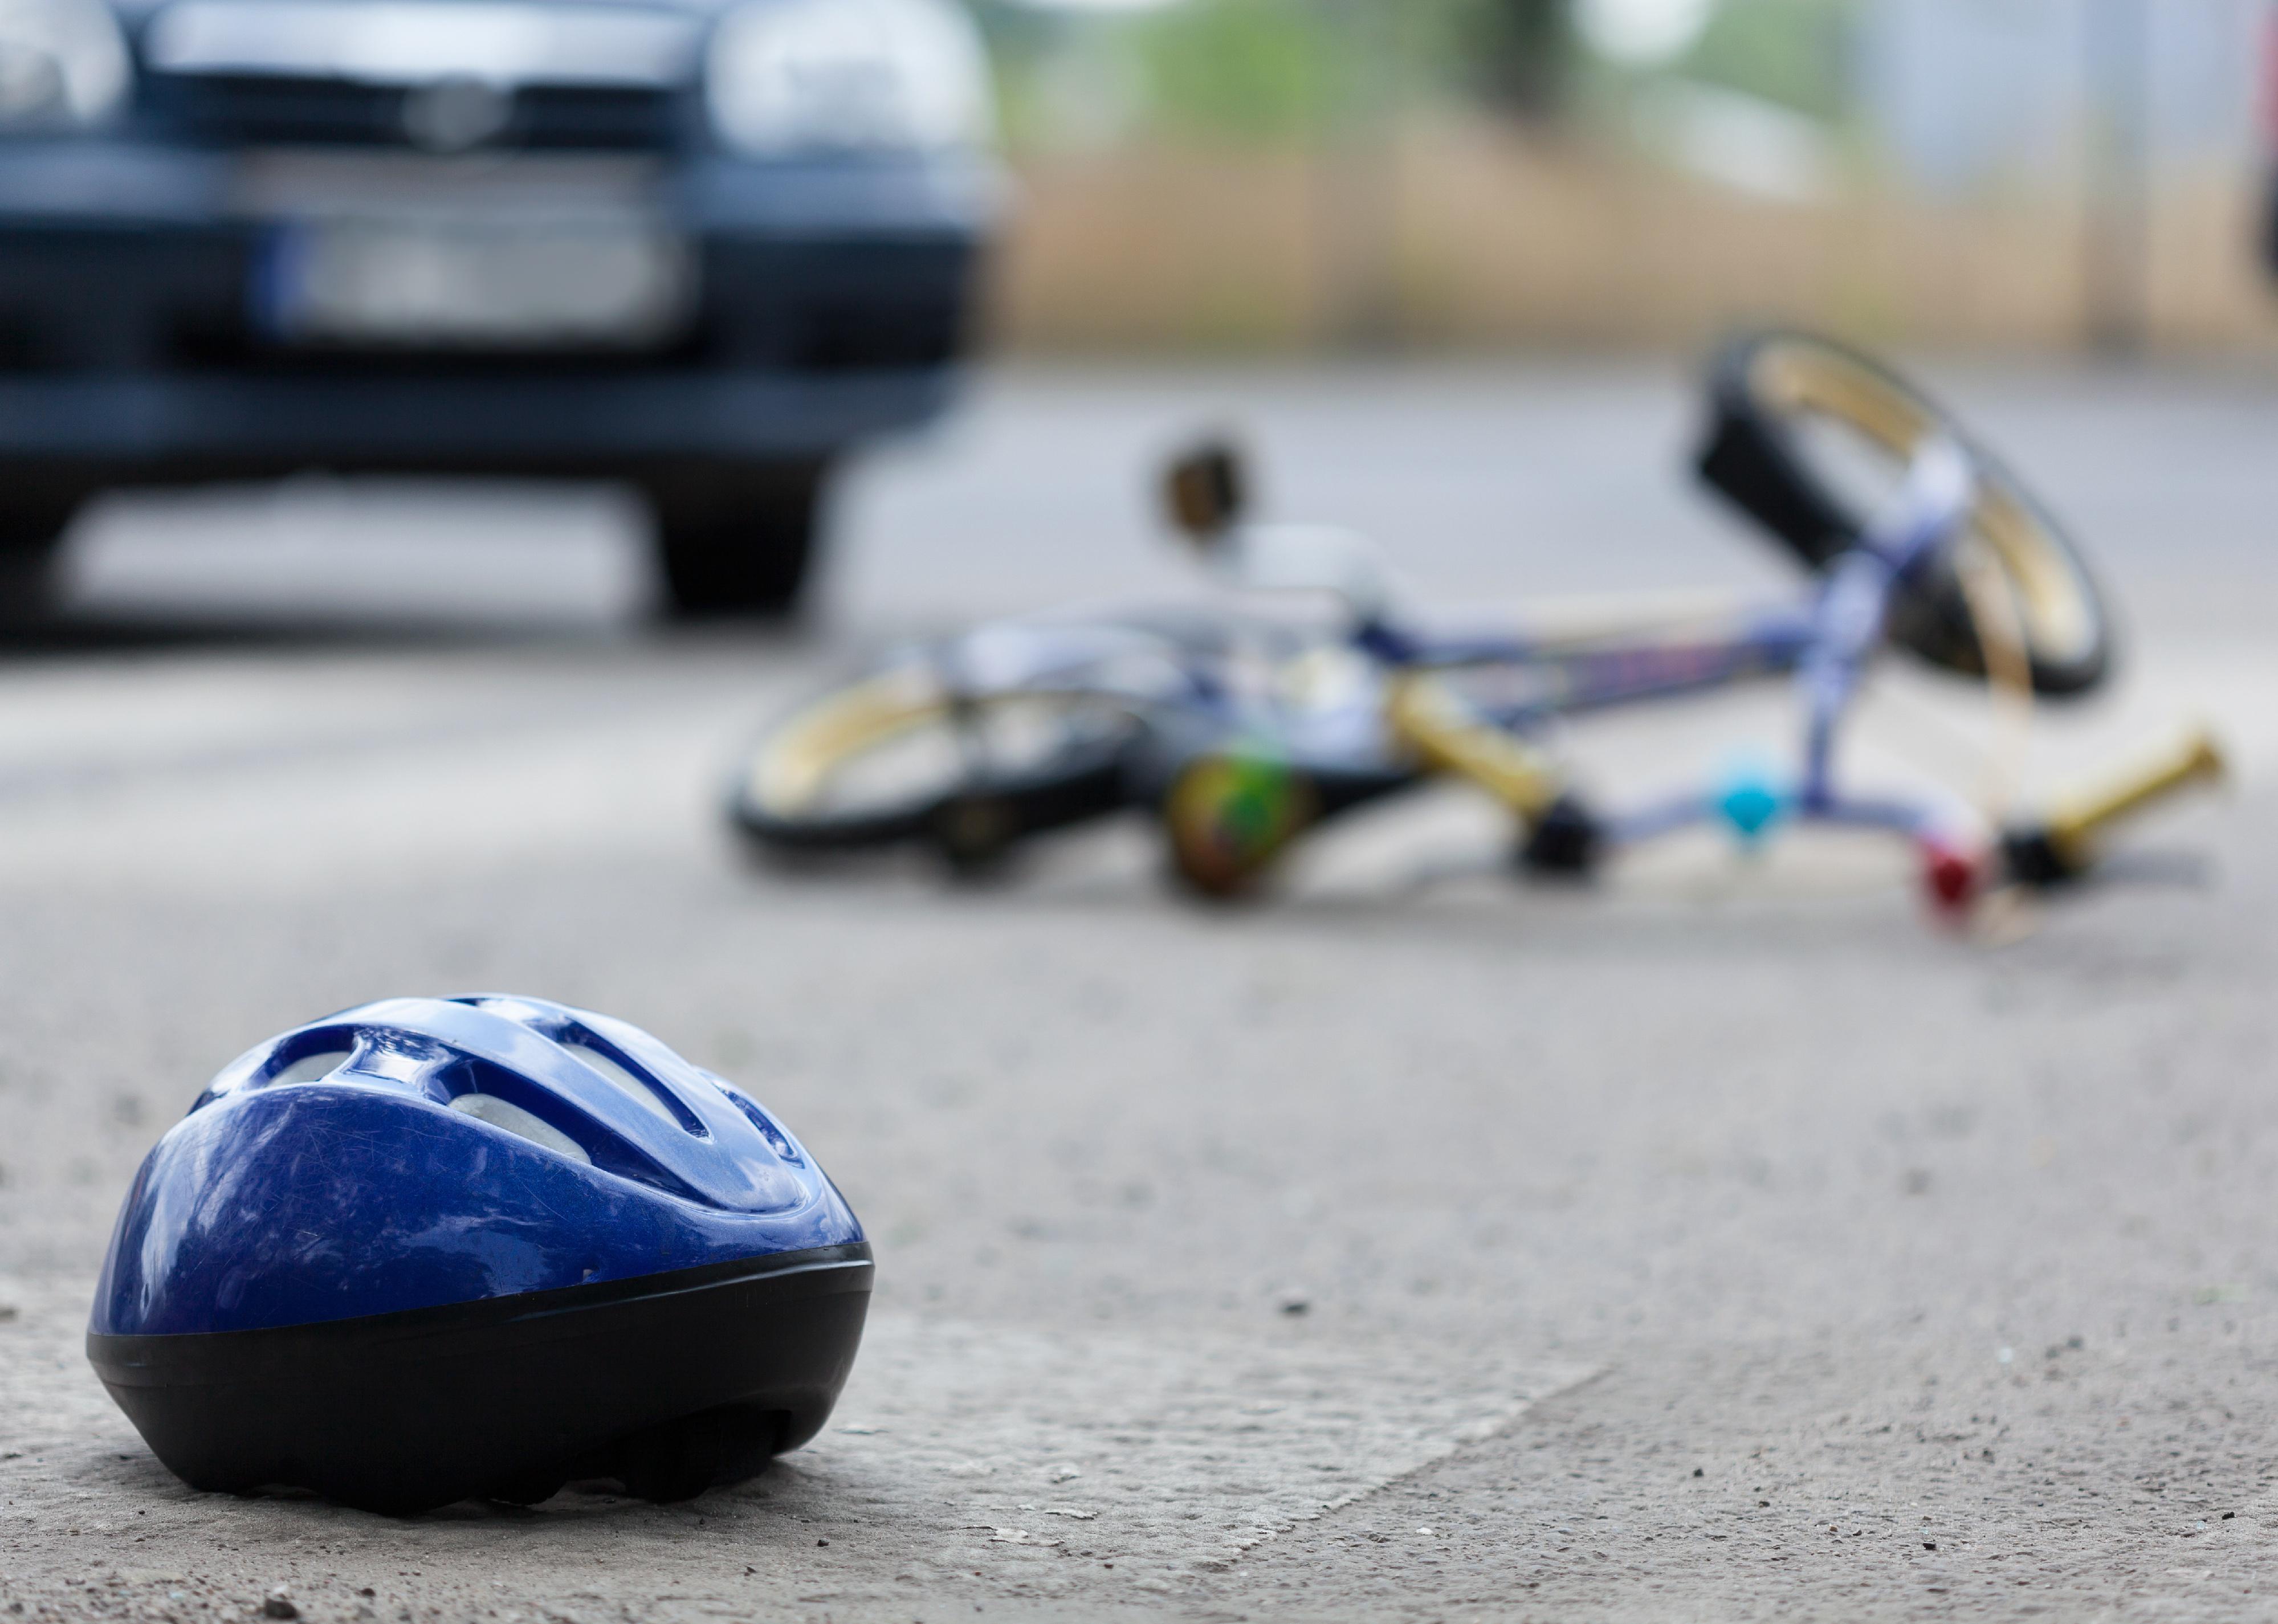
Groceries and broken bike on pedestrian crossing after collision with a car.
– Motor vehicle crash fatalities: 14.64 per 100,000 residents (31 total)
– Pedestrian fatalities from vehicle crashes: 6.14 per 100,000 residents (13 total)

Dmitry Kalinovsky // Shutterstock
#34. Milwaukee
Police car with a flasher in front of damaged truck.
– Motor vehicle crash fatalities: 14.77 per 100,000 residents (87 total)
– Pedestrian fatalities from vehicle crashes: 2.55 per 100,000 residents (15 total)
Zoran Ras // Shutterstock
#33. Akron, Ohio
Blurred photo of a motorcyle accident scene.
– Motor vehicle crash fatalities: 14.80 per 100,000 residents (29 total)
– Pedestrian fatalities from vehicle crashes: 2.04 per 100,000 residents (4 total)
Nutnaree Saingwongwattana// Shutterstock
#32. Hollywood, Florida
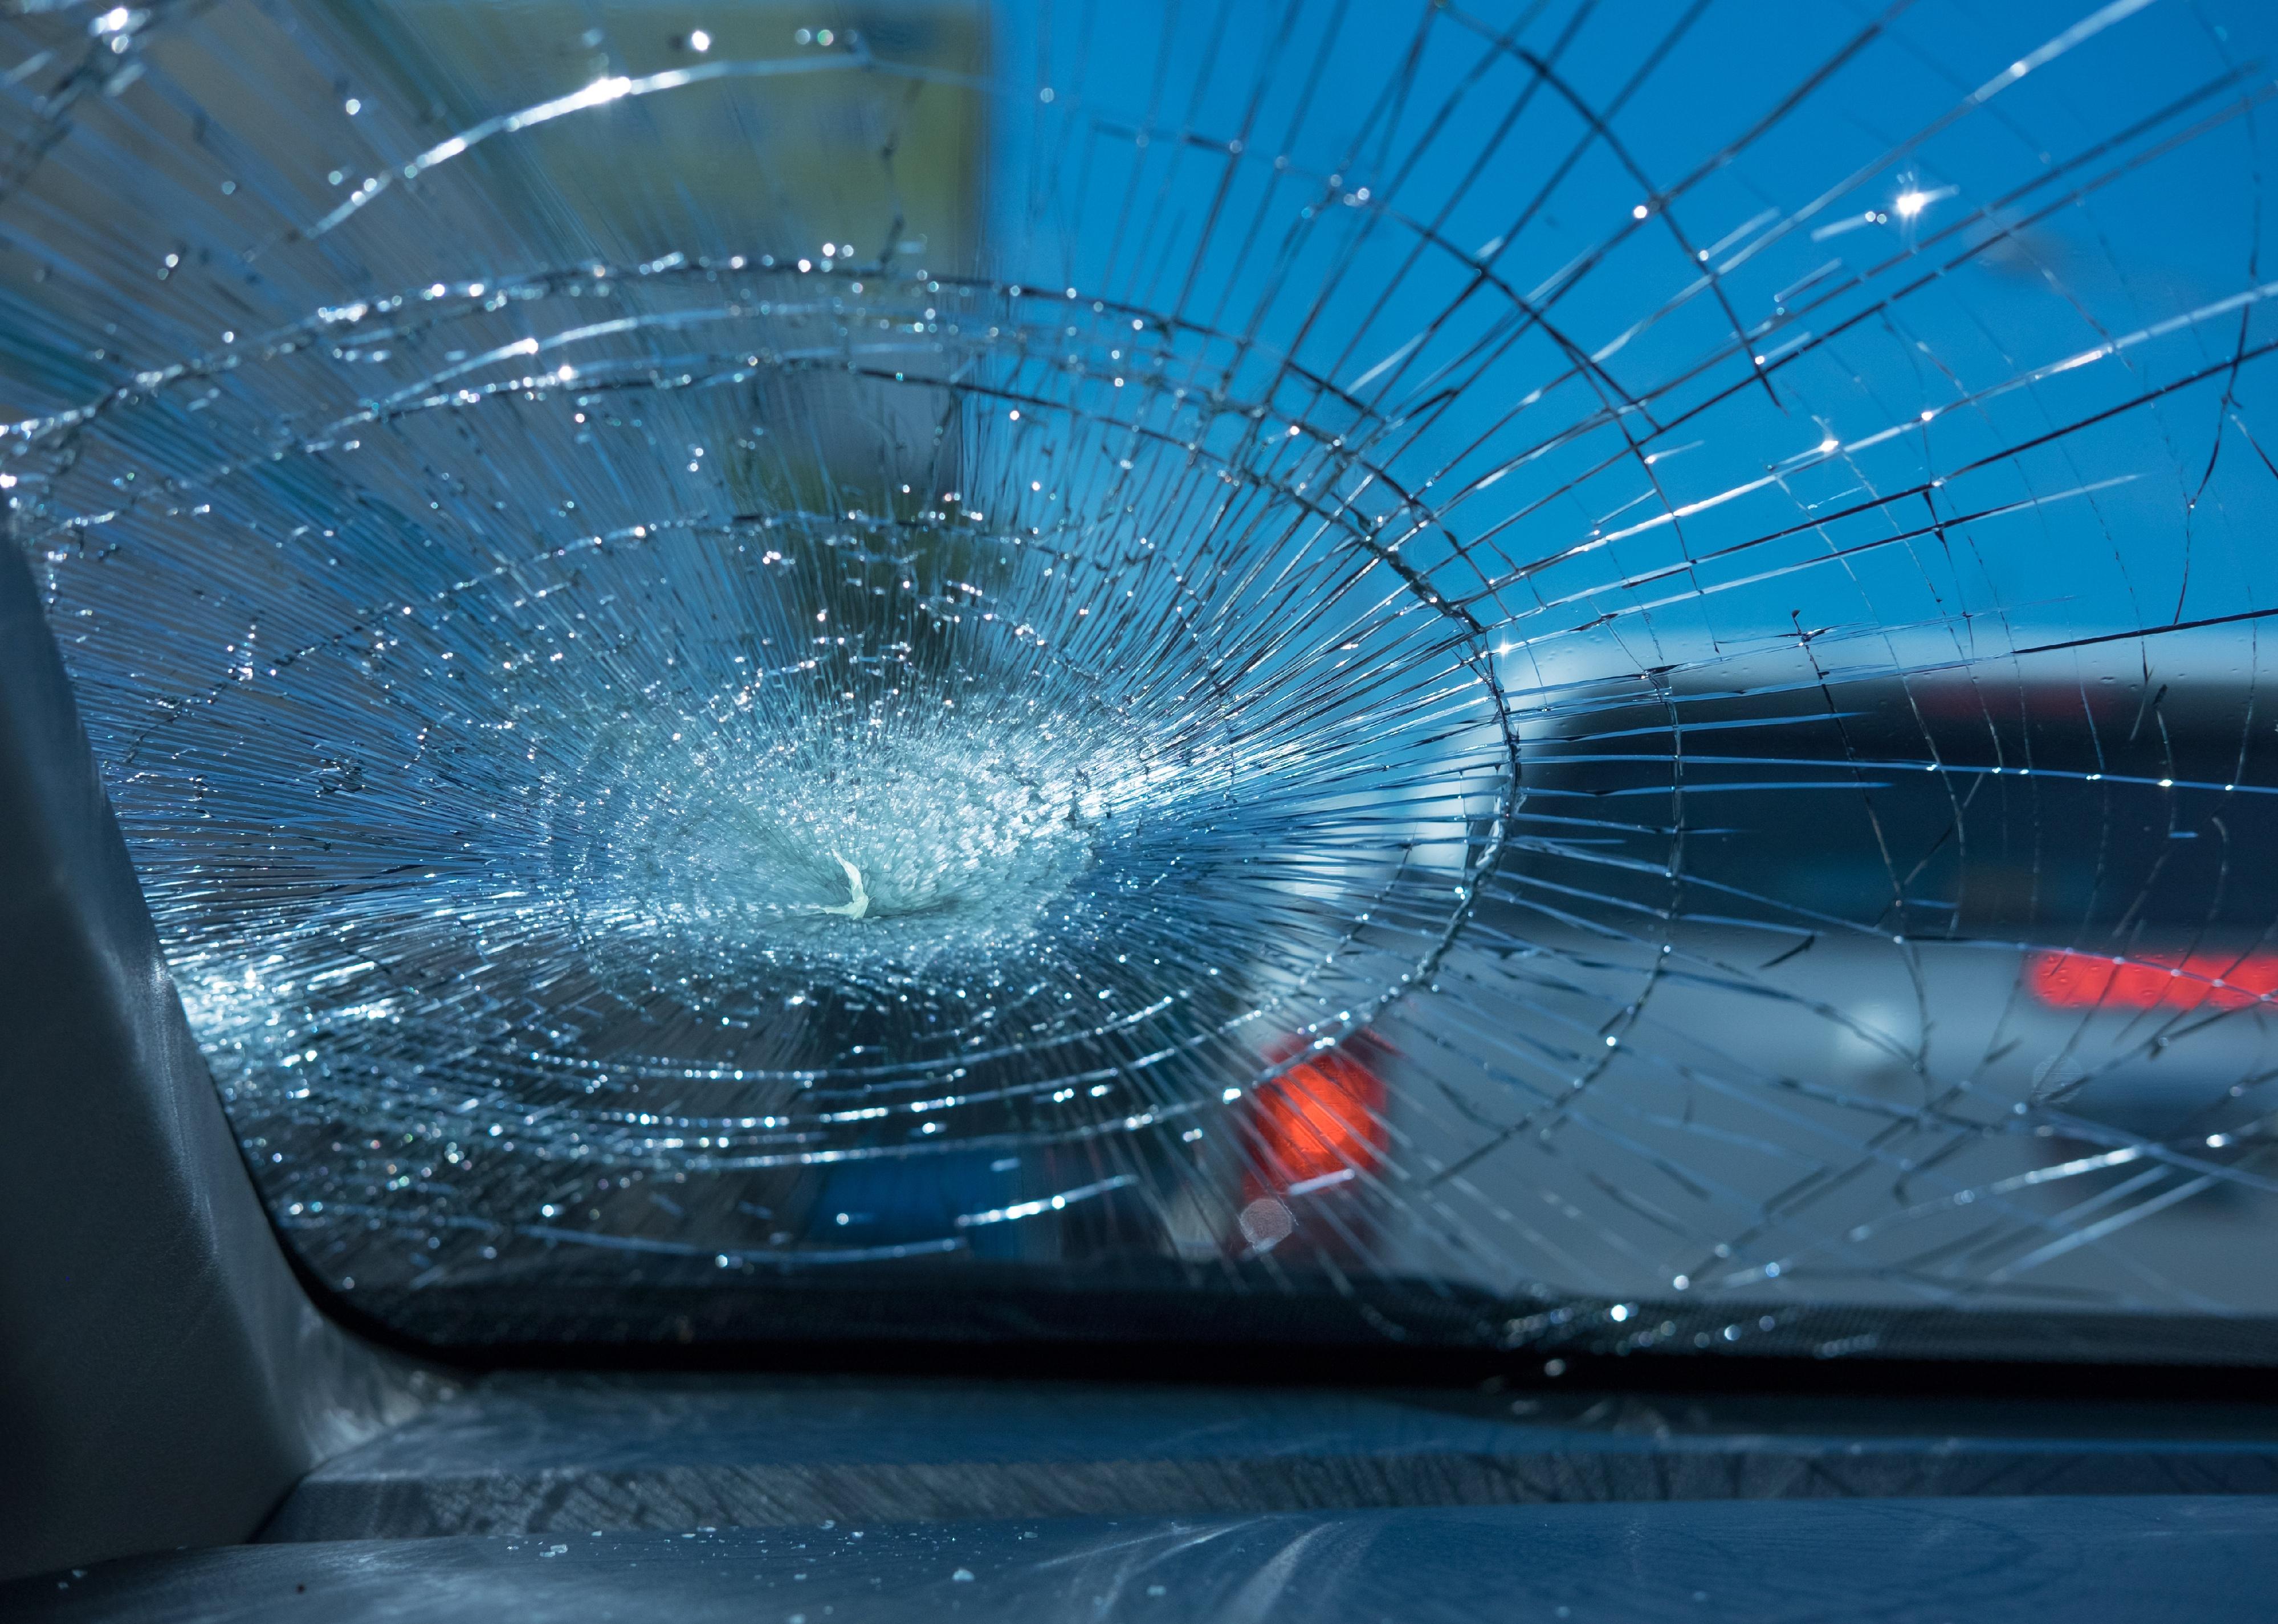
Inside of a car with shattered glass.
– Motor vehicle crash fatalities: 14.88 per 100,000 residents (23 total)
– Pedestrian fatalities from vehicle crashes: 2.59 per 100,000 residents (4 total)

rdjan Randjelovic // Shutterstock
#31. Mobile, Alabama
Artificial white roses flowers on the site of a car crash.
– Motor vehicle crash fatalities: 14.91 per 100,000 residents (28 total)
– Pedestrian fatalities from vehicle crashes: 2.66 per 100,000 residents (5 total)
You may also like: How cellphone use while driving has changed in America in the last 20 years
Aedonis // Shutterstock
#30. Kansas City, Kansas
Warped, flattened white car after a car accident.
– Motor vehicle crash fatalities: 15.06 per 100,000 residents (23 total)
– Pedestrian fatalities from vehicle crashes: 2.62 per 100,000 residents (4 total)
Ground Picture // Shutterstock
#29. Indianapolis
Close-up of a bicycle accident on the city street.
– Motor vehicle crash fatalities: 15.26 per 100,000 residents (134 total)
– Pedestrian fatalities from vehicle crashes: 4.44 per 100,000 residents (39 total)
Wangkun Jia // Shutterstock
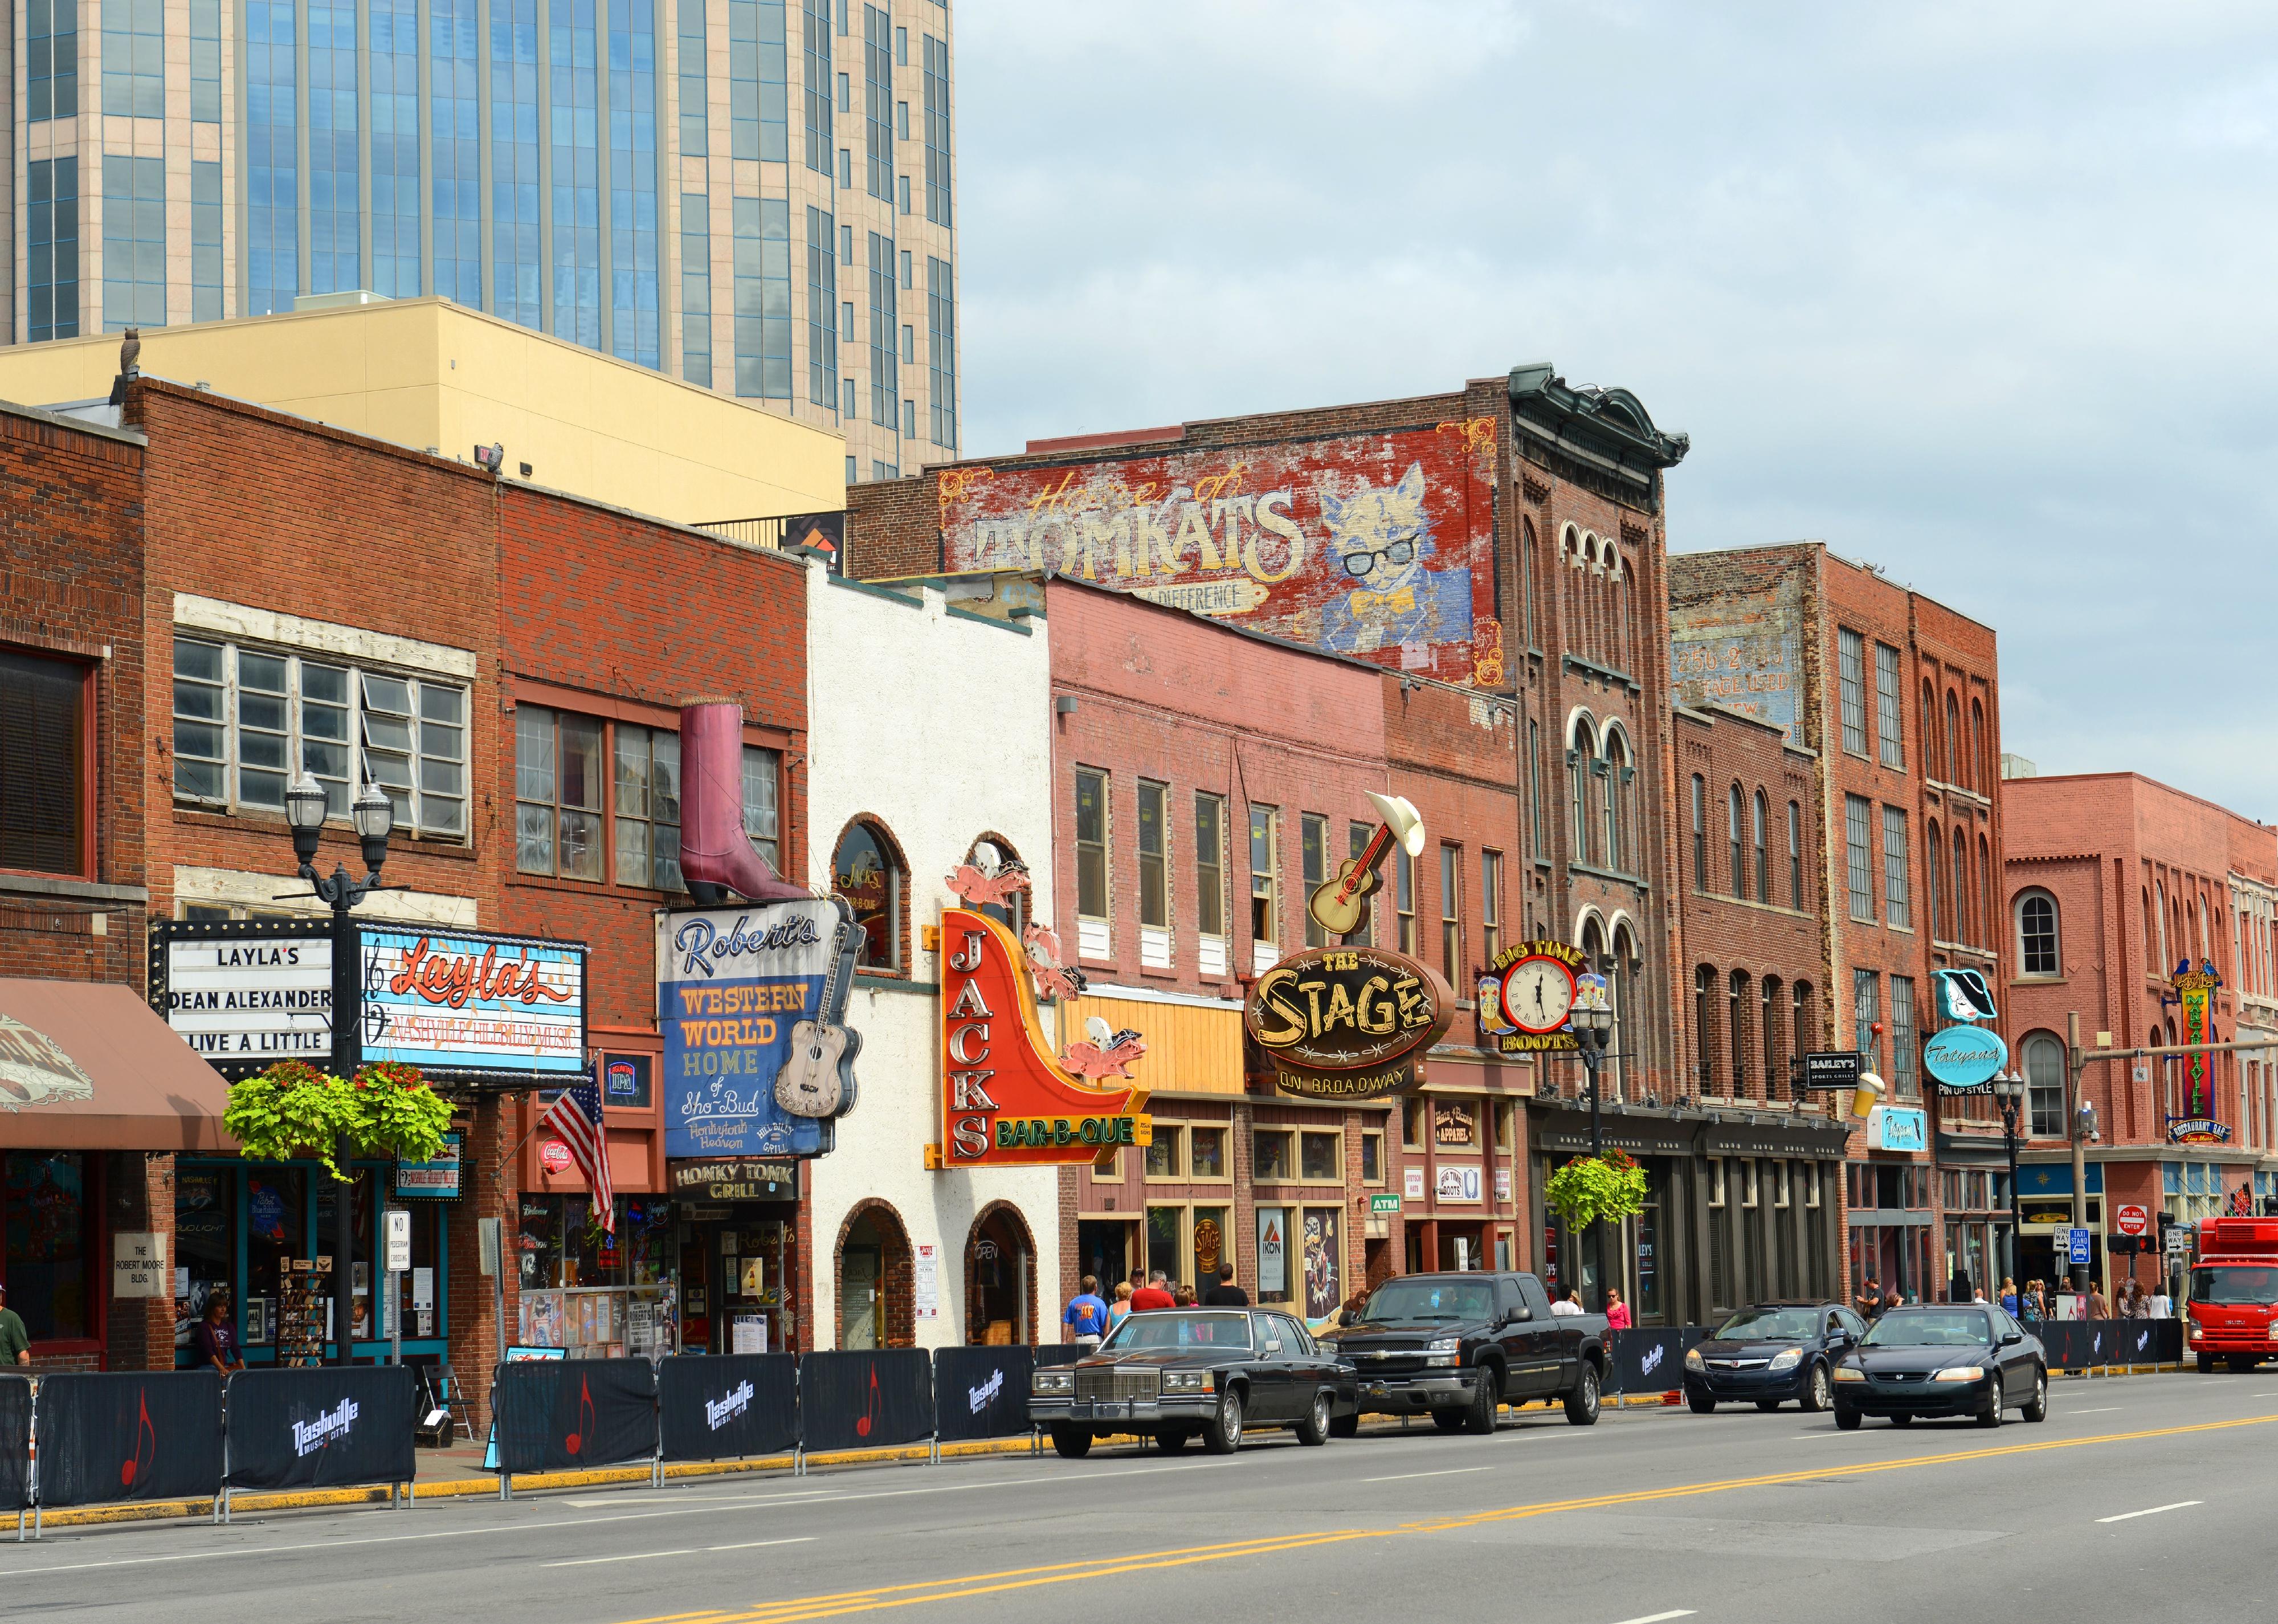
#28. Nashville-Davidson metro, Tennessee
Bars on historical Broadway in downtown Nashville.
– Motor vehicle crash fatalities: 15.49 per 100,000 residents (104 total)
– Pedestrian fatalities from vehicle crashes: 5.51 per 100,000 residents (37 total)
Lopolo // Shutterstock
#27. Orlando, Florida
Low angle of a car accident scene.
– Motor vehicle crash fatalities: 15.55 per 100,000 residents (45 total)
– Pedestrian fatalities from vehicle crashes: 3.80 per 100,000 residents (11 total)
Ground Picture // Shutterstock
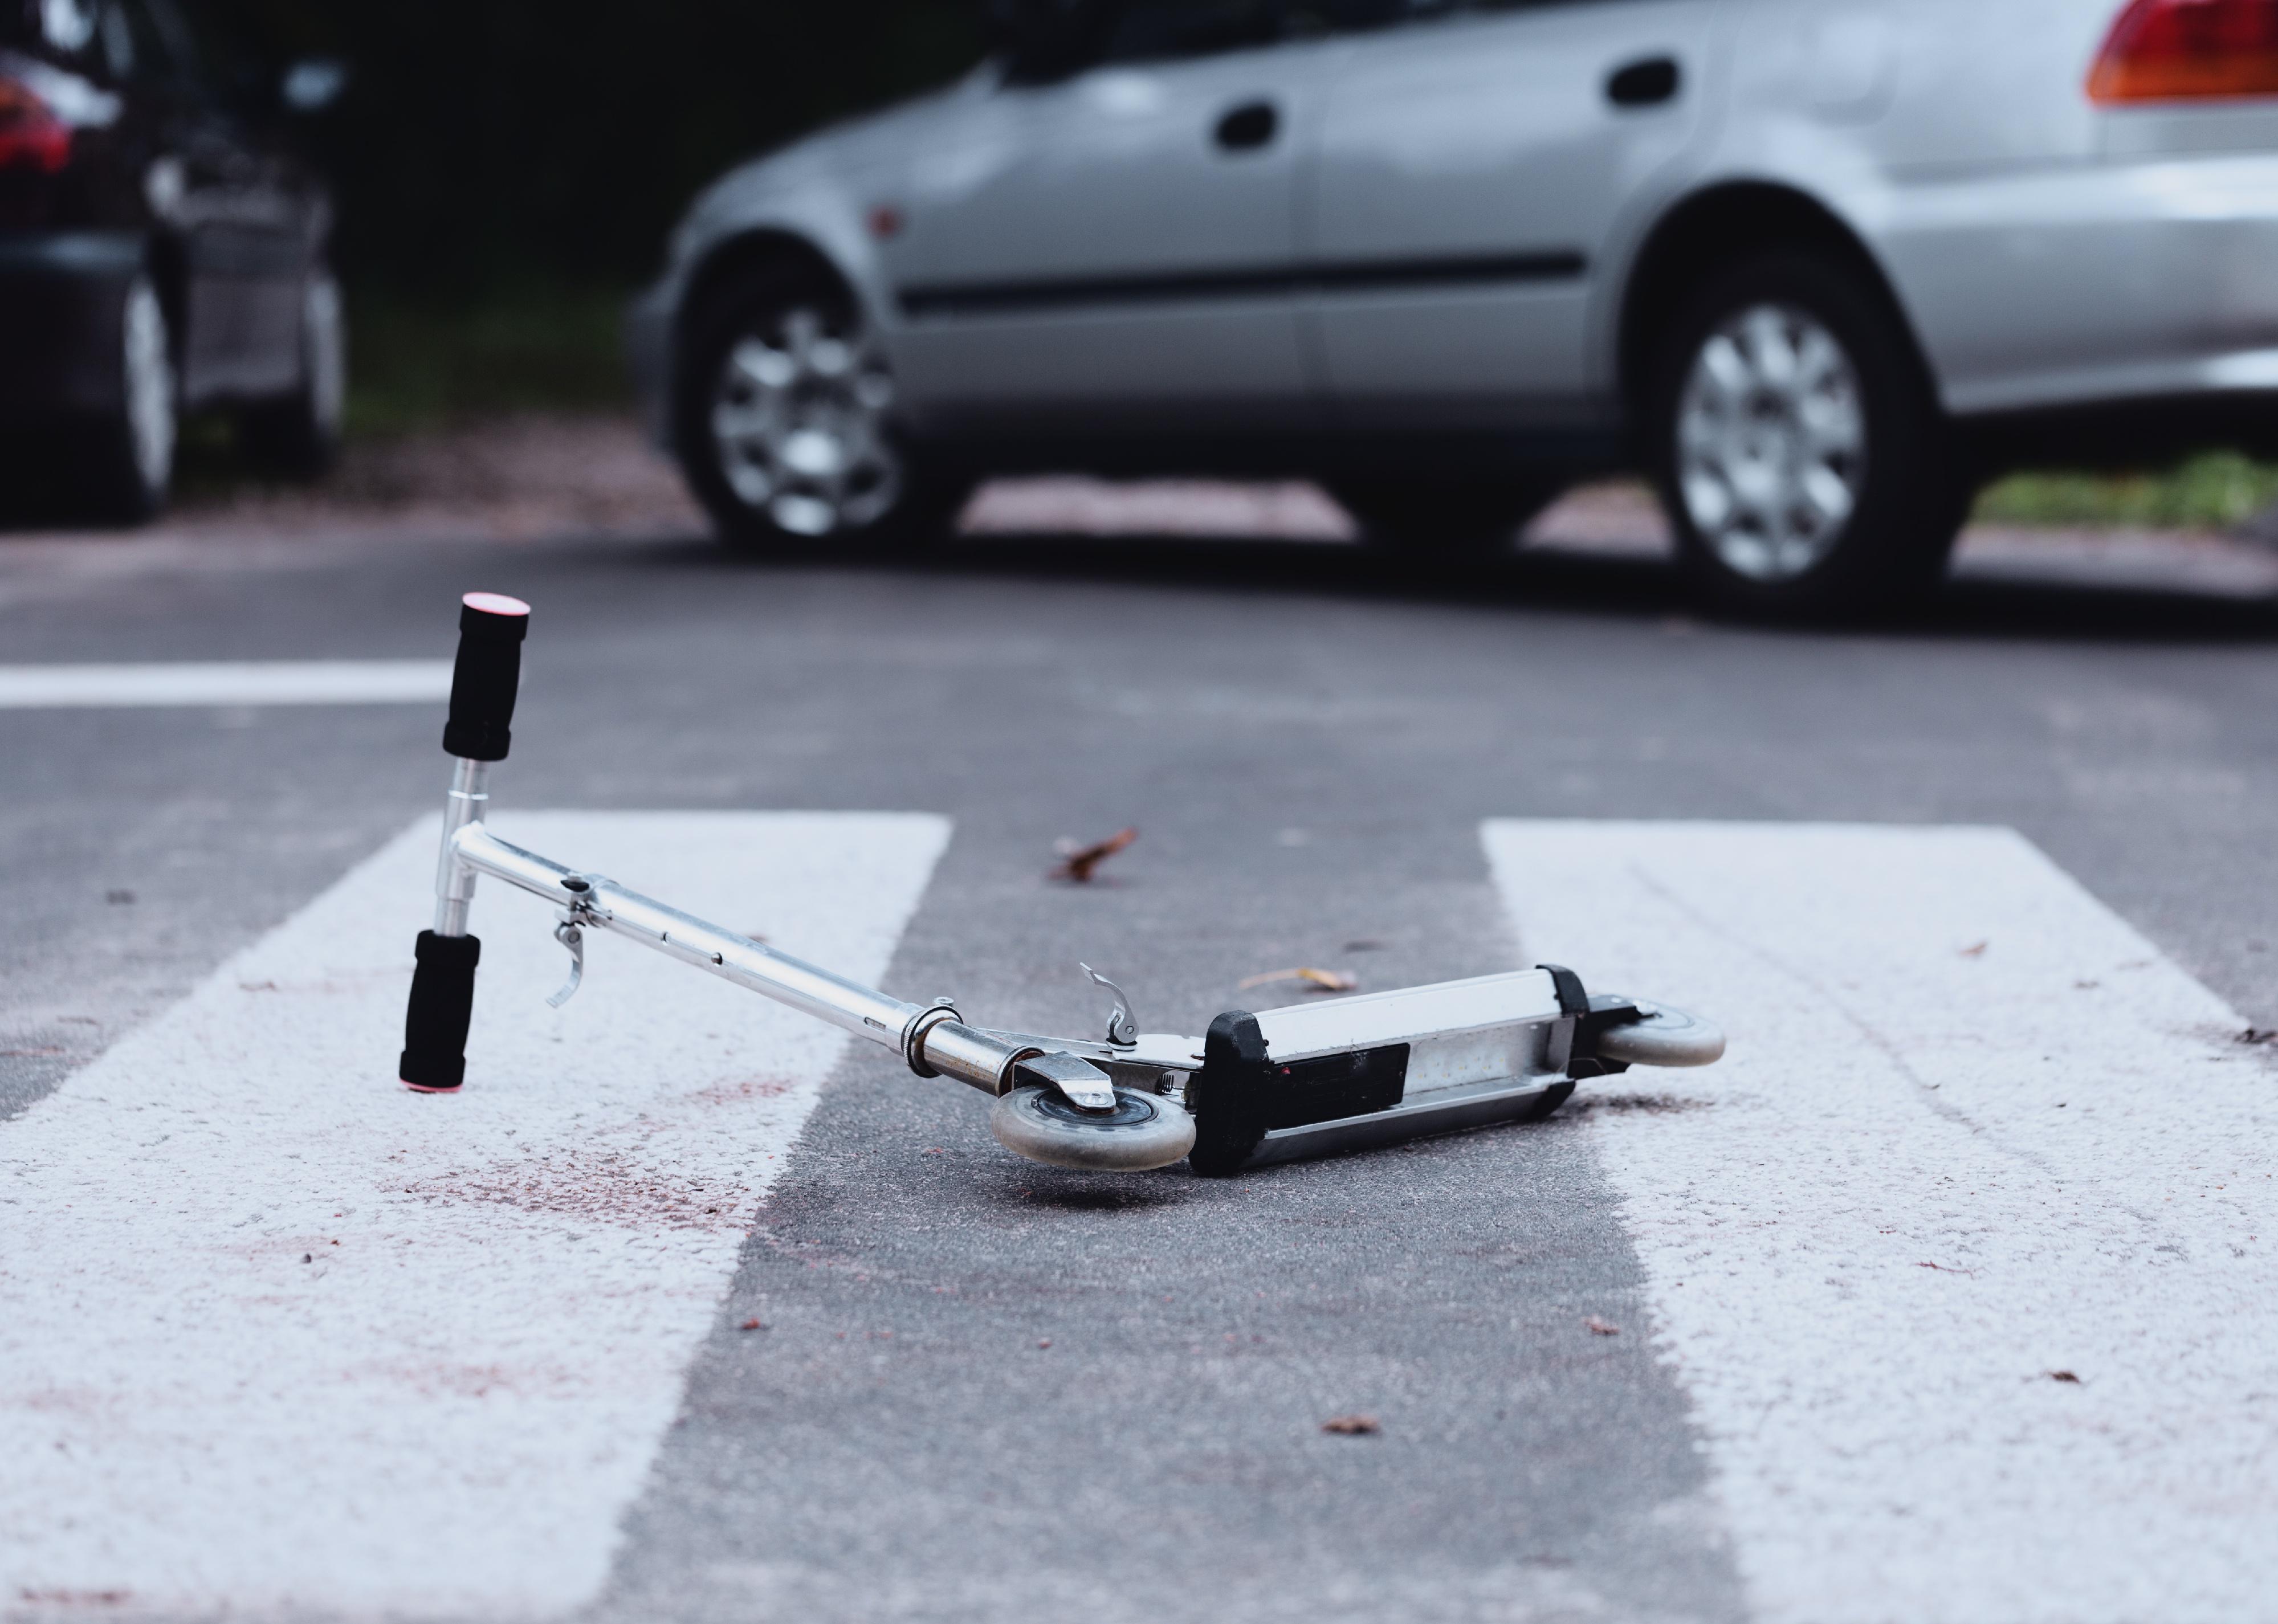
#26. Tampa, Florida
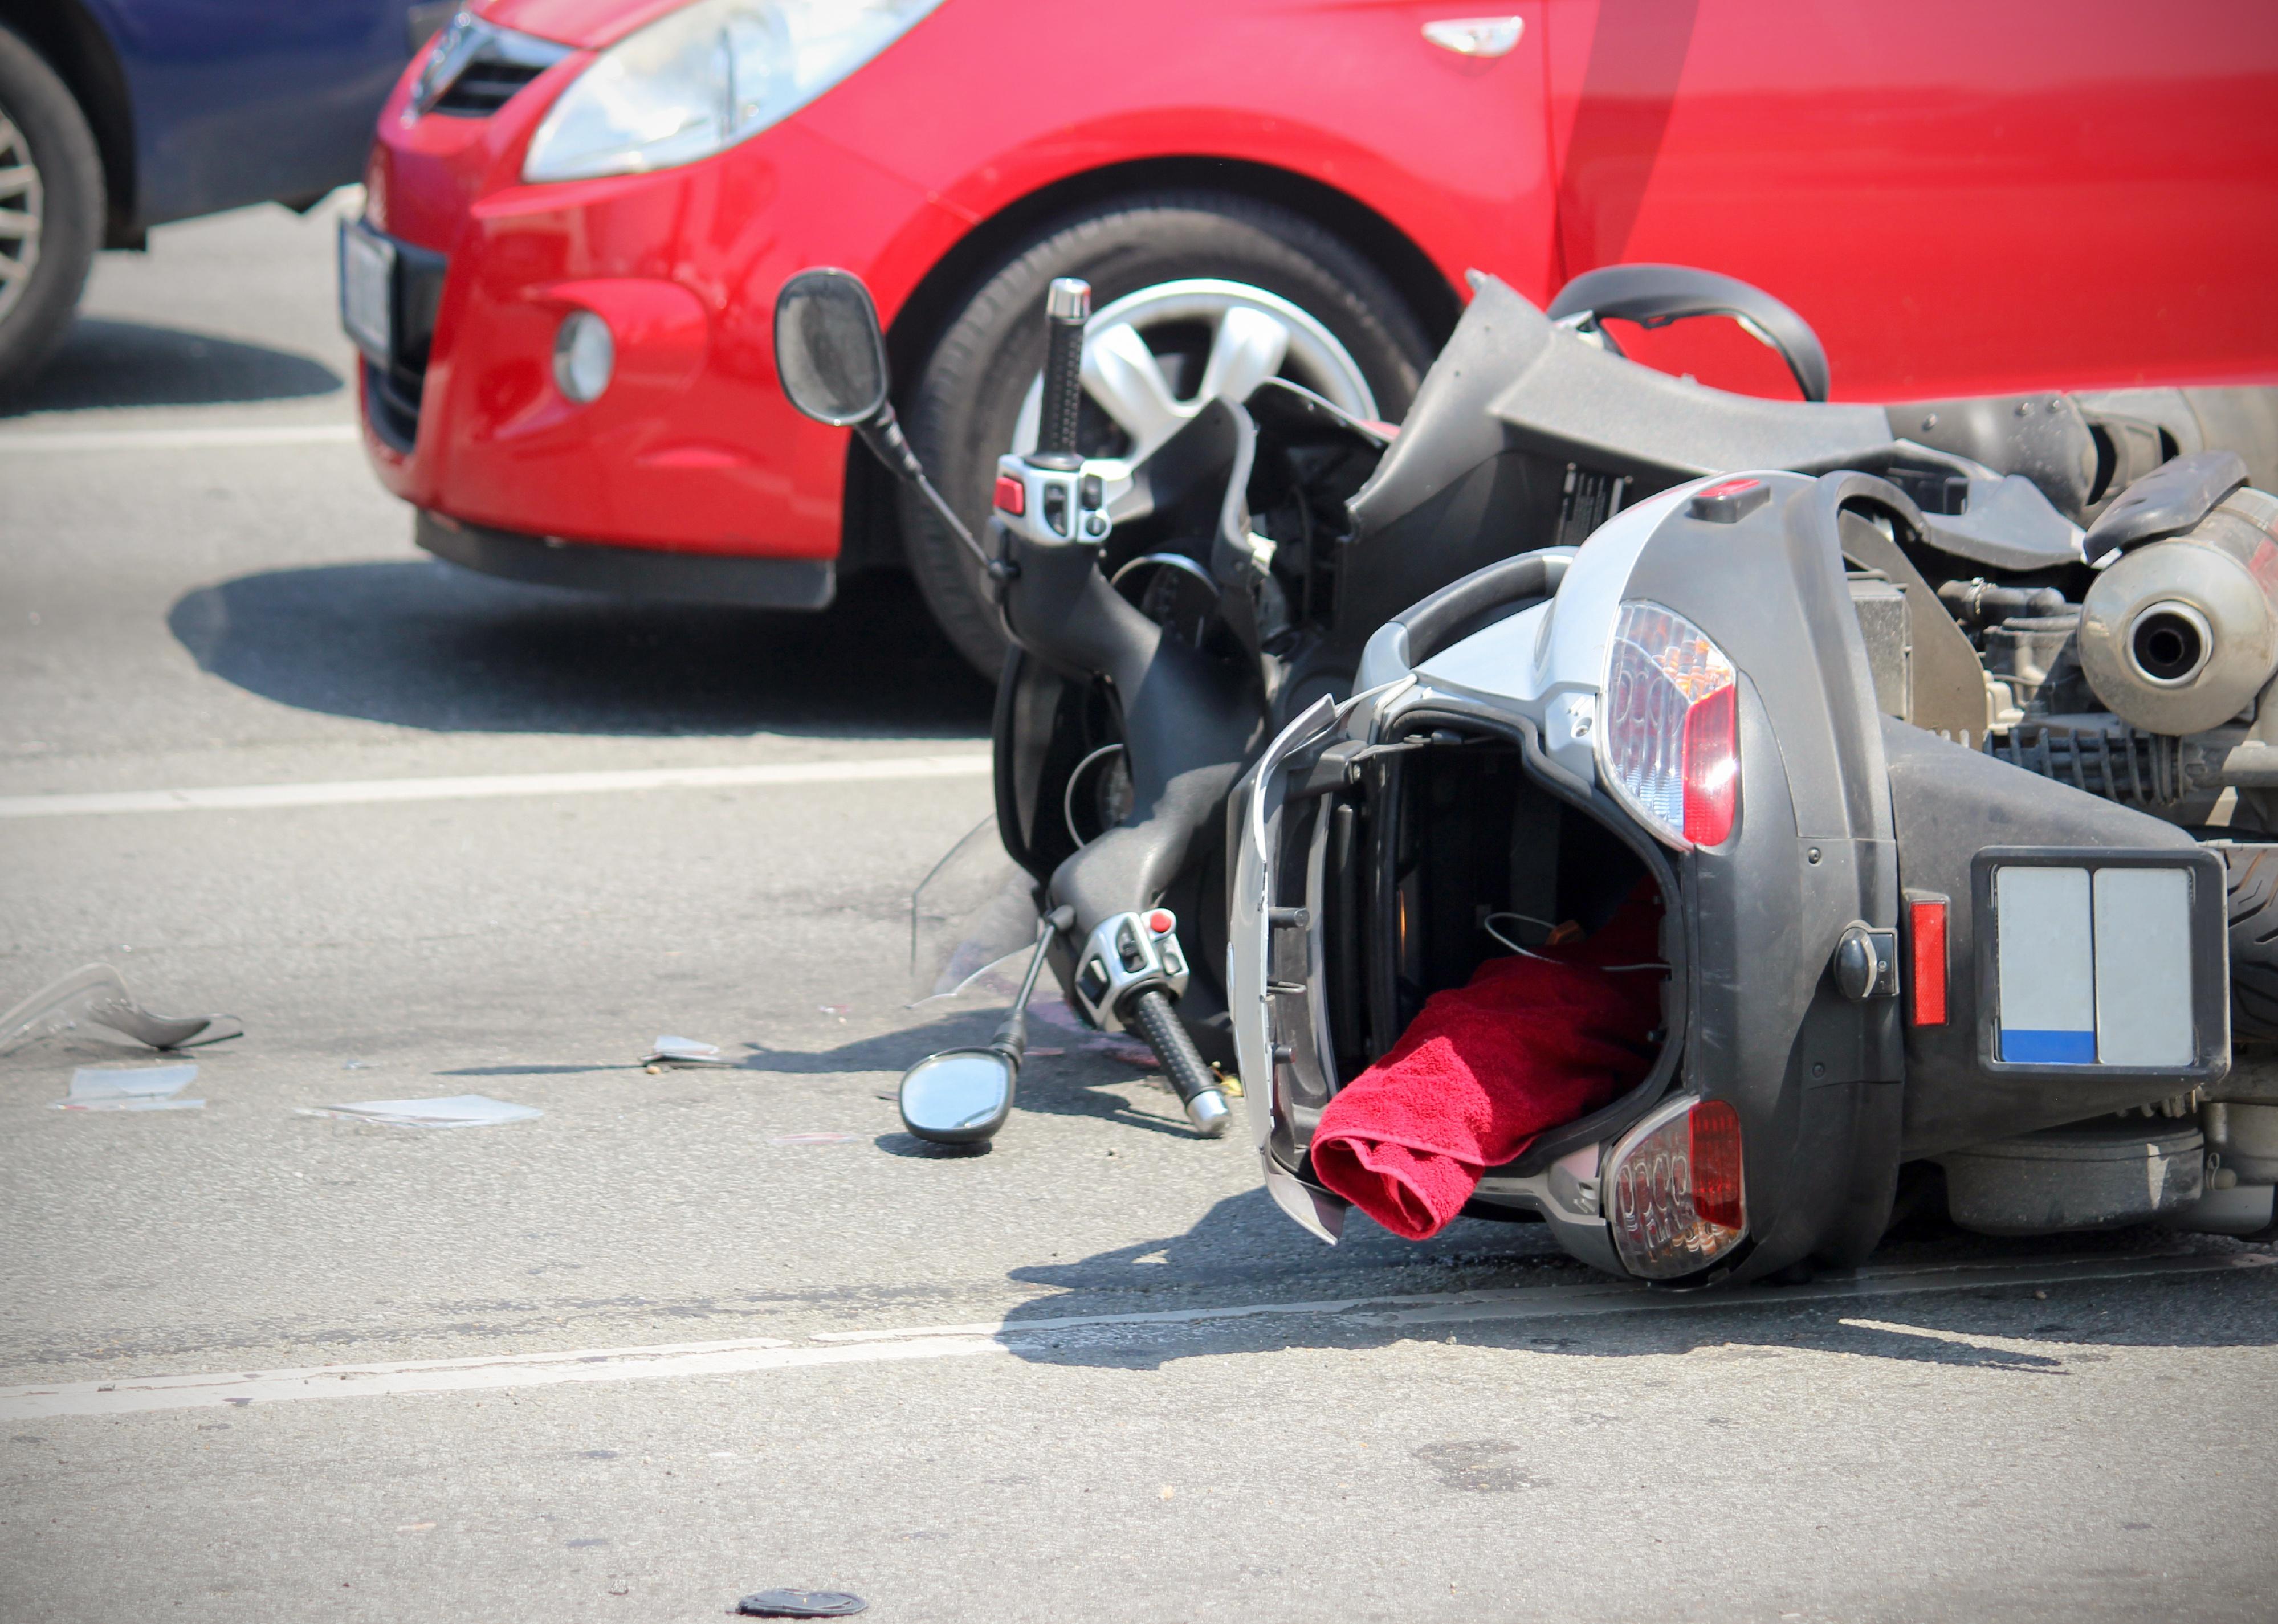
Close-up of a scooter on a pedestrian crossing.
– Motor vehicle crash fatalities: 15.70 per 100,000 residents (64 total)
– Pedestrian fatalities from vehicle crashes: 3.43 per 100,000 residents (14 total)
You may also like: 50 terms with origins in rural America
TFoxFoto // Shutterstock
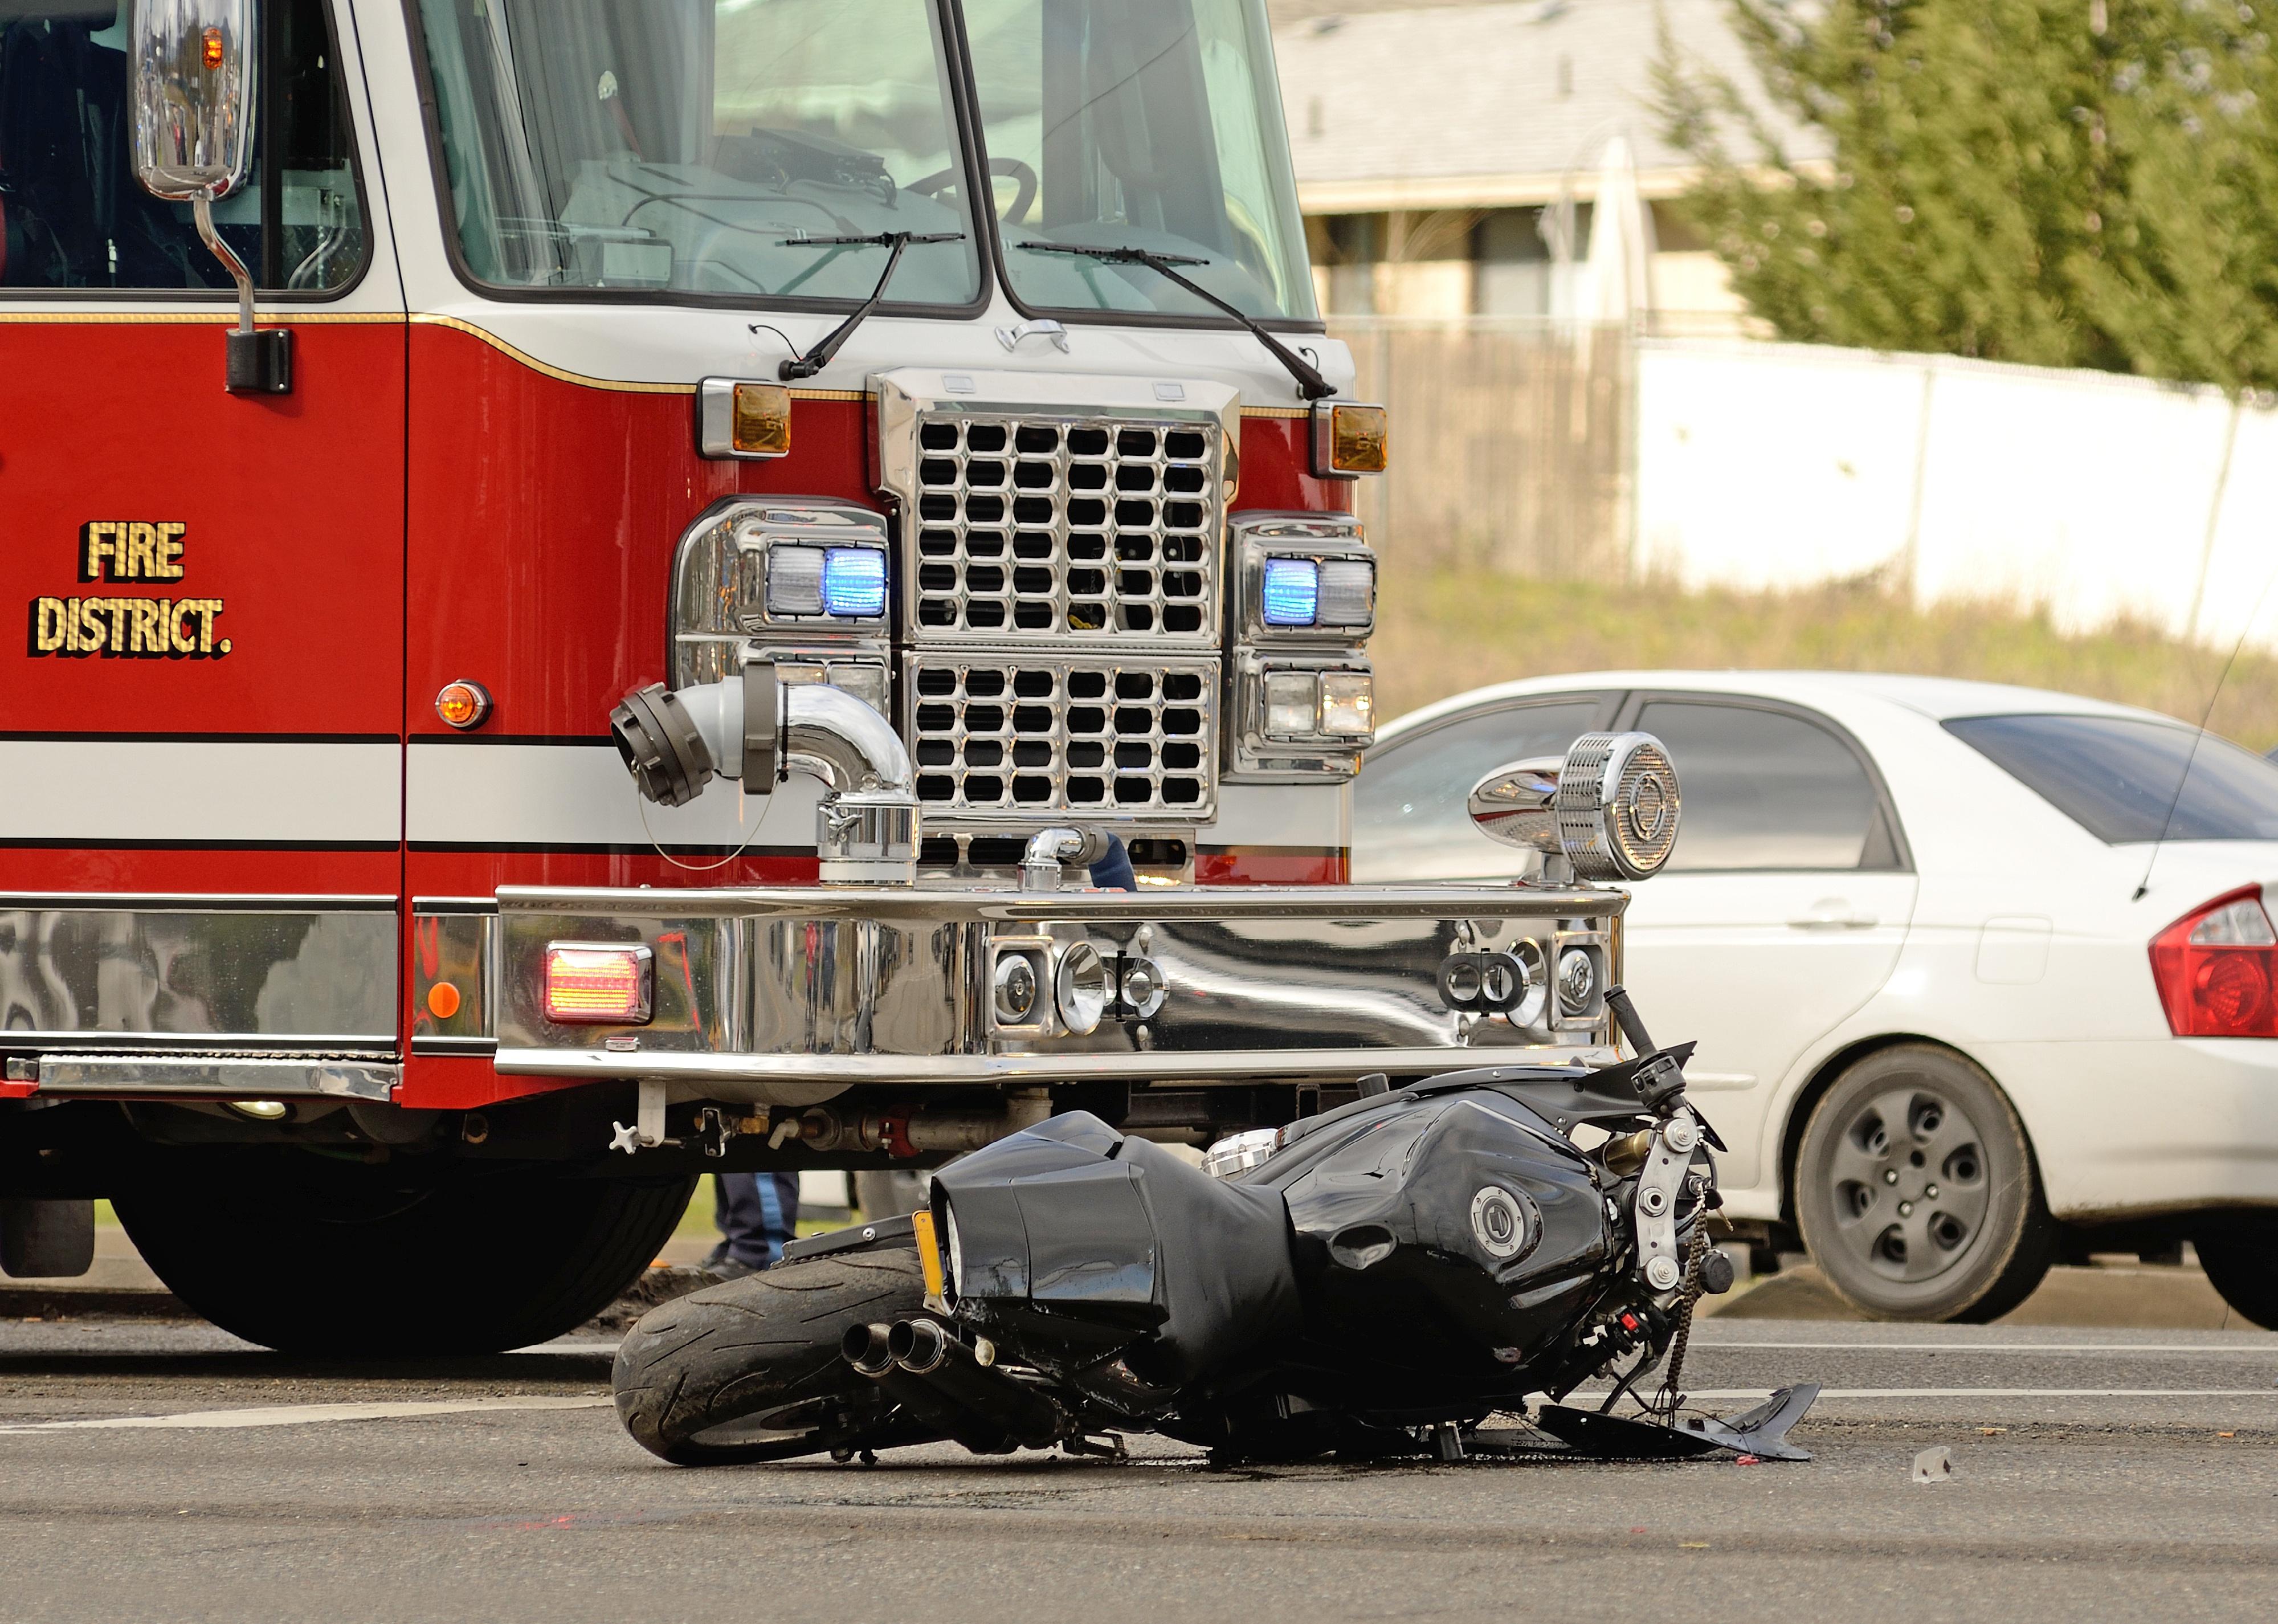
#25. Knoxville, Tennessee
Emergency responders at the scene of a motorcycle and car accident.
– Motor vehicle crash fatalities: 15.77 per 100,000 residents (30 total)
– Pedestrian fatalities from vehicle crashes: 2.63 per 100,000 residents (5 total)
Kycheryavuy // Shutterstock
#24. Atlanta
Close up of dented front bumper.
– Motor vehicle crash fatalities: 15.80 per 100,000 residents (81 total)
– Pedestrian fatalities from vehicle crashes: 4.88 per 100,000 residents (25 total)

round Picture // Shutterstock
#23. Dallas
Motorcycle helmet on the street after a fatal accident with a car.
– Motor vehicle crash fatalities: 16.53 per 100,000 residents (222 total)
– Pedestrian fatalities from vehicle crashes: 4.91 per 100,000 residents (66 total)
Tony Dunn // Shutterstock
#22. Shreveport, Louisiana
Scene of an accident at night with flashing lights from emergency vehicles.
– Motor vehicle crash fatalities: 16.78 per 100,000 residents (31 total)
– Pedestrian fatalities from vehicle crashes: 4.33 per 100,000 residents (8 total)
Aleksandar Nalbantjan // Shutterstock
#21. Springfield, Missouri
Car accident scene with motor bike.
– Motor vehicle crash fatalities: 17.25 per 100,000 residents (29 total)
– Pedestrian fatalities from vehicle crashes: 3.57 per 100,000 residents (6 total)
You may also like: America’s ambitious bet on wildlife crossings
Glenn Highcove // Shutterstock
#20. Palmdale, California
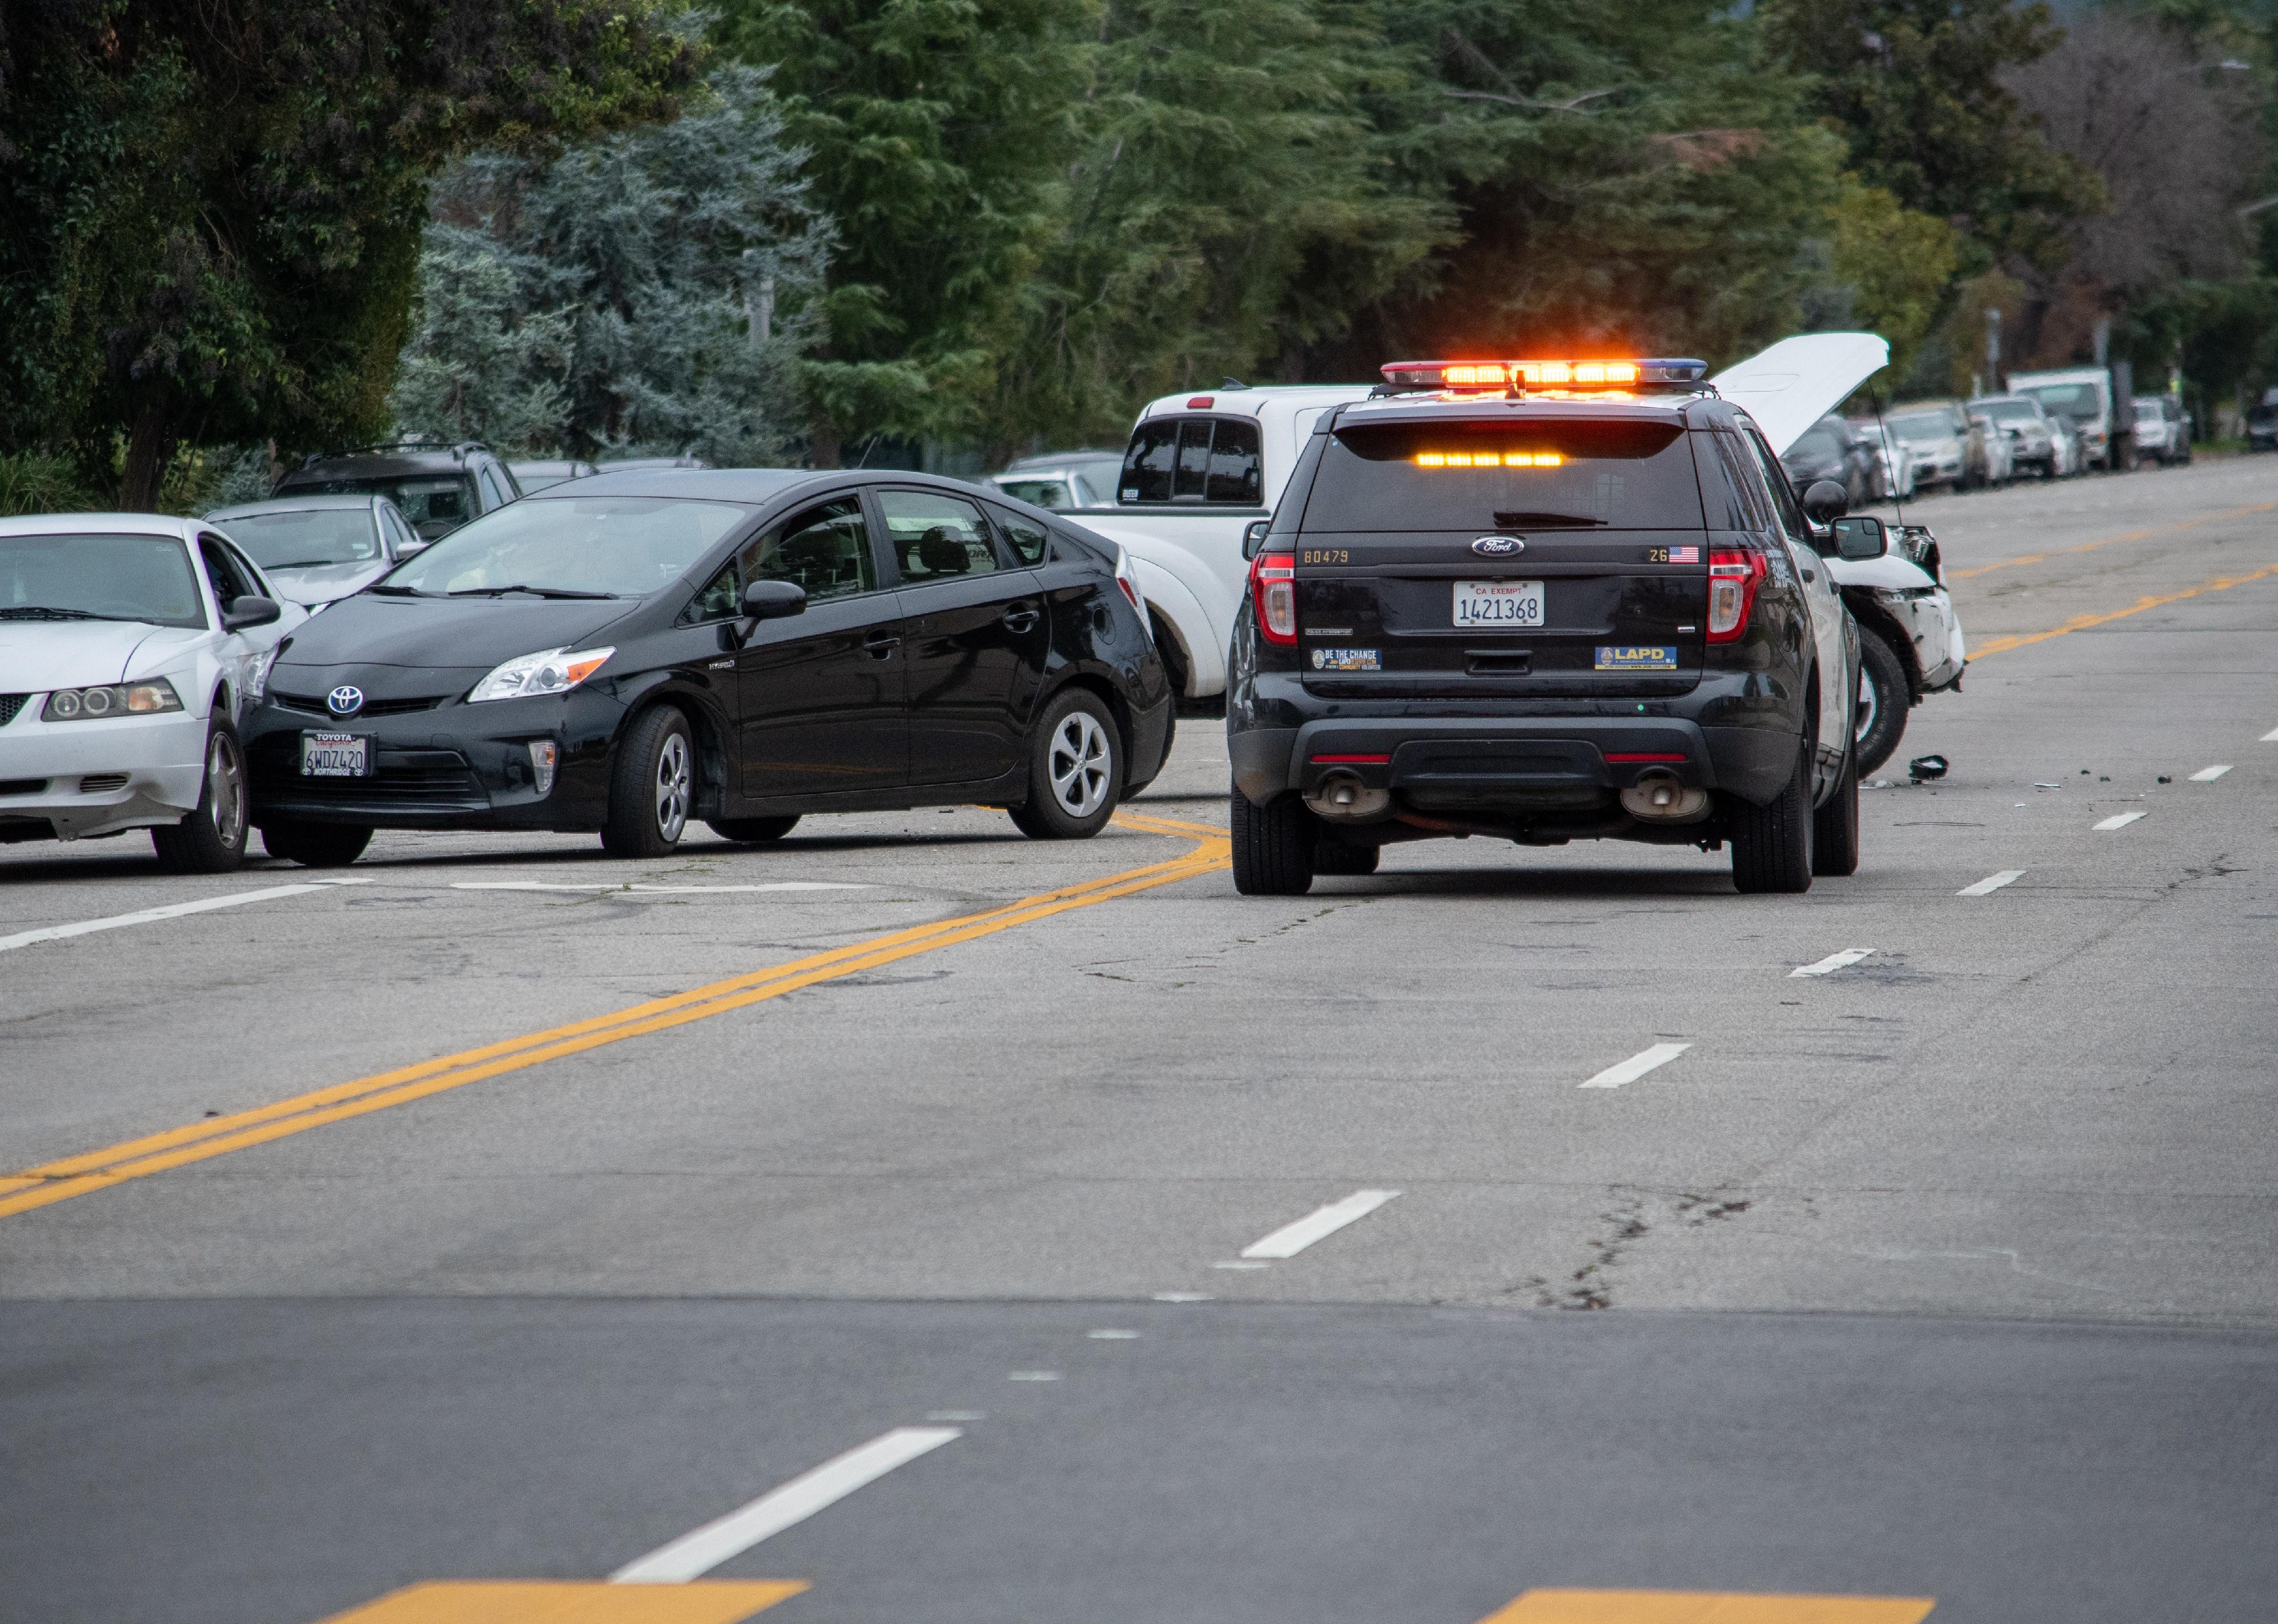
Traffic patrol vehicle sits in the middle of the road at a traffic accident investigation.
– Motor vehicle crash fatalities: 17.28 per 100,000 residents (26 total)
– Pedestrian fatalities from vehicle crashes: 3.99 per 100,000 residents (6 total)
bibiphoto // Shutterstock
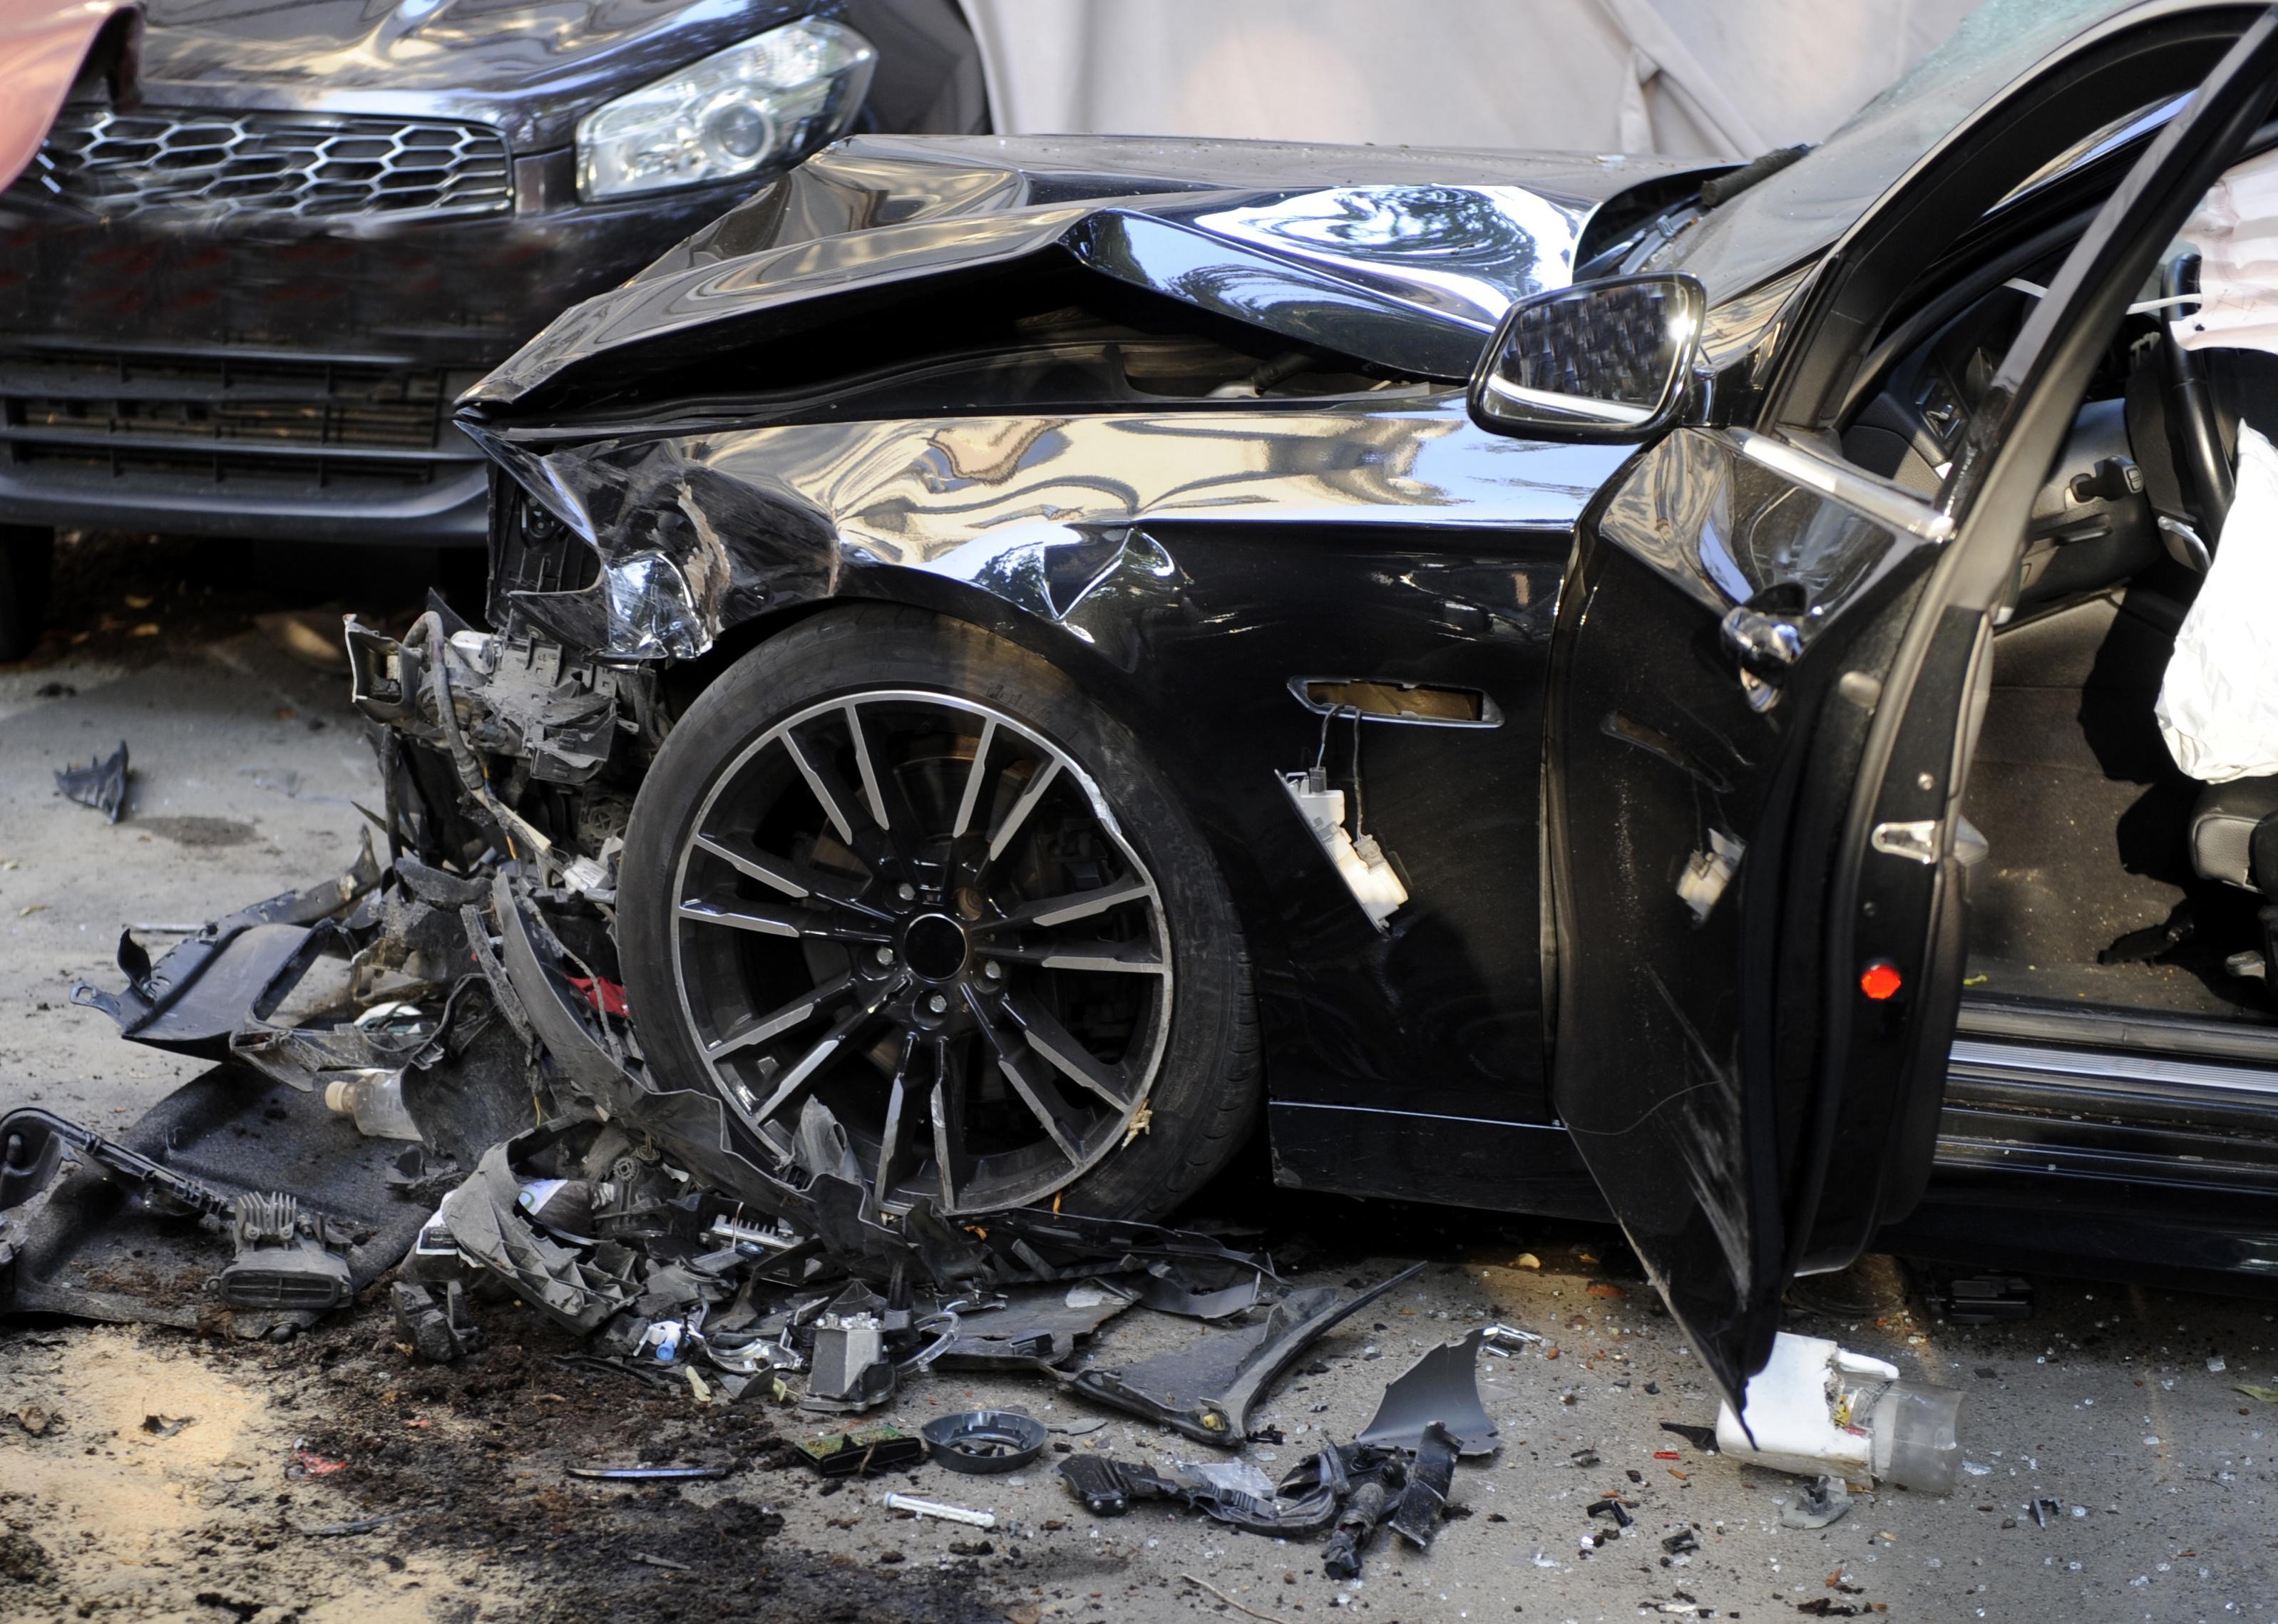
#19. Kansas City, Missouri
Close-up of destroyed car with deployed air bags.
– Motor vehicle crash fatalities: 17.70 per 100,000 residents (88 total)
– Pedestrian fatalities from vehicle crashes: 3.22 per 100,000 residents (16 total)

Silent O // Shutterstock
#18. Lancaster, California
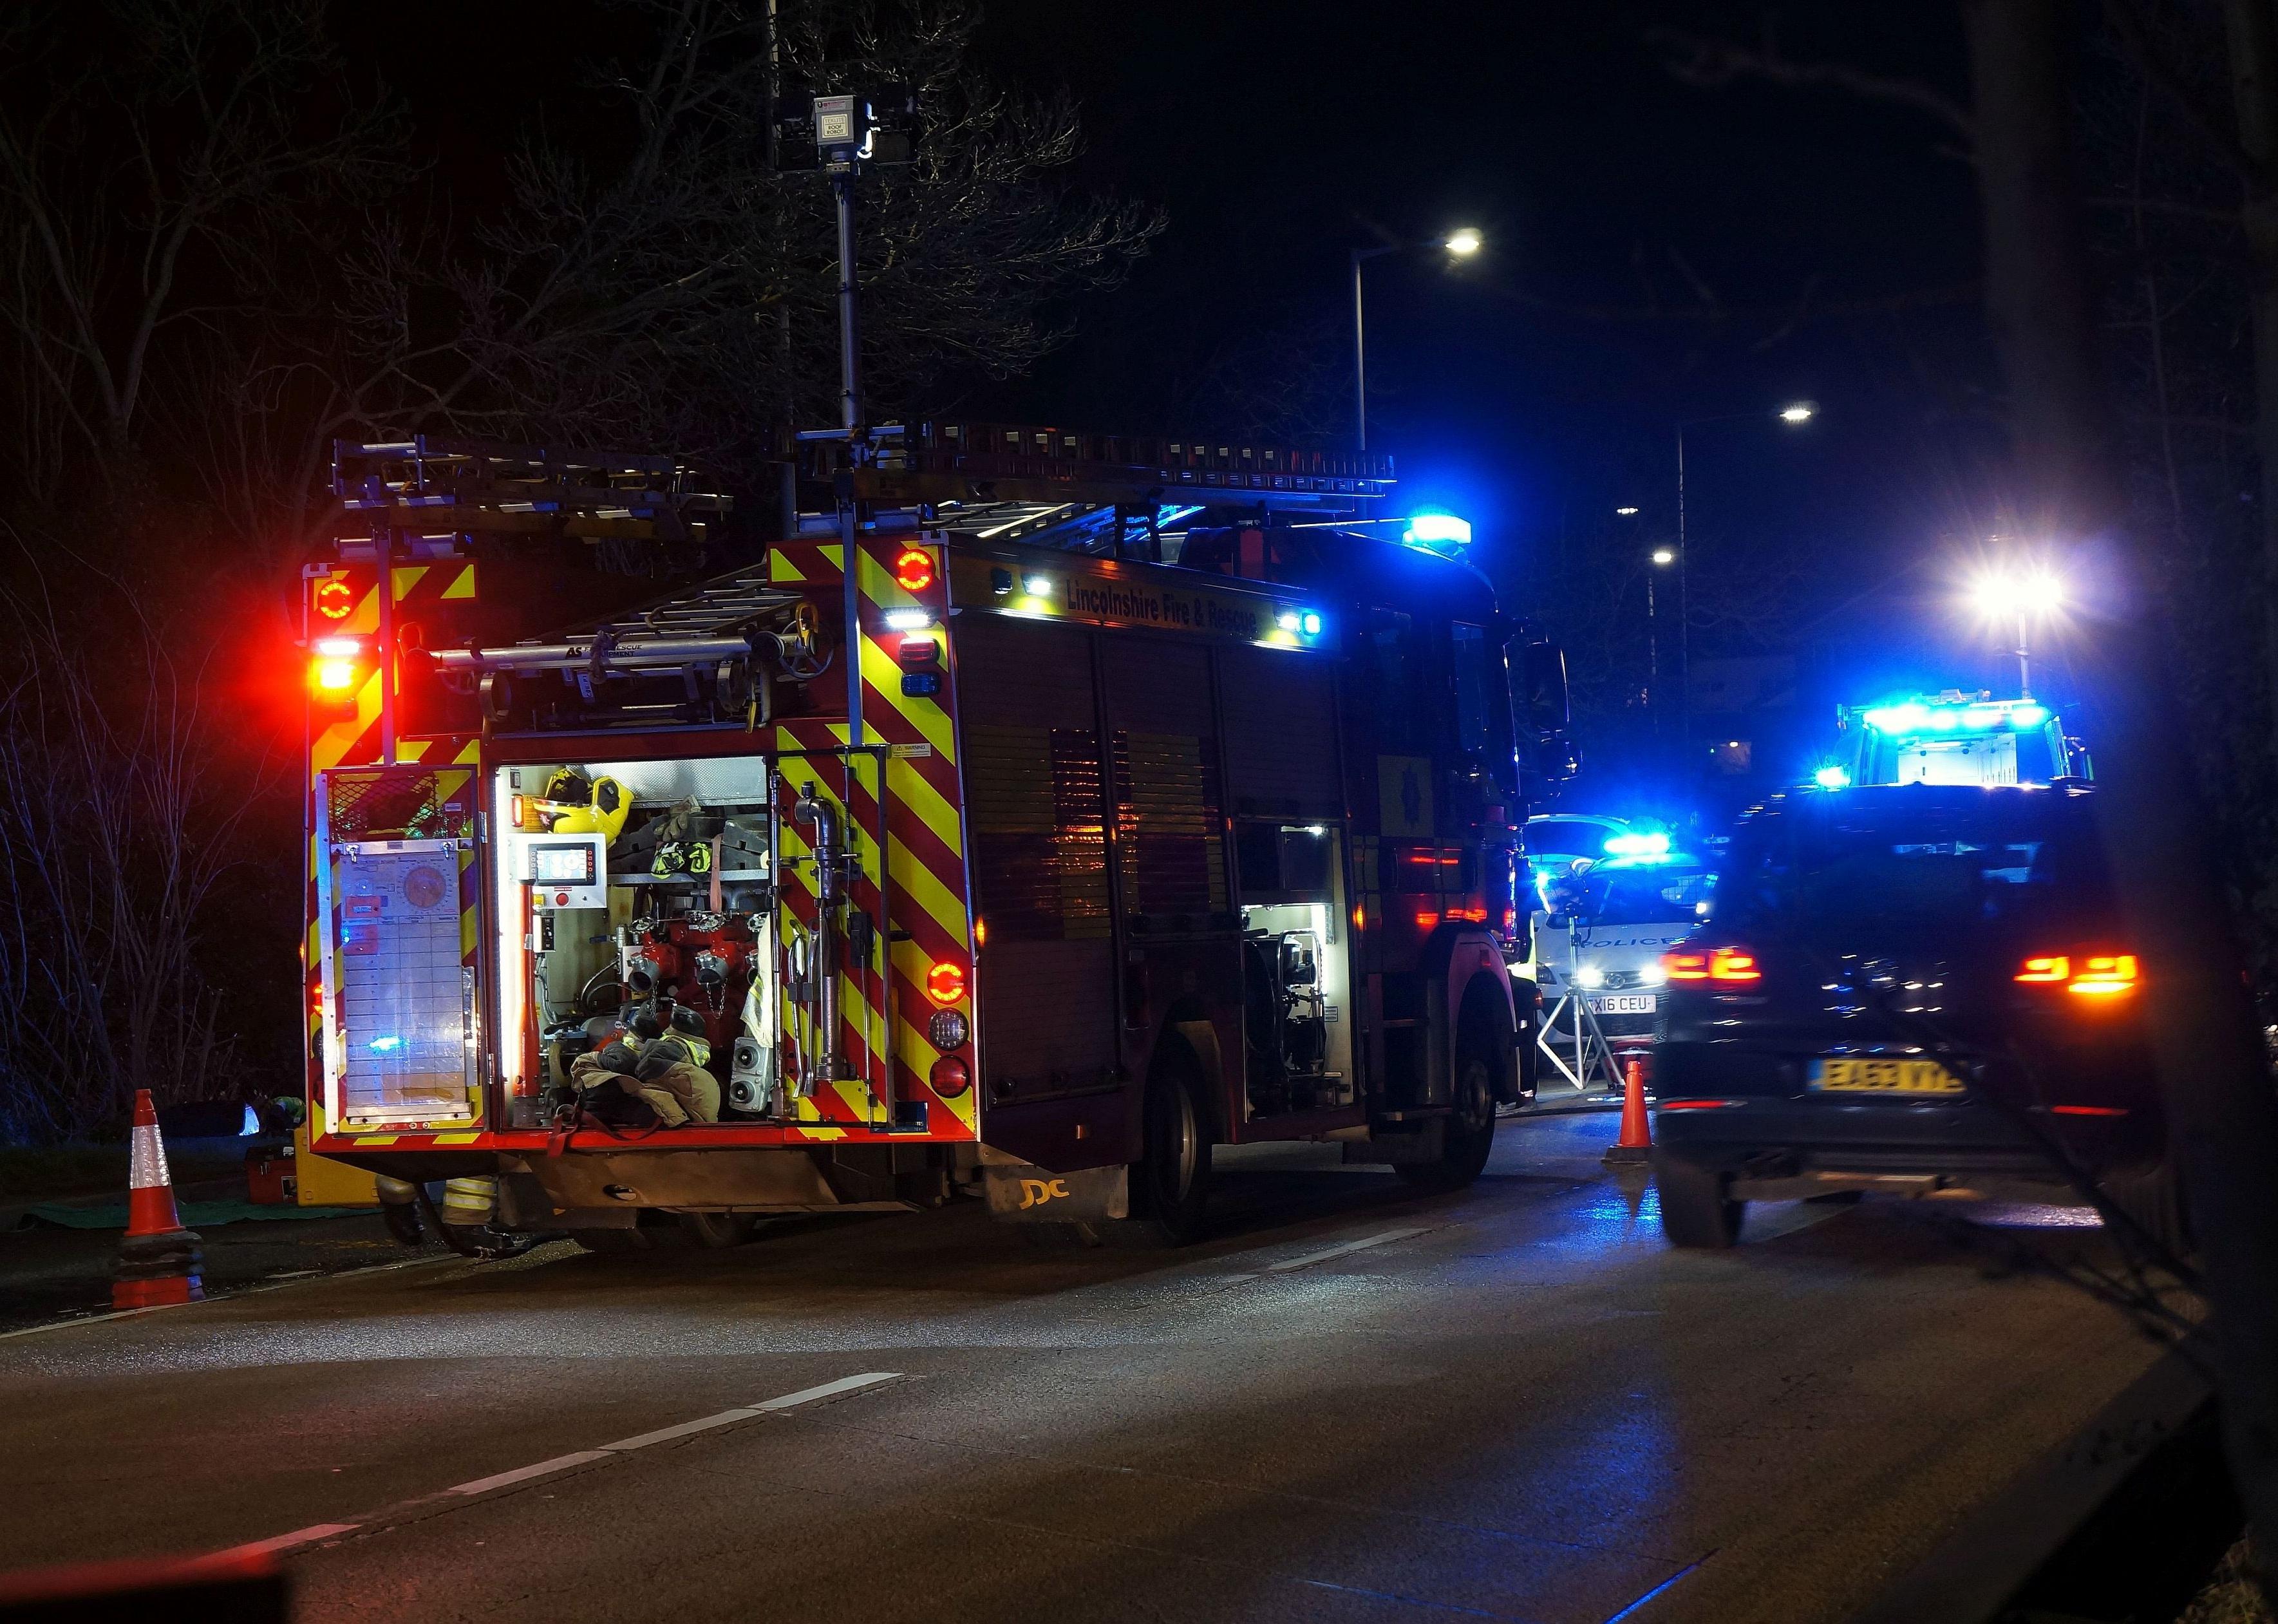
Firefighters and police officers extinguish a vehicle fire in the middle of the night.
– Motor vehicle crash fatalities: 17.97 per 100,000 residents (28 total)
– Pedestrian fatalities from vehicle crashes: 5.13 per 100,000 residents (8 total)

imofeev Vladimir // Shutterstock
#17. Louisville-Jefferson County metro, Kentucky
A view of an overturned truck on an highway.
– Motor vehicle crash fatalities: 18.27 per 100,000 residents (113 total)
– Pedestrian fatalities from vehicle crashes: 5.01 per 100,000 residents (31 total)
Vadim Ratnikov // Shutterstock
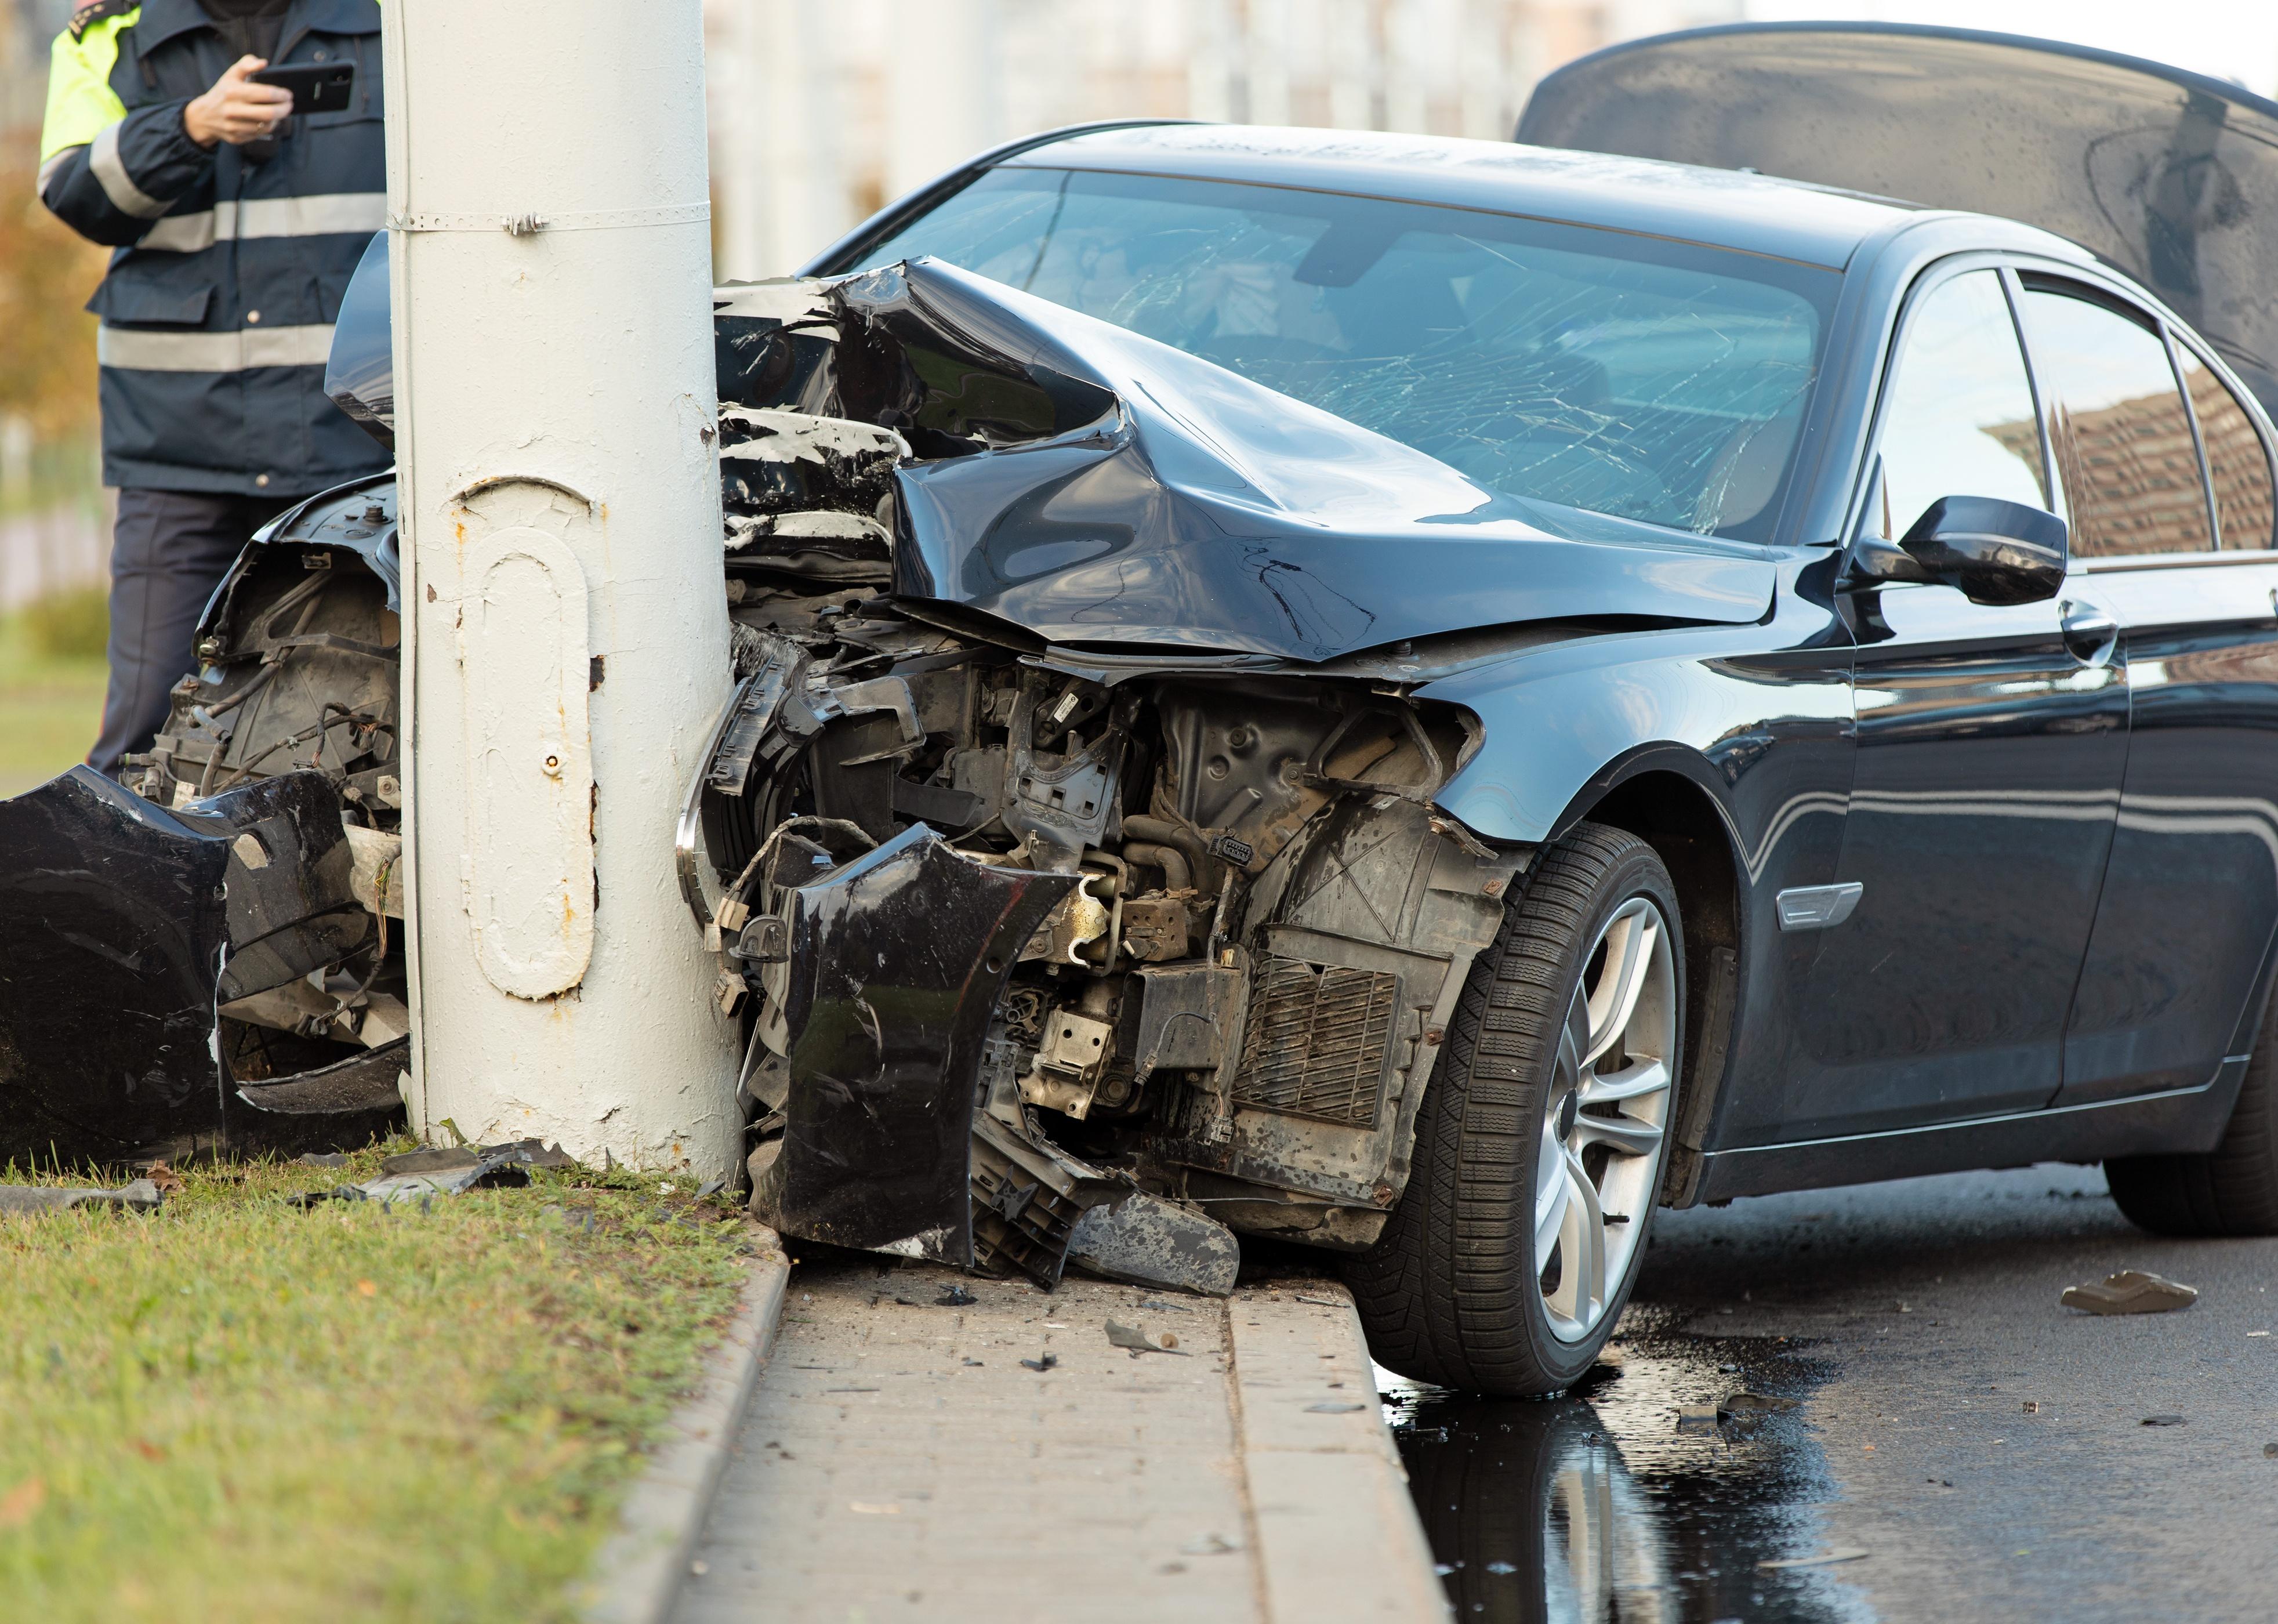
#16. Chattanooga, Tennessee
Car after crashing into a utility pole.
– Motor vehicle crash fatalities: 18.40 per 100,000 residents (34 total)
– Pedestrian fatalities from vehicle crashes: 1.08 per 100,000 residents (2 total)
You may also like: Web3 is coming—here’s what you should know
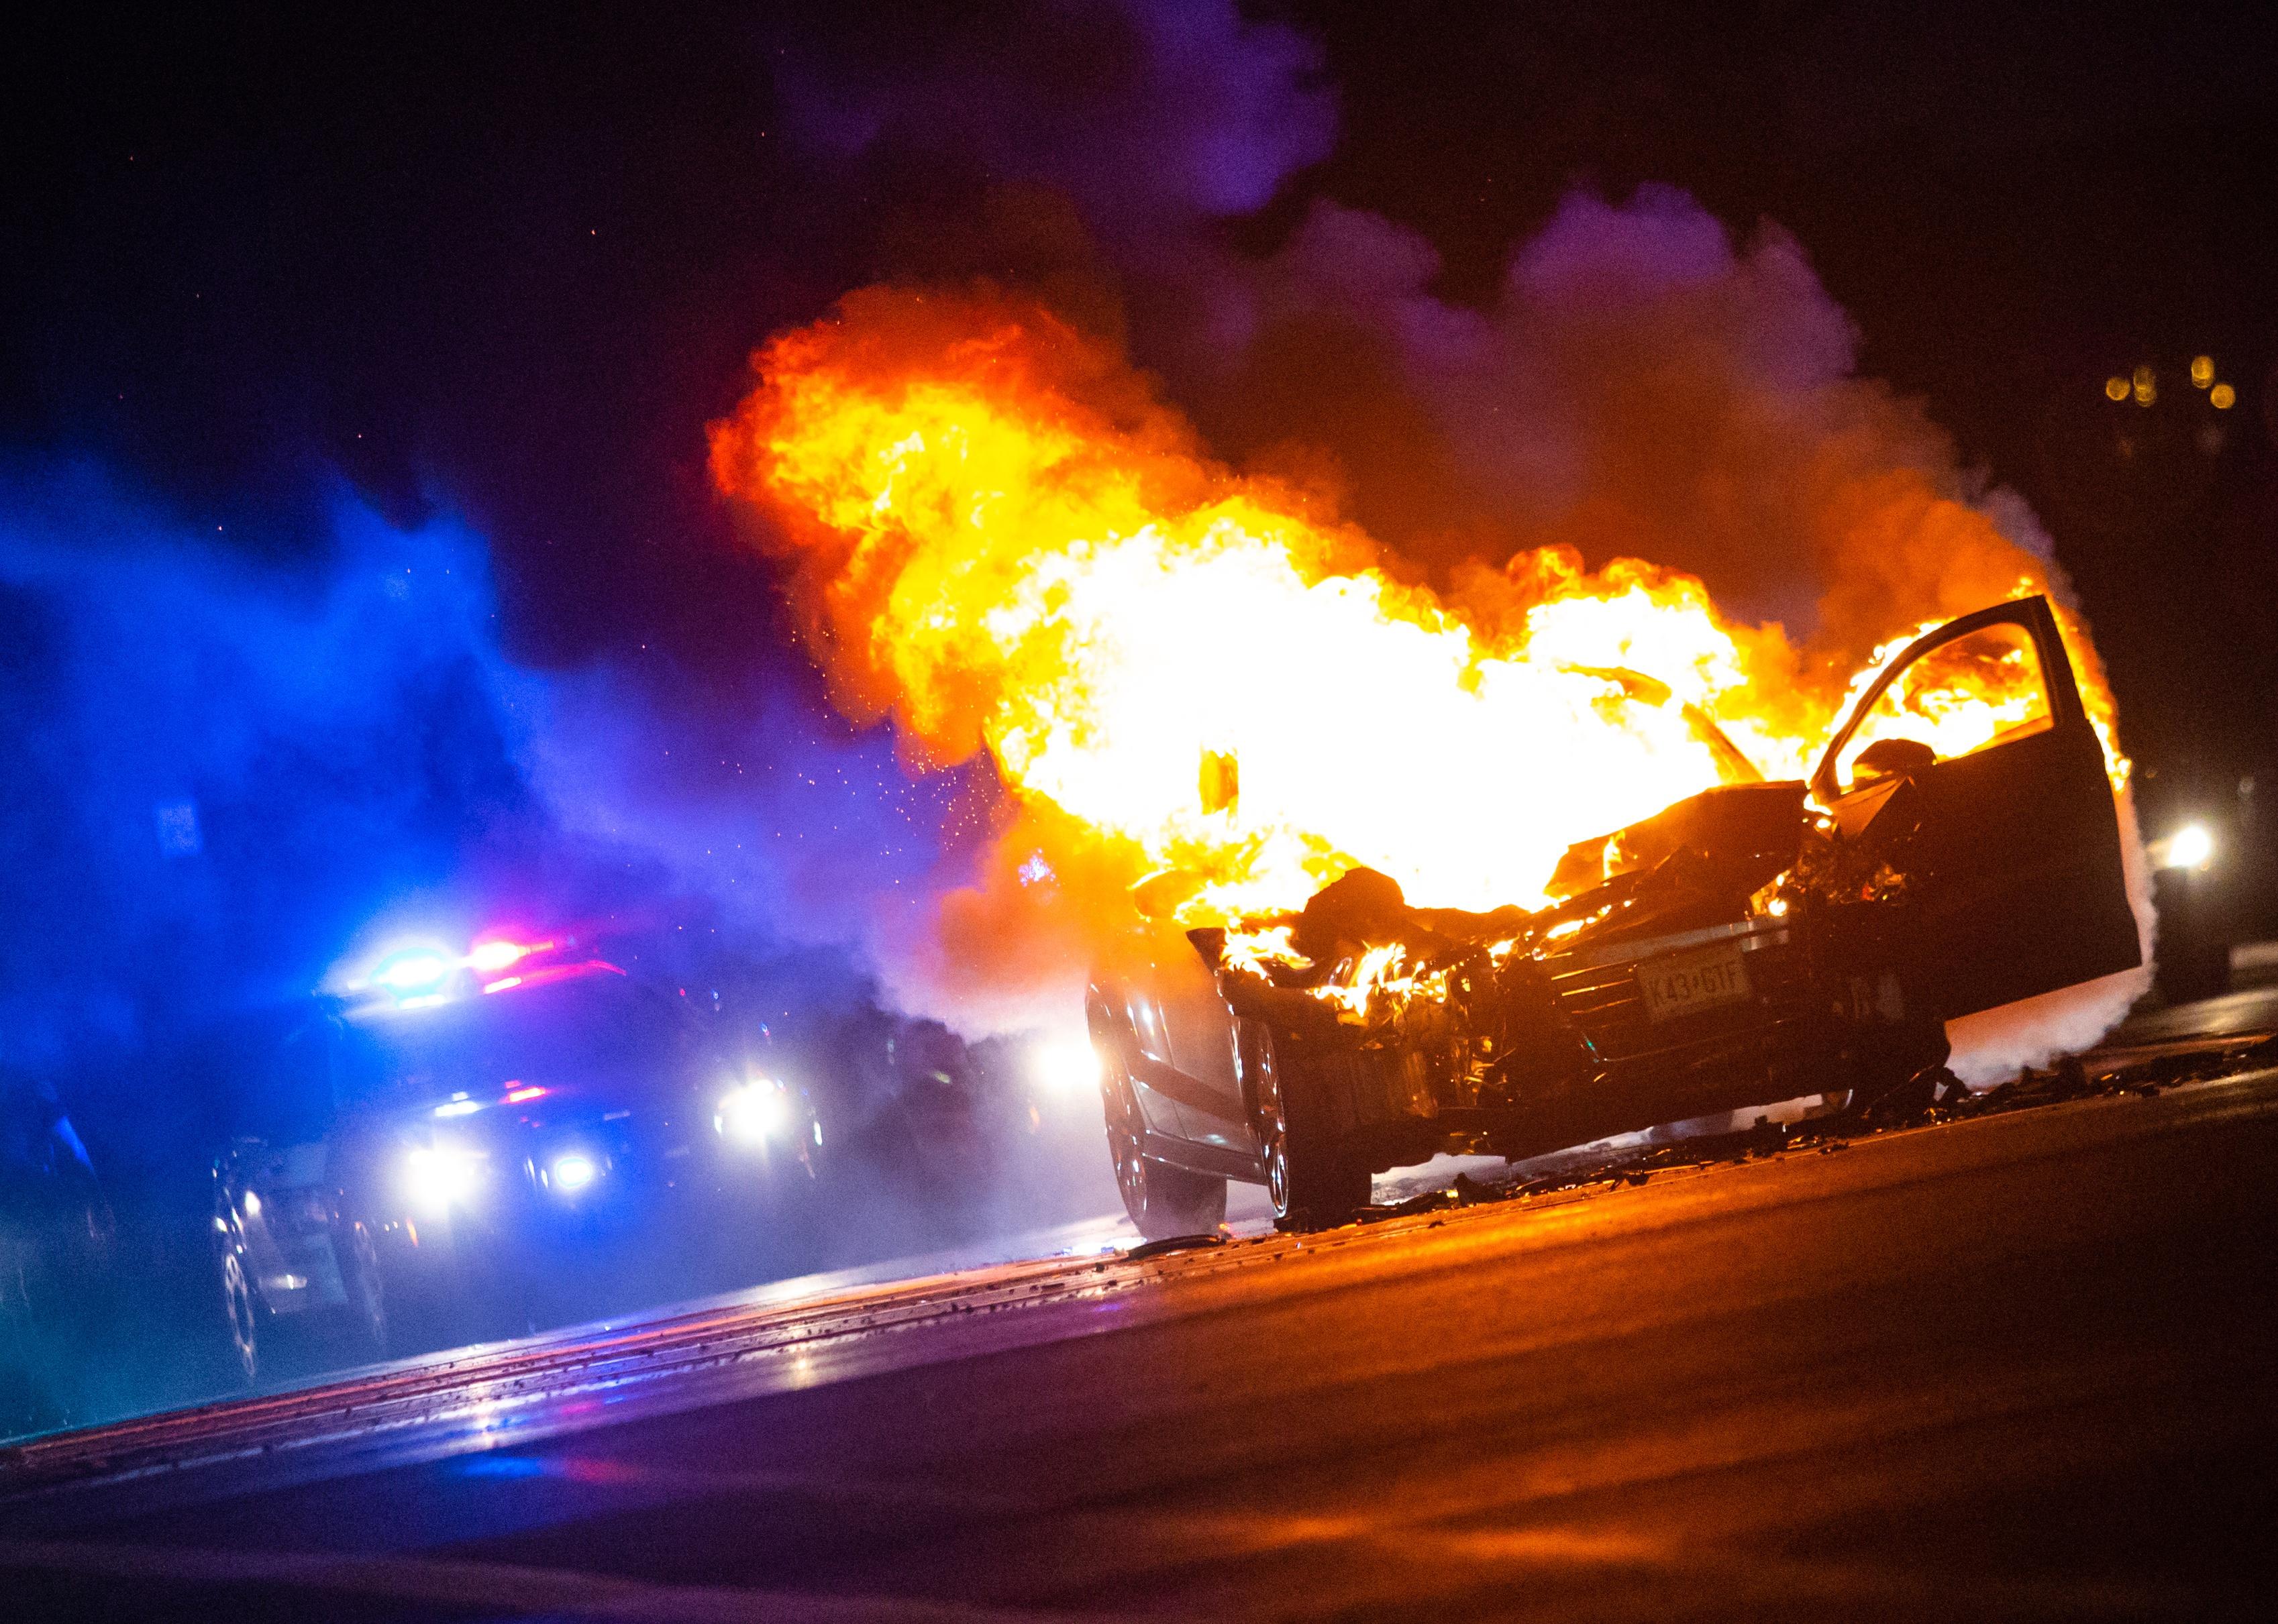
Photo Spirit // Shutterstock
#15. Fort Lauderdale, Florida
Car on fire at night with police lights in background.
– Motor vehicle crash fatalities: 18.45 per 100,000 residents (34 total)
– Pedestrian fatalities from vehicle crashes: 5.43 per 100,000 residents (10 total)
Kaentian Street // Shutterstock
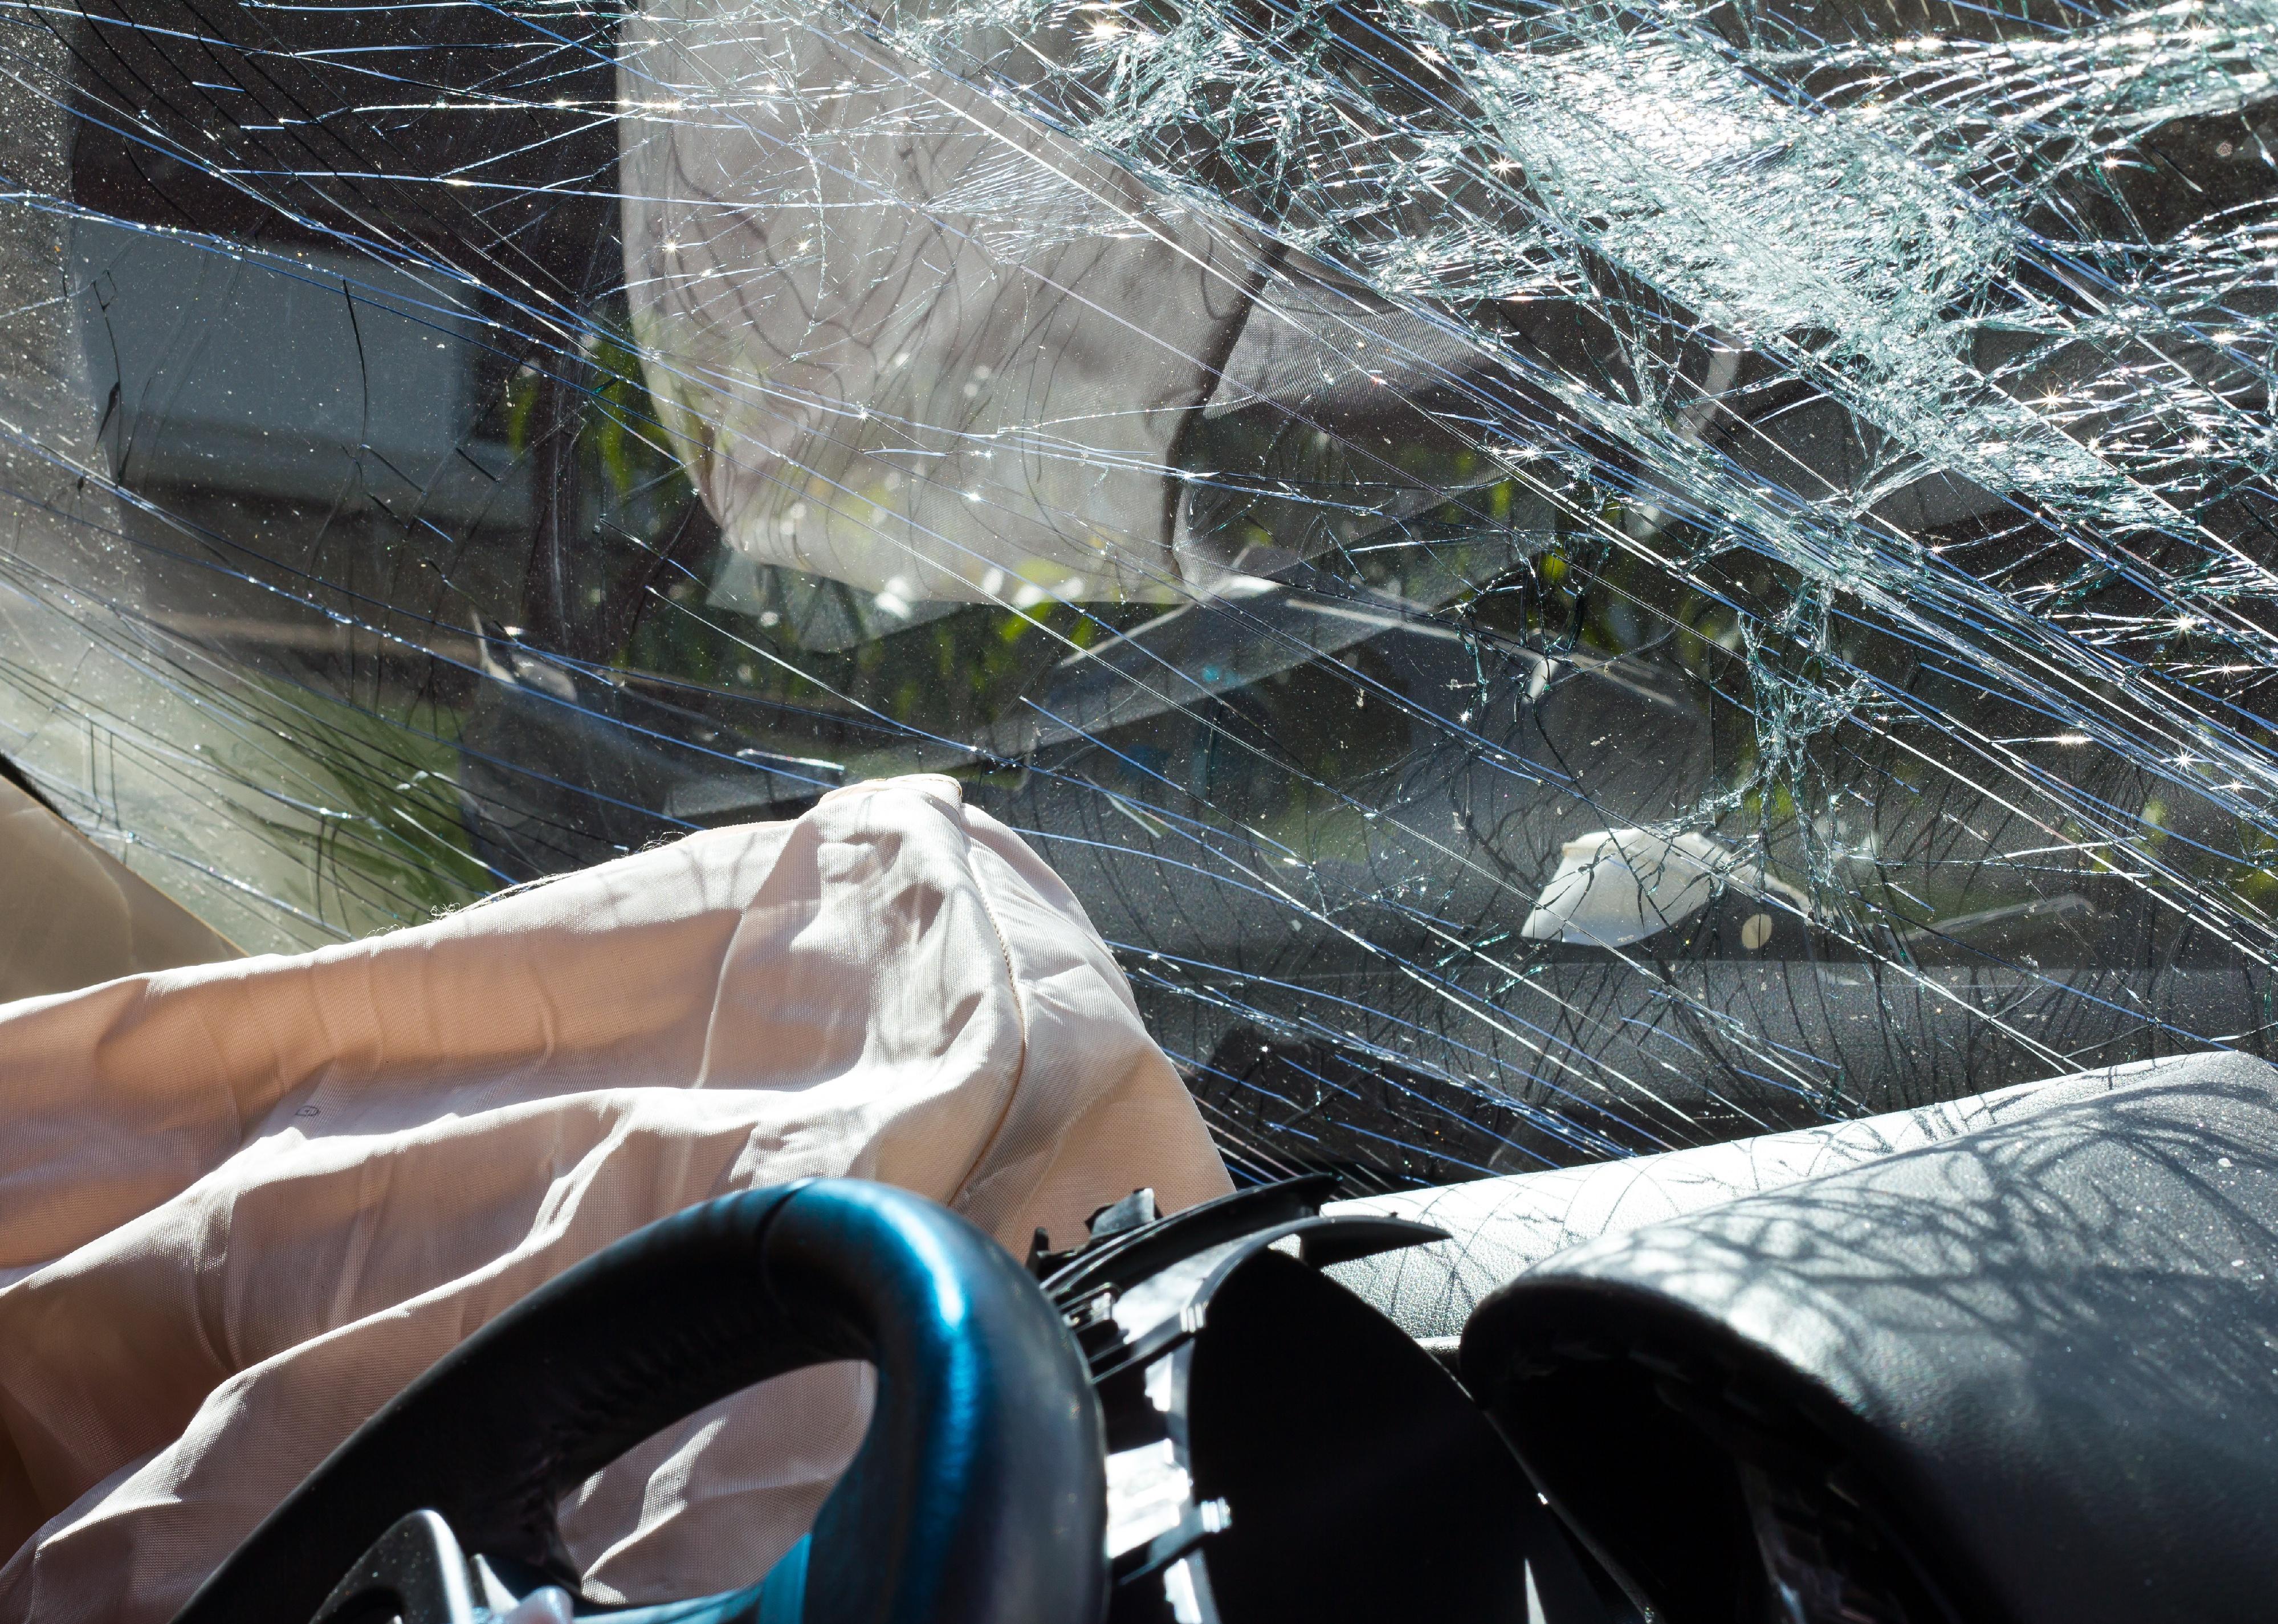
#14. Albuquerque, New Mexico
Inside a car with airbags and windshield cracks.
– Motor vehicle crash fatalities: 18.67 per 100,000 residents (105 total)
– Pedestrian fatalities from vehicle crashes: 5.33 per 100,000 residents (30 total)
Sharomka // Shutterstock
#13. Macon-Bibb County, Georgia
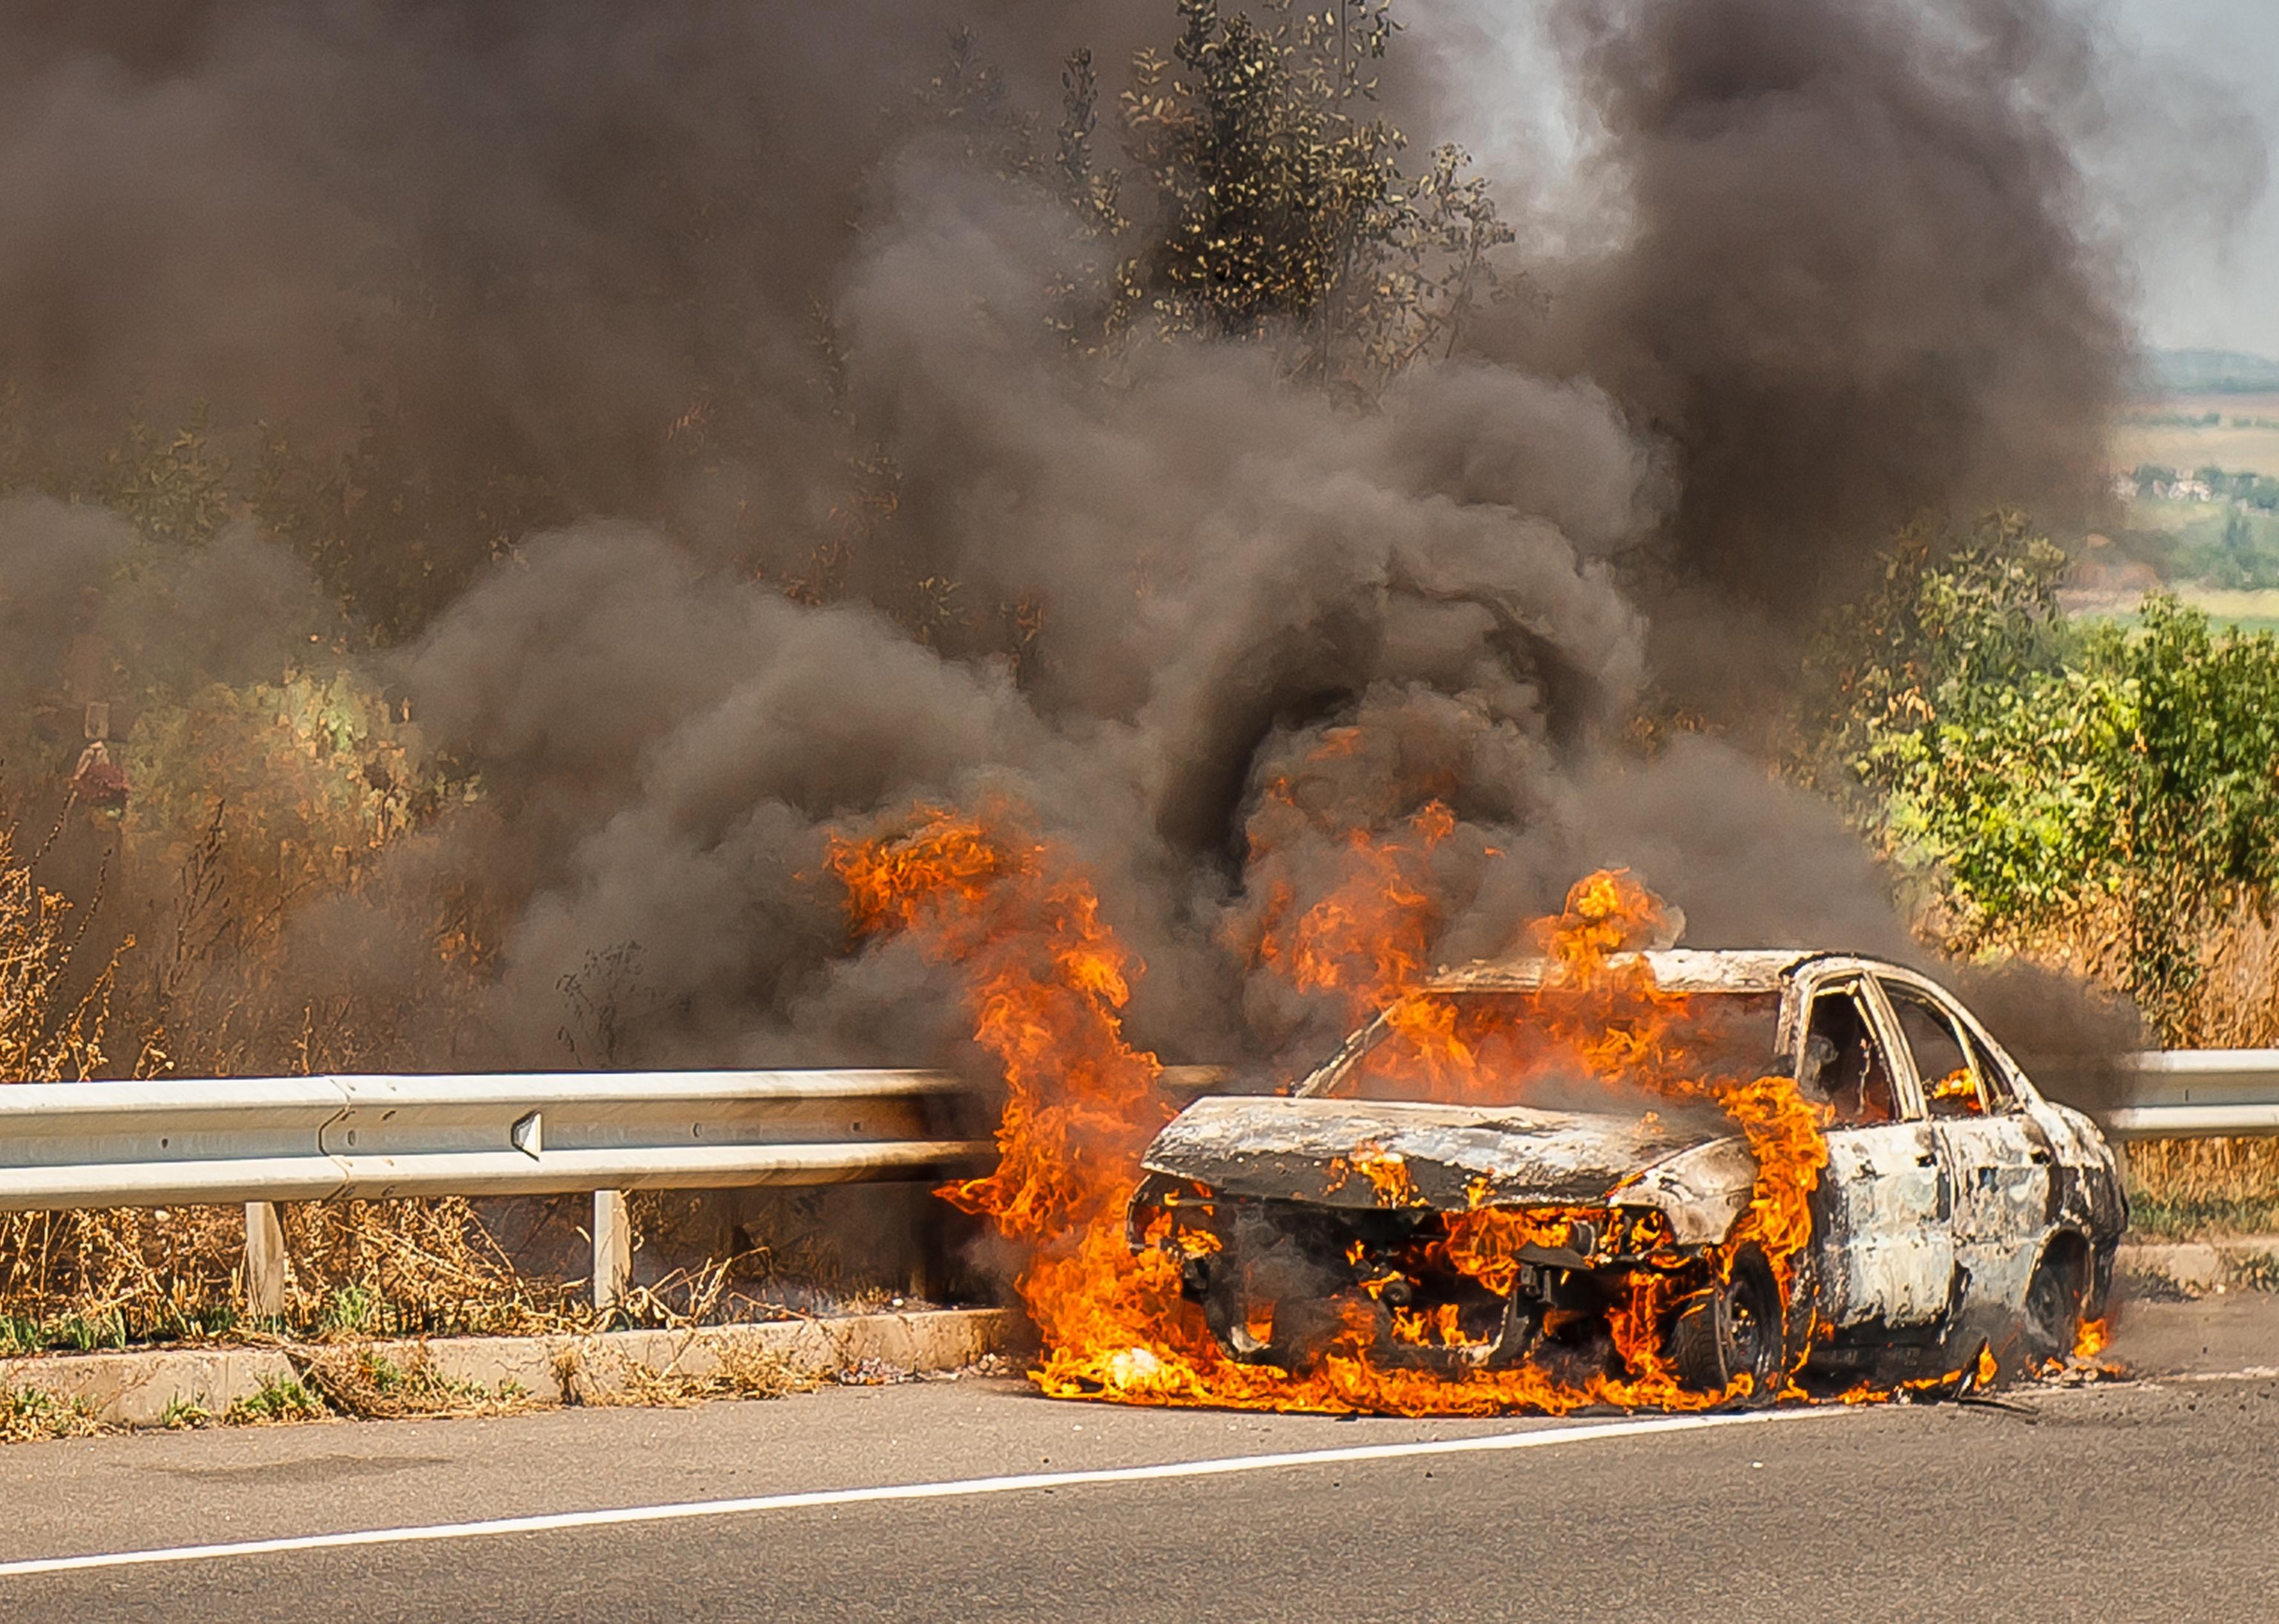
Car on fire on the side of the road.
– Motor vehicle crash fatalities: 18.99 per 100,000 residents (29 total)
– Pedestrian fatalities from vehicle crashes: 4.58 per 100,000 residents (7 total)
ESOlex // Shutterstock
#12. Glendale, Arizona
Damaged vehicle closeup after a car crash.
– Motor vehicle crash fatalities: 19.19 per 100,000 residents (49 total)
– Pedestrian fatalities from vehicle crashes: 5.88 per 100,000 residents (15 total)

Tiko Aramyan // Shutterstock
#11. Jacksonville, Florida
Blue flasher on the police car at night.
– Motor vehicle crash fatalities: 19.34 per 100,000 residents (178 total)
– Pedestrian fatalities from vehicle crashes: 4.89 per 100,000 residents (45 total)
You may also like: States with the highest marriage rates—and how they’ve changed
Semiglass // Shutterstock
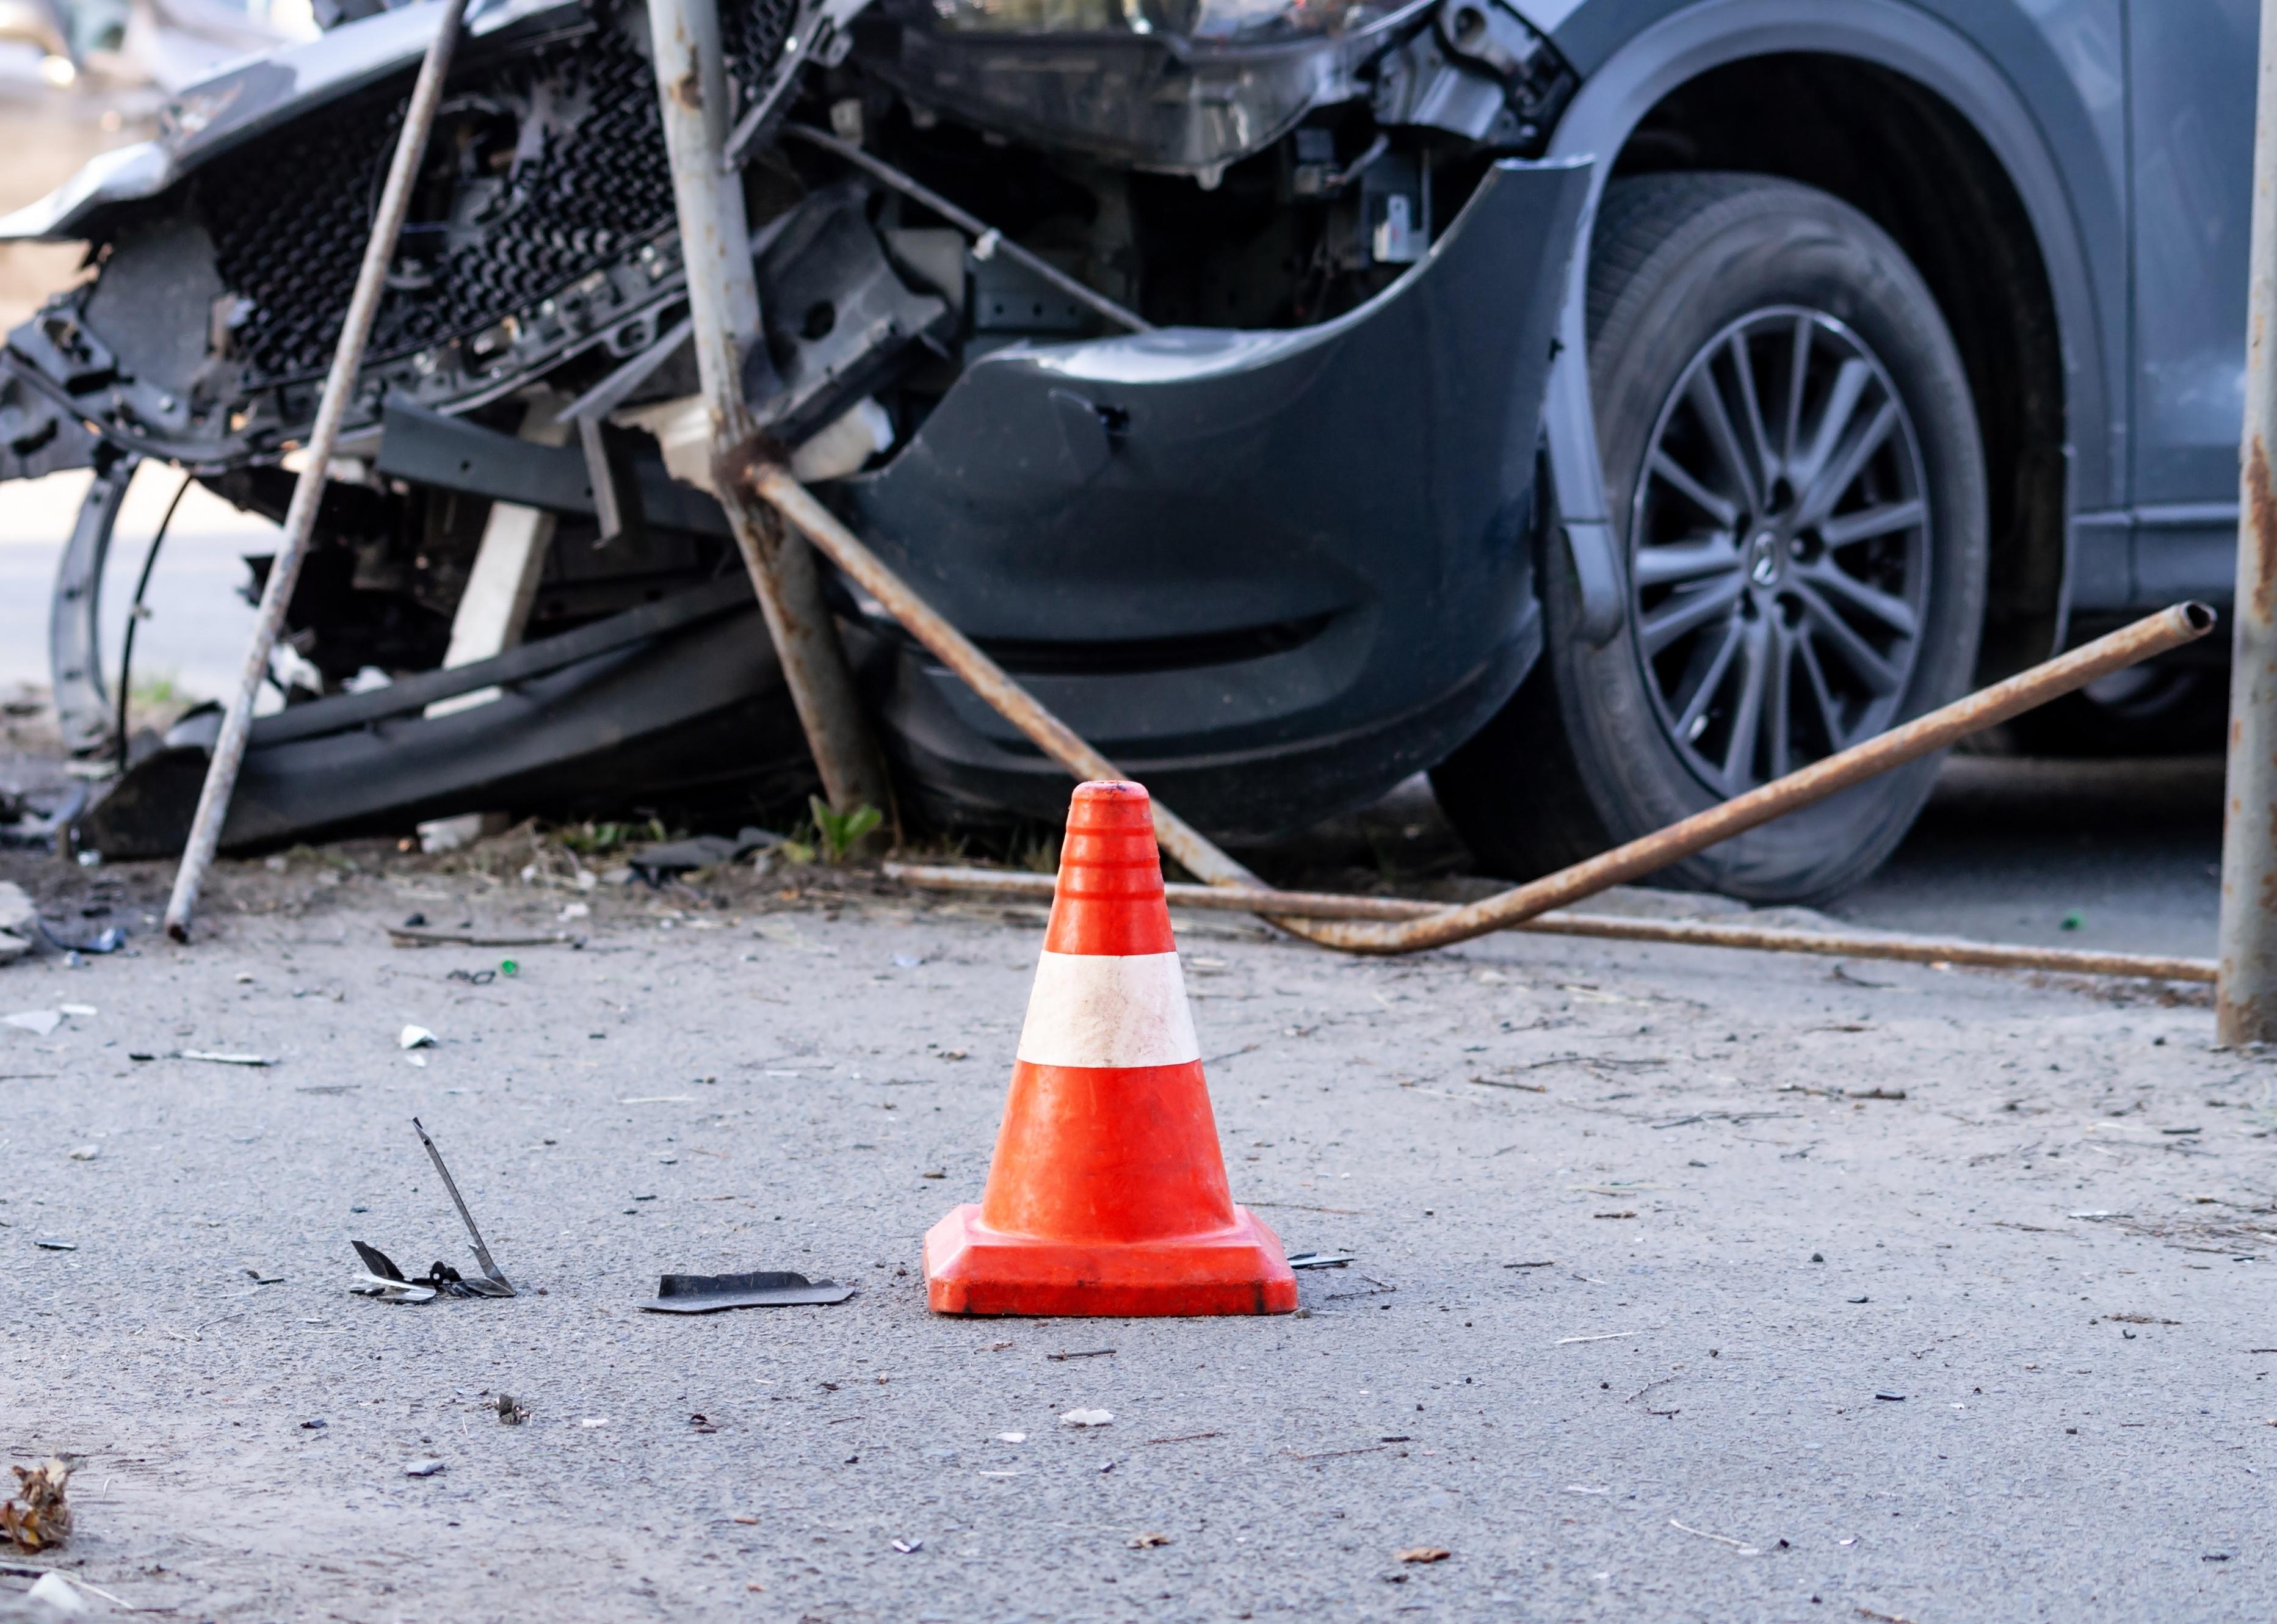
#10. Cleveland
Road cone against the background of a car crash.
– Motor vehicle crash fatalities: 19.81 per 100,000 residents (75 total)
– Pedestrian fatalities from vehicle crashes: 2.64 per 100,000 residents (10 total)

zef art // Shutterstock
#9. San Bernardino, California
Police cars at night.
– Motor vehicle crash fatalities: 20.69 per 100,000 residents (45 total)
– Pedestrian fatalities from vehicle crashes: 5.52 per 100,000 residents (12 total)
GUNDAM_Ai // Shutterstock
#8. Birmingham, Alabama
Car on its side after an accident.
– Motor vehicle crash fatalities: 21.26 per 100,000 residents (44 total)
– Pedestrian fatalities from vehicle crashes: 4.35 per 100,000 residents (9 total)
Vitpho // Shutterstock
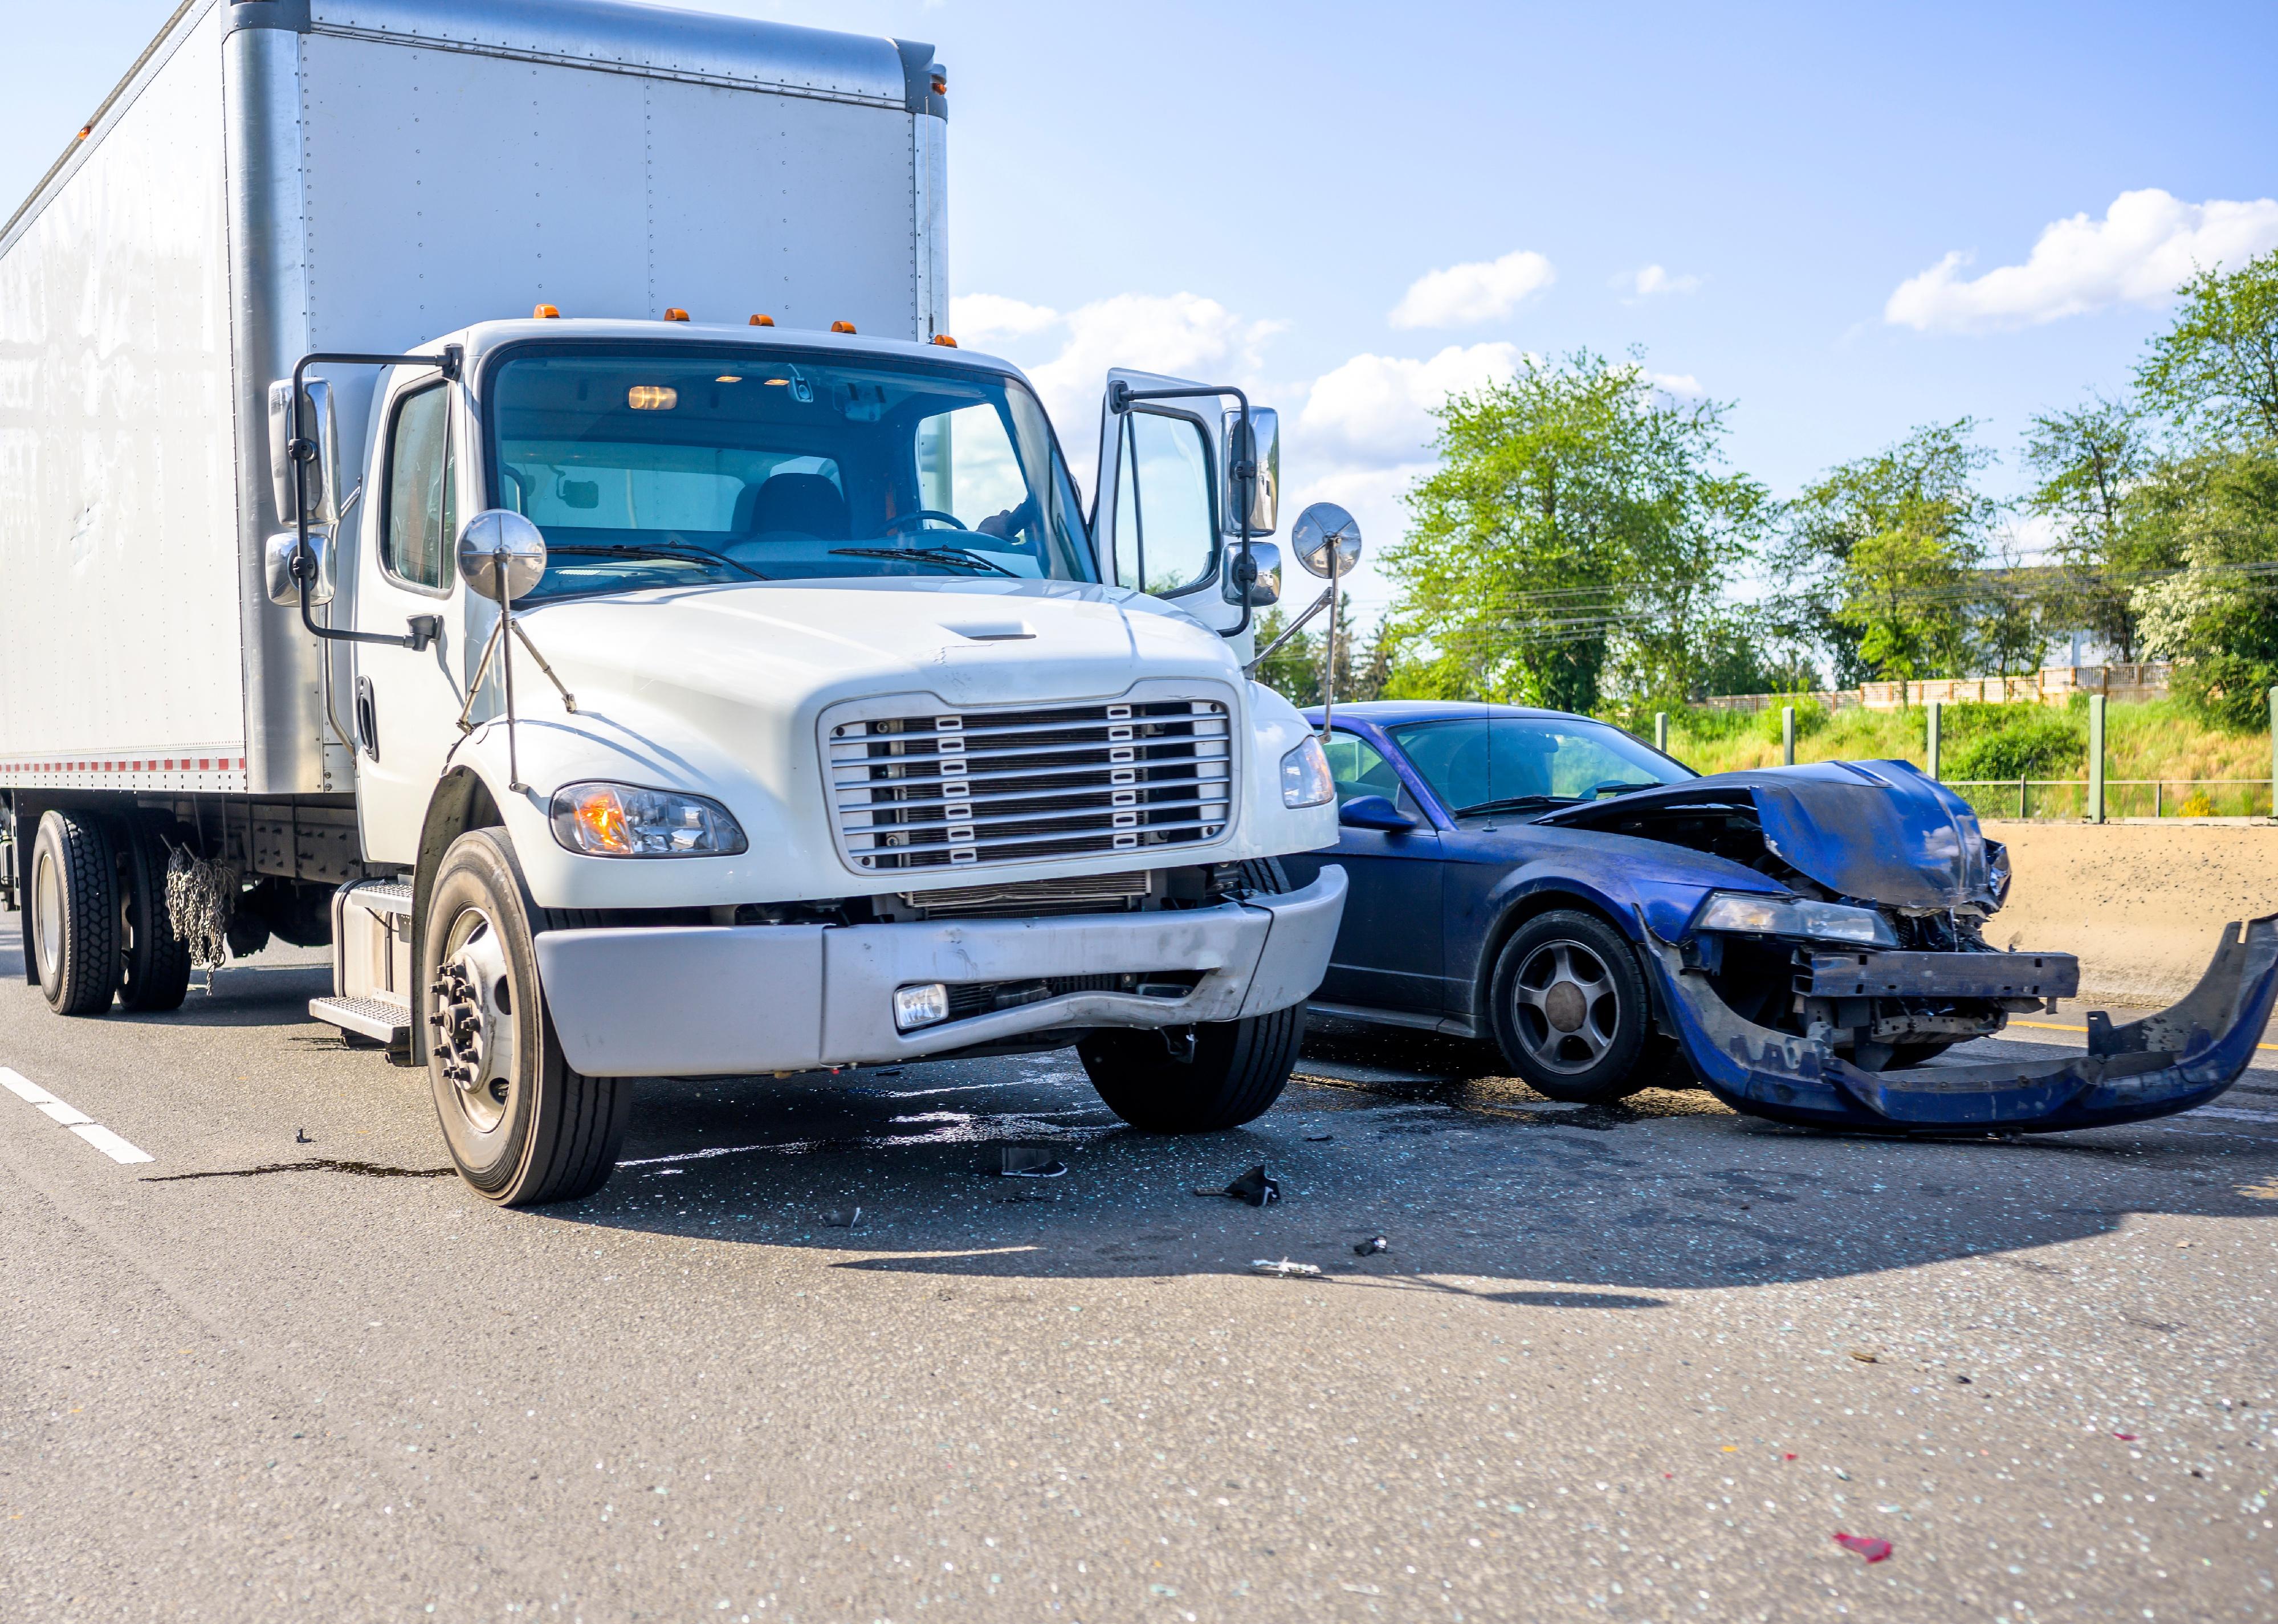
#7. Little Rock, Arkansas
Collision of a semi-truck and a passenger car on the highway.
– Motor vehicle crash fatalities: 21.73 per 100,000 residents (43 total)
– Pedestrian fatalities from vehicle crashes: 10.11 per 100,000 residents (20 total)
Dmitry Kalinovsky // Shutterstock
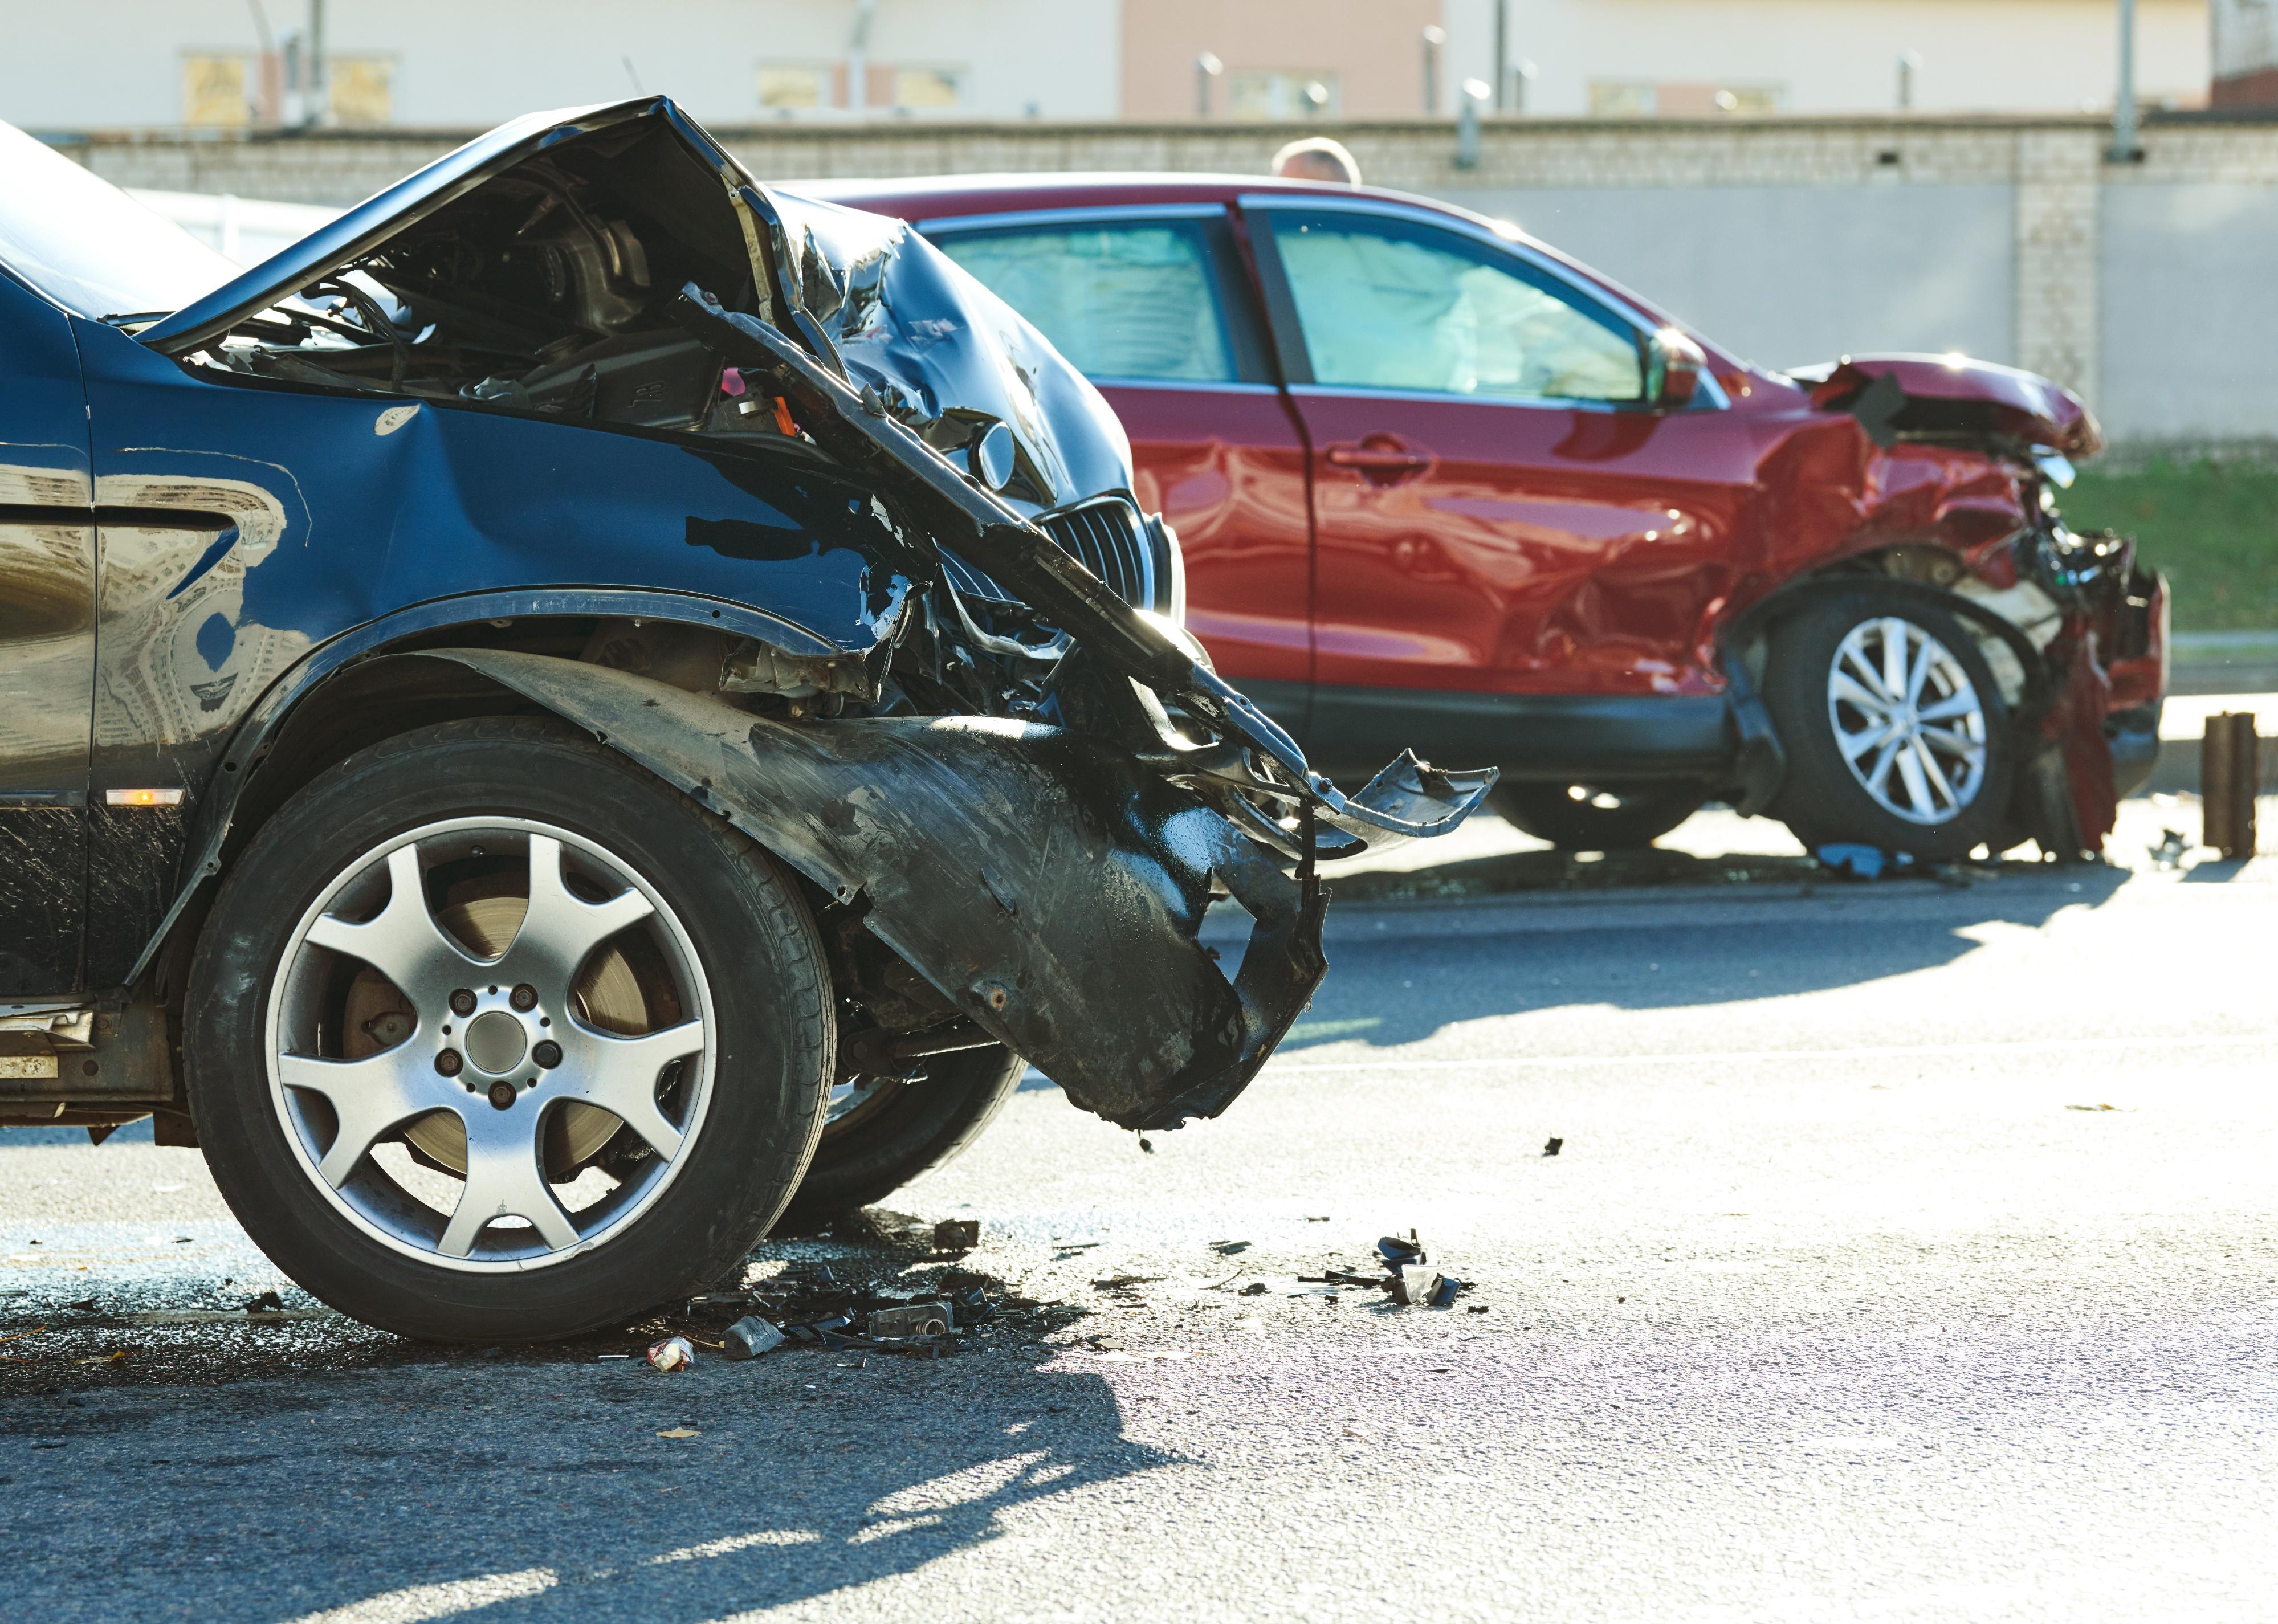
#6. Tucson, Arizona
Two cars, side view, after an accident.
– Motor vehicle crash fatalities: 22.58 per 100,000 residents (125 total)
– Pedestrian fatalities from vehicle crashes: 6.68 per 100,000 residents (37 total)
You may also like: What a Roe v. Wade reversal could mean for abortion access across America

EVA CARRE // Shutterstock
#5. Baton Rouge, Louisiana
Crime scene tape in front of an accident.
– Motor vehicle crash fatalities: 26.48 per 100,000 residents (58 total)
– Pedestrian fatalities from vehicle crashes: 9.13 per 100,000 residents (20 total)
wisawa222 // Shutterstock
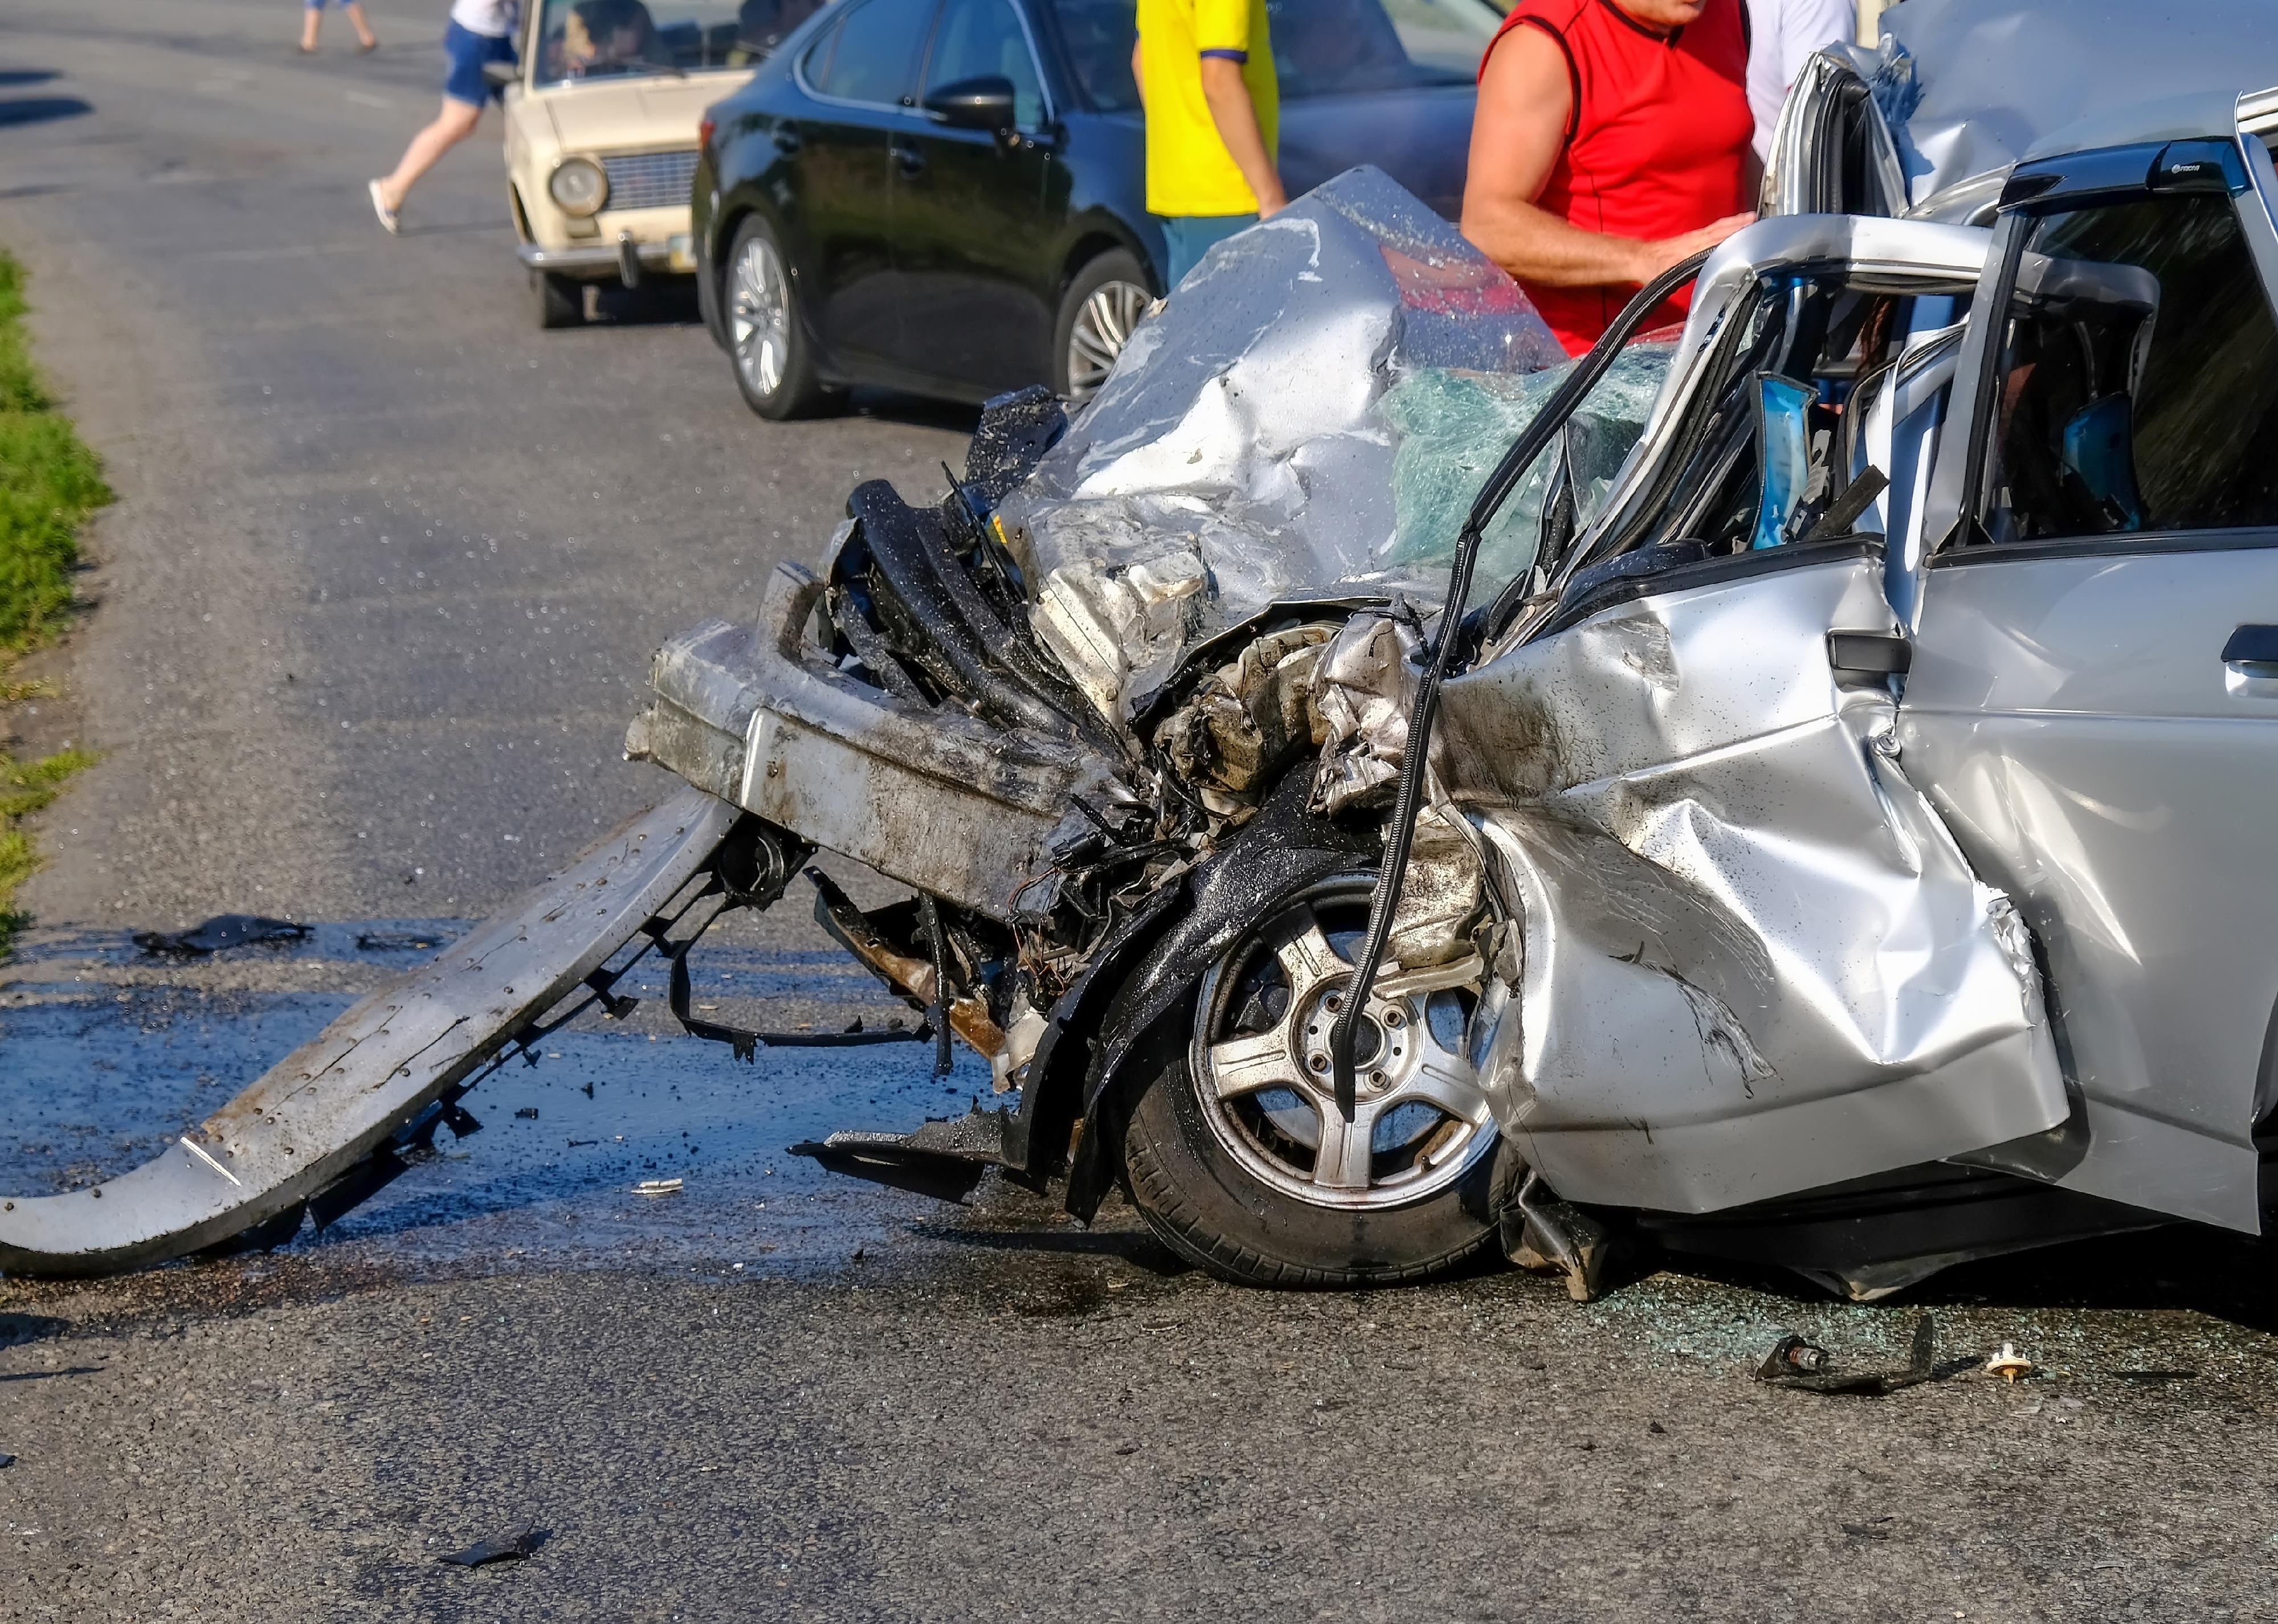
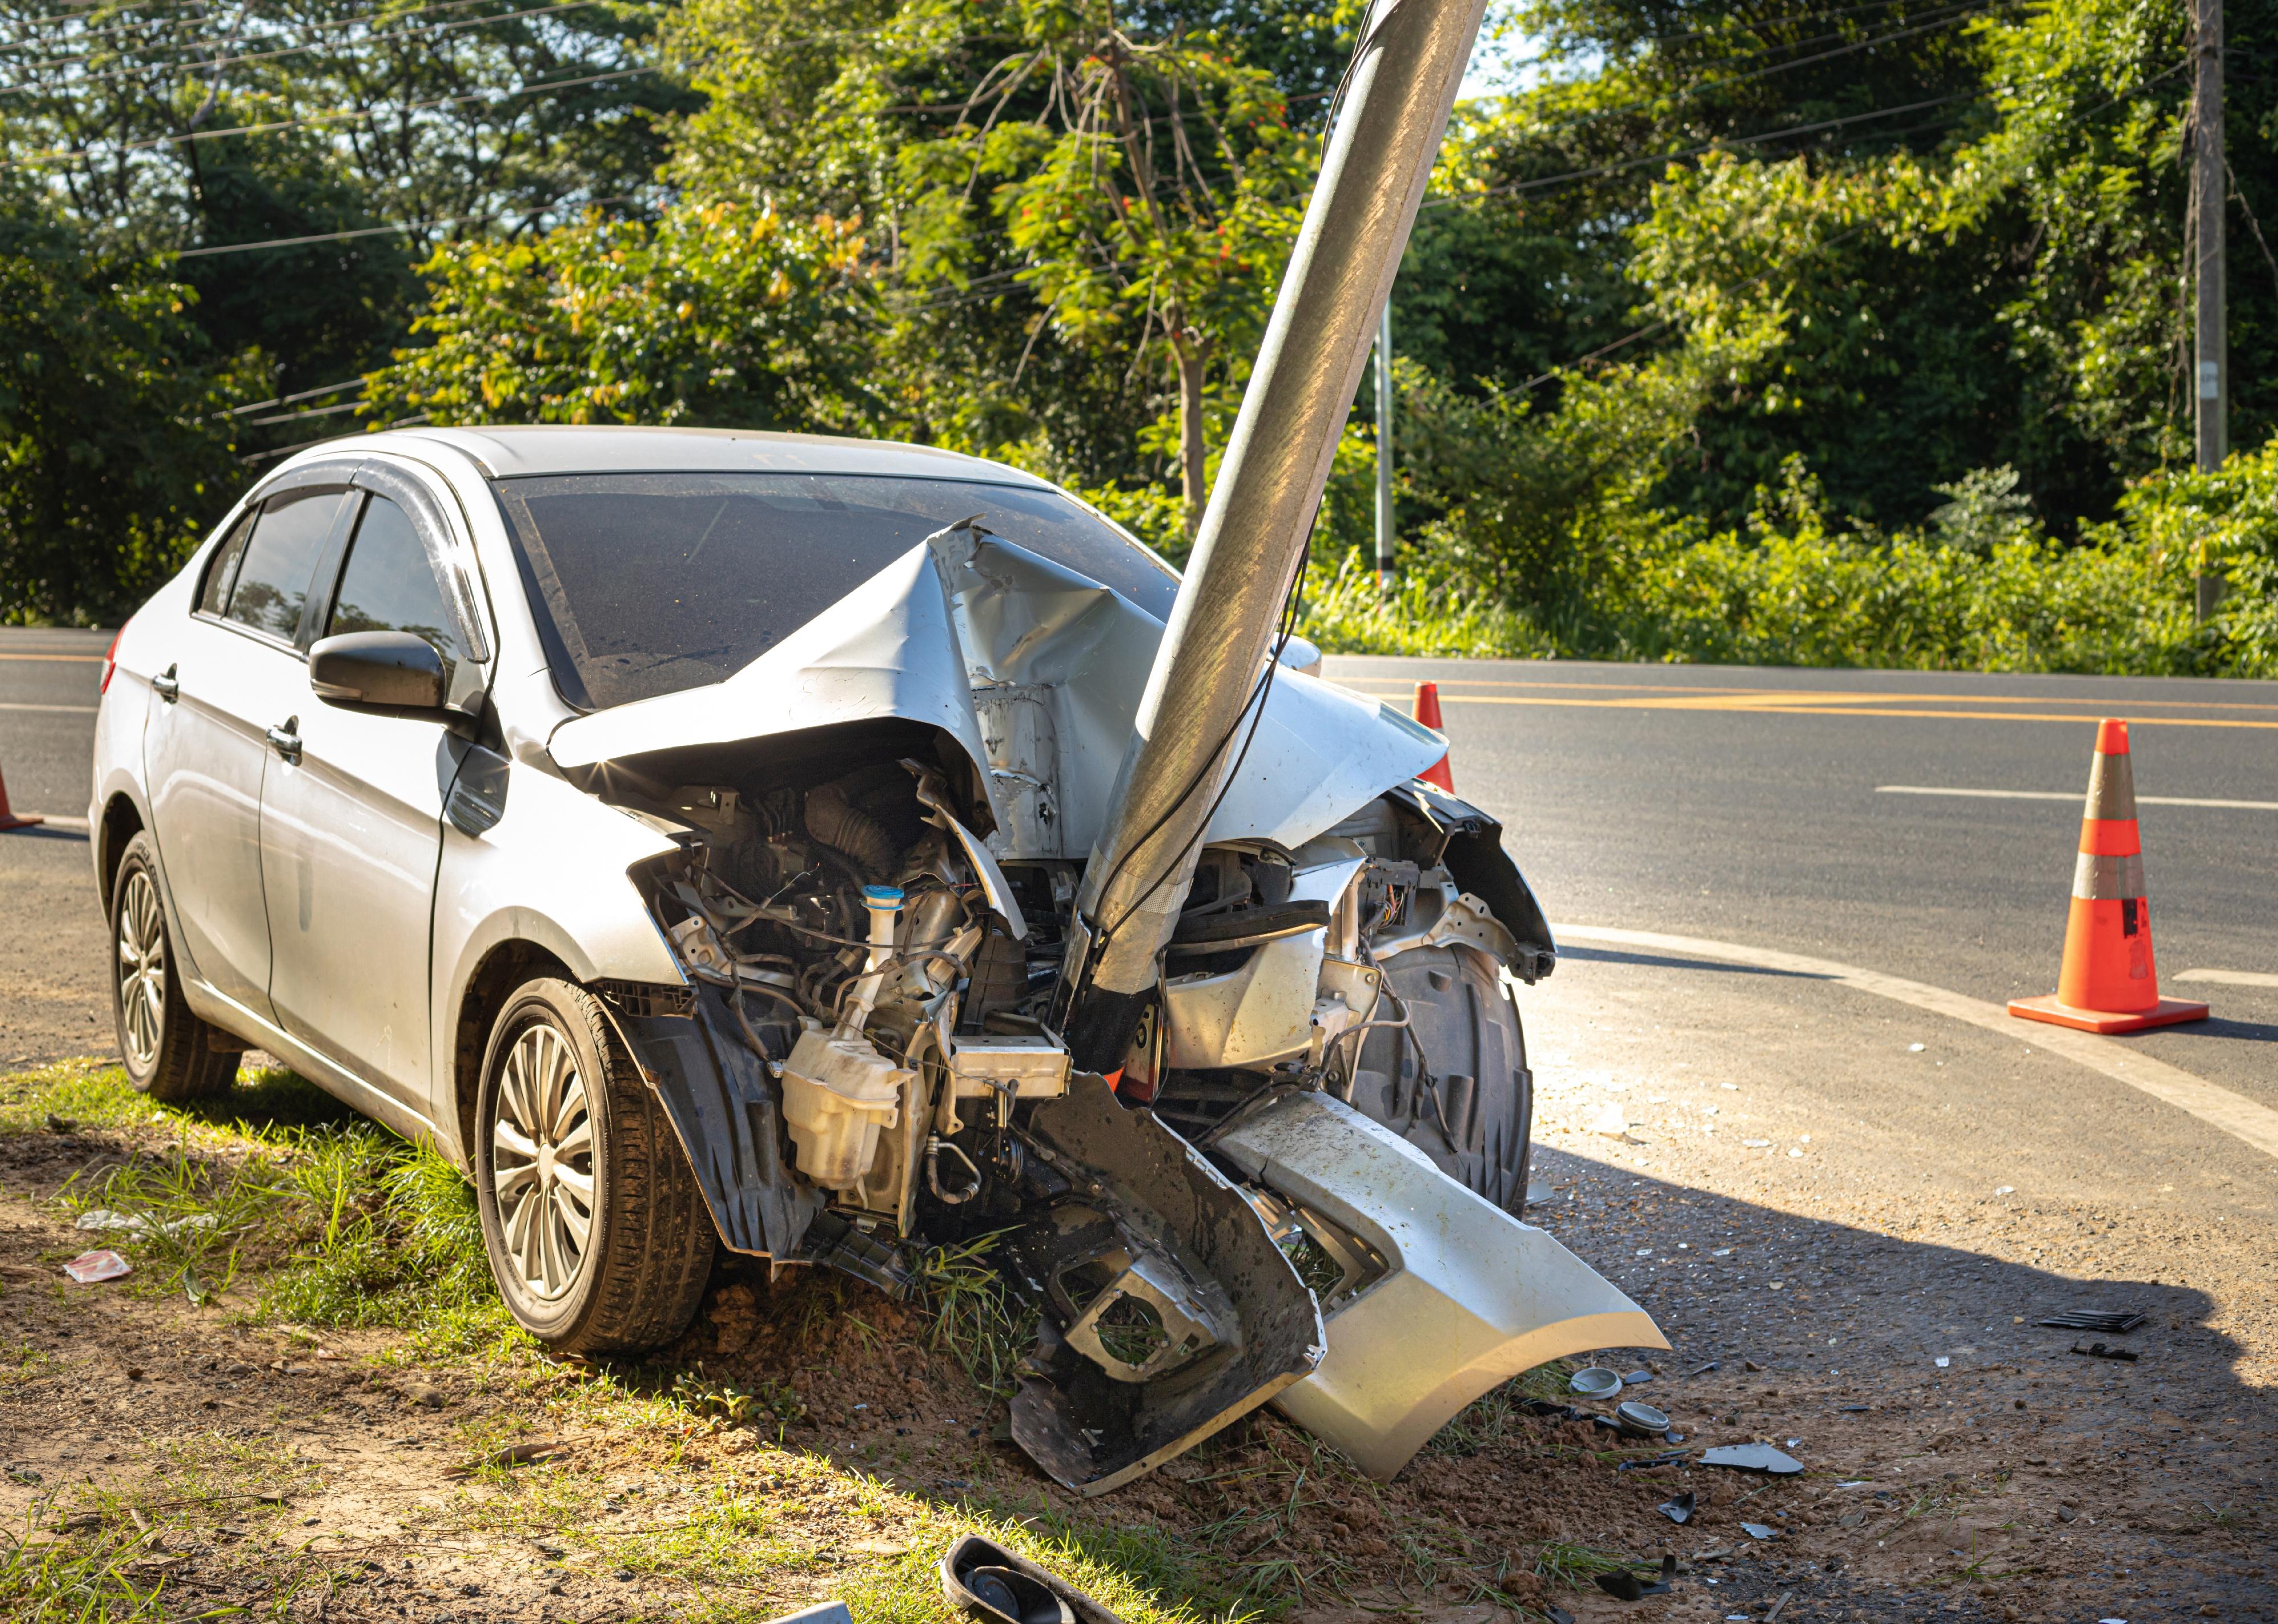
#4. St. Louis
A white sedan after a collision with an electric pole.
– Motor vehicle crash fatalities: 27.21 per 100,000 residents (81 total)
– Pedestrian fatalities from vehicle crashes: 6.72 per 100,000 residents (20 total)
desk006 // Shutterstock
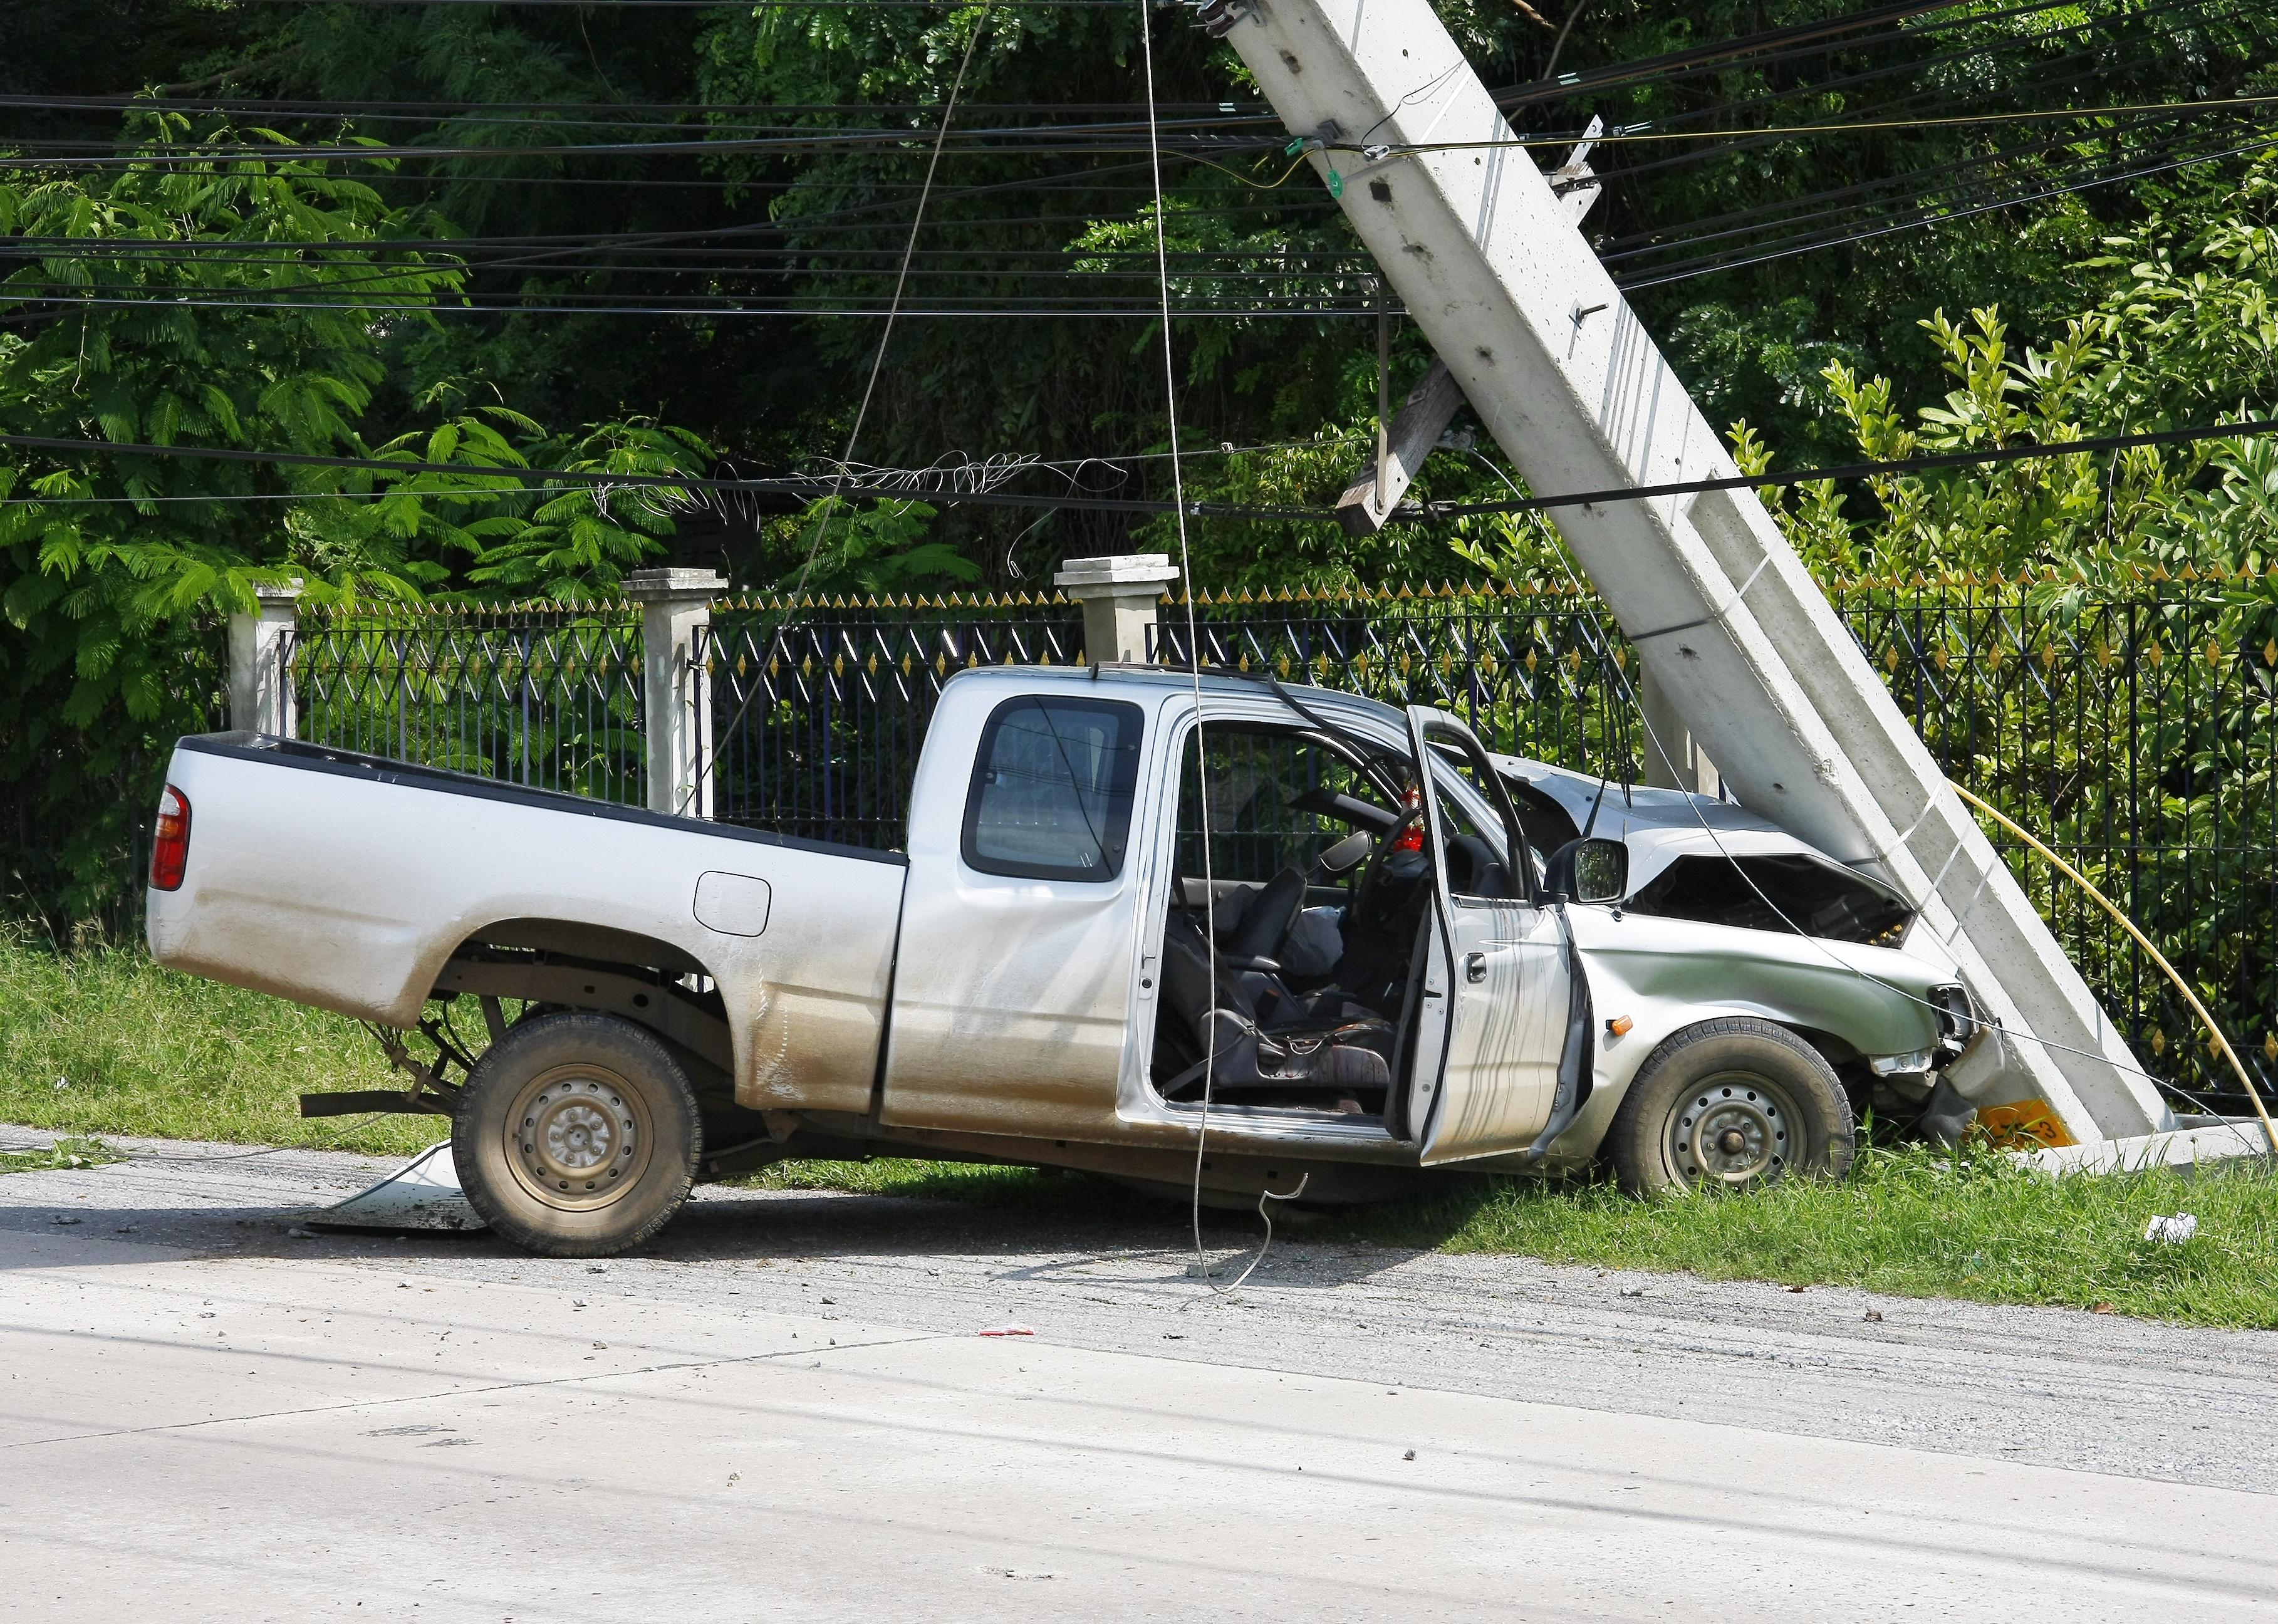
#3. Detroit
A truck after crashing into a pole.
– Motor vehicle crash fatalities: 28.71 per 100,000 residents (191 total)
– Pedestrian fatalities from vehicle crashes: 6.16 per 100,000 residents (41 total)

Laszlo66 // Shutterstock
#2. Jackson, Mississippi
Close-up of red light on police car.
– Motor vehicle crash fatalities: 33.58 per 100,000 residents (53 total)
– Pedestrian fatalities from vehicle crashes: 9.50 per 100,000 residents (15 total)
Bigc Studio // Shutterstock
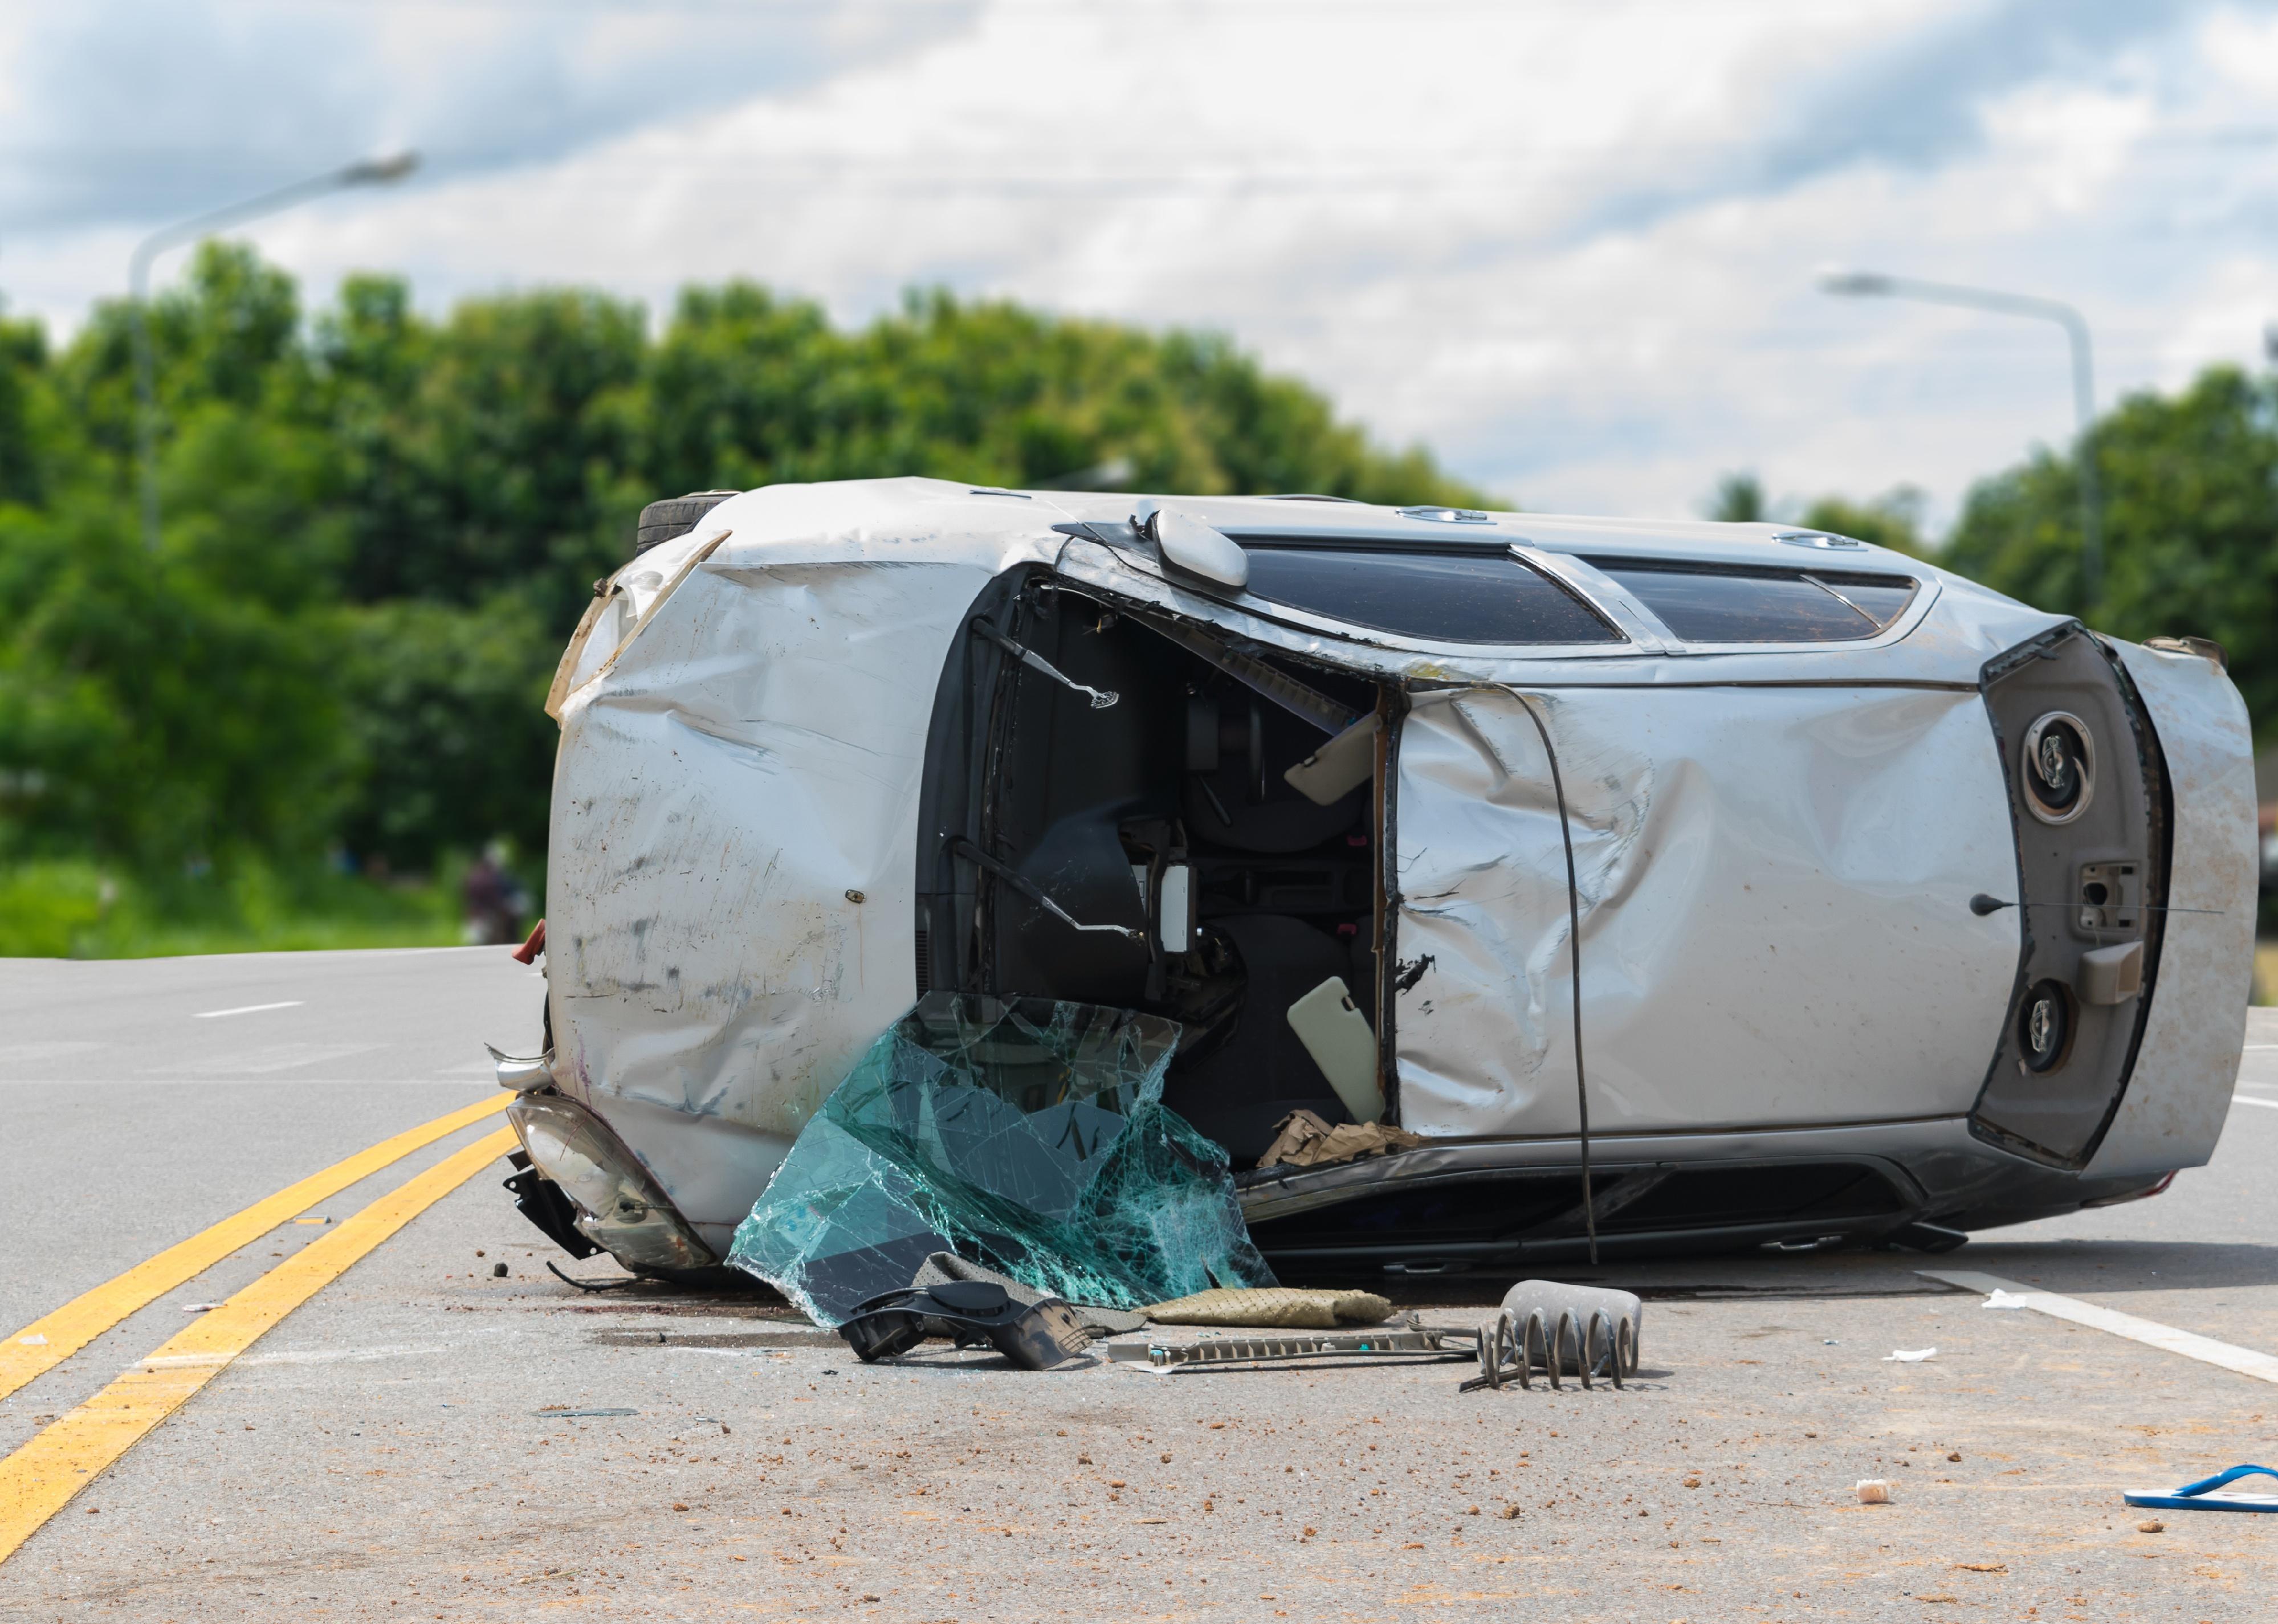
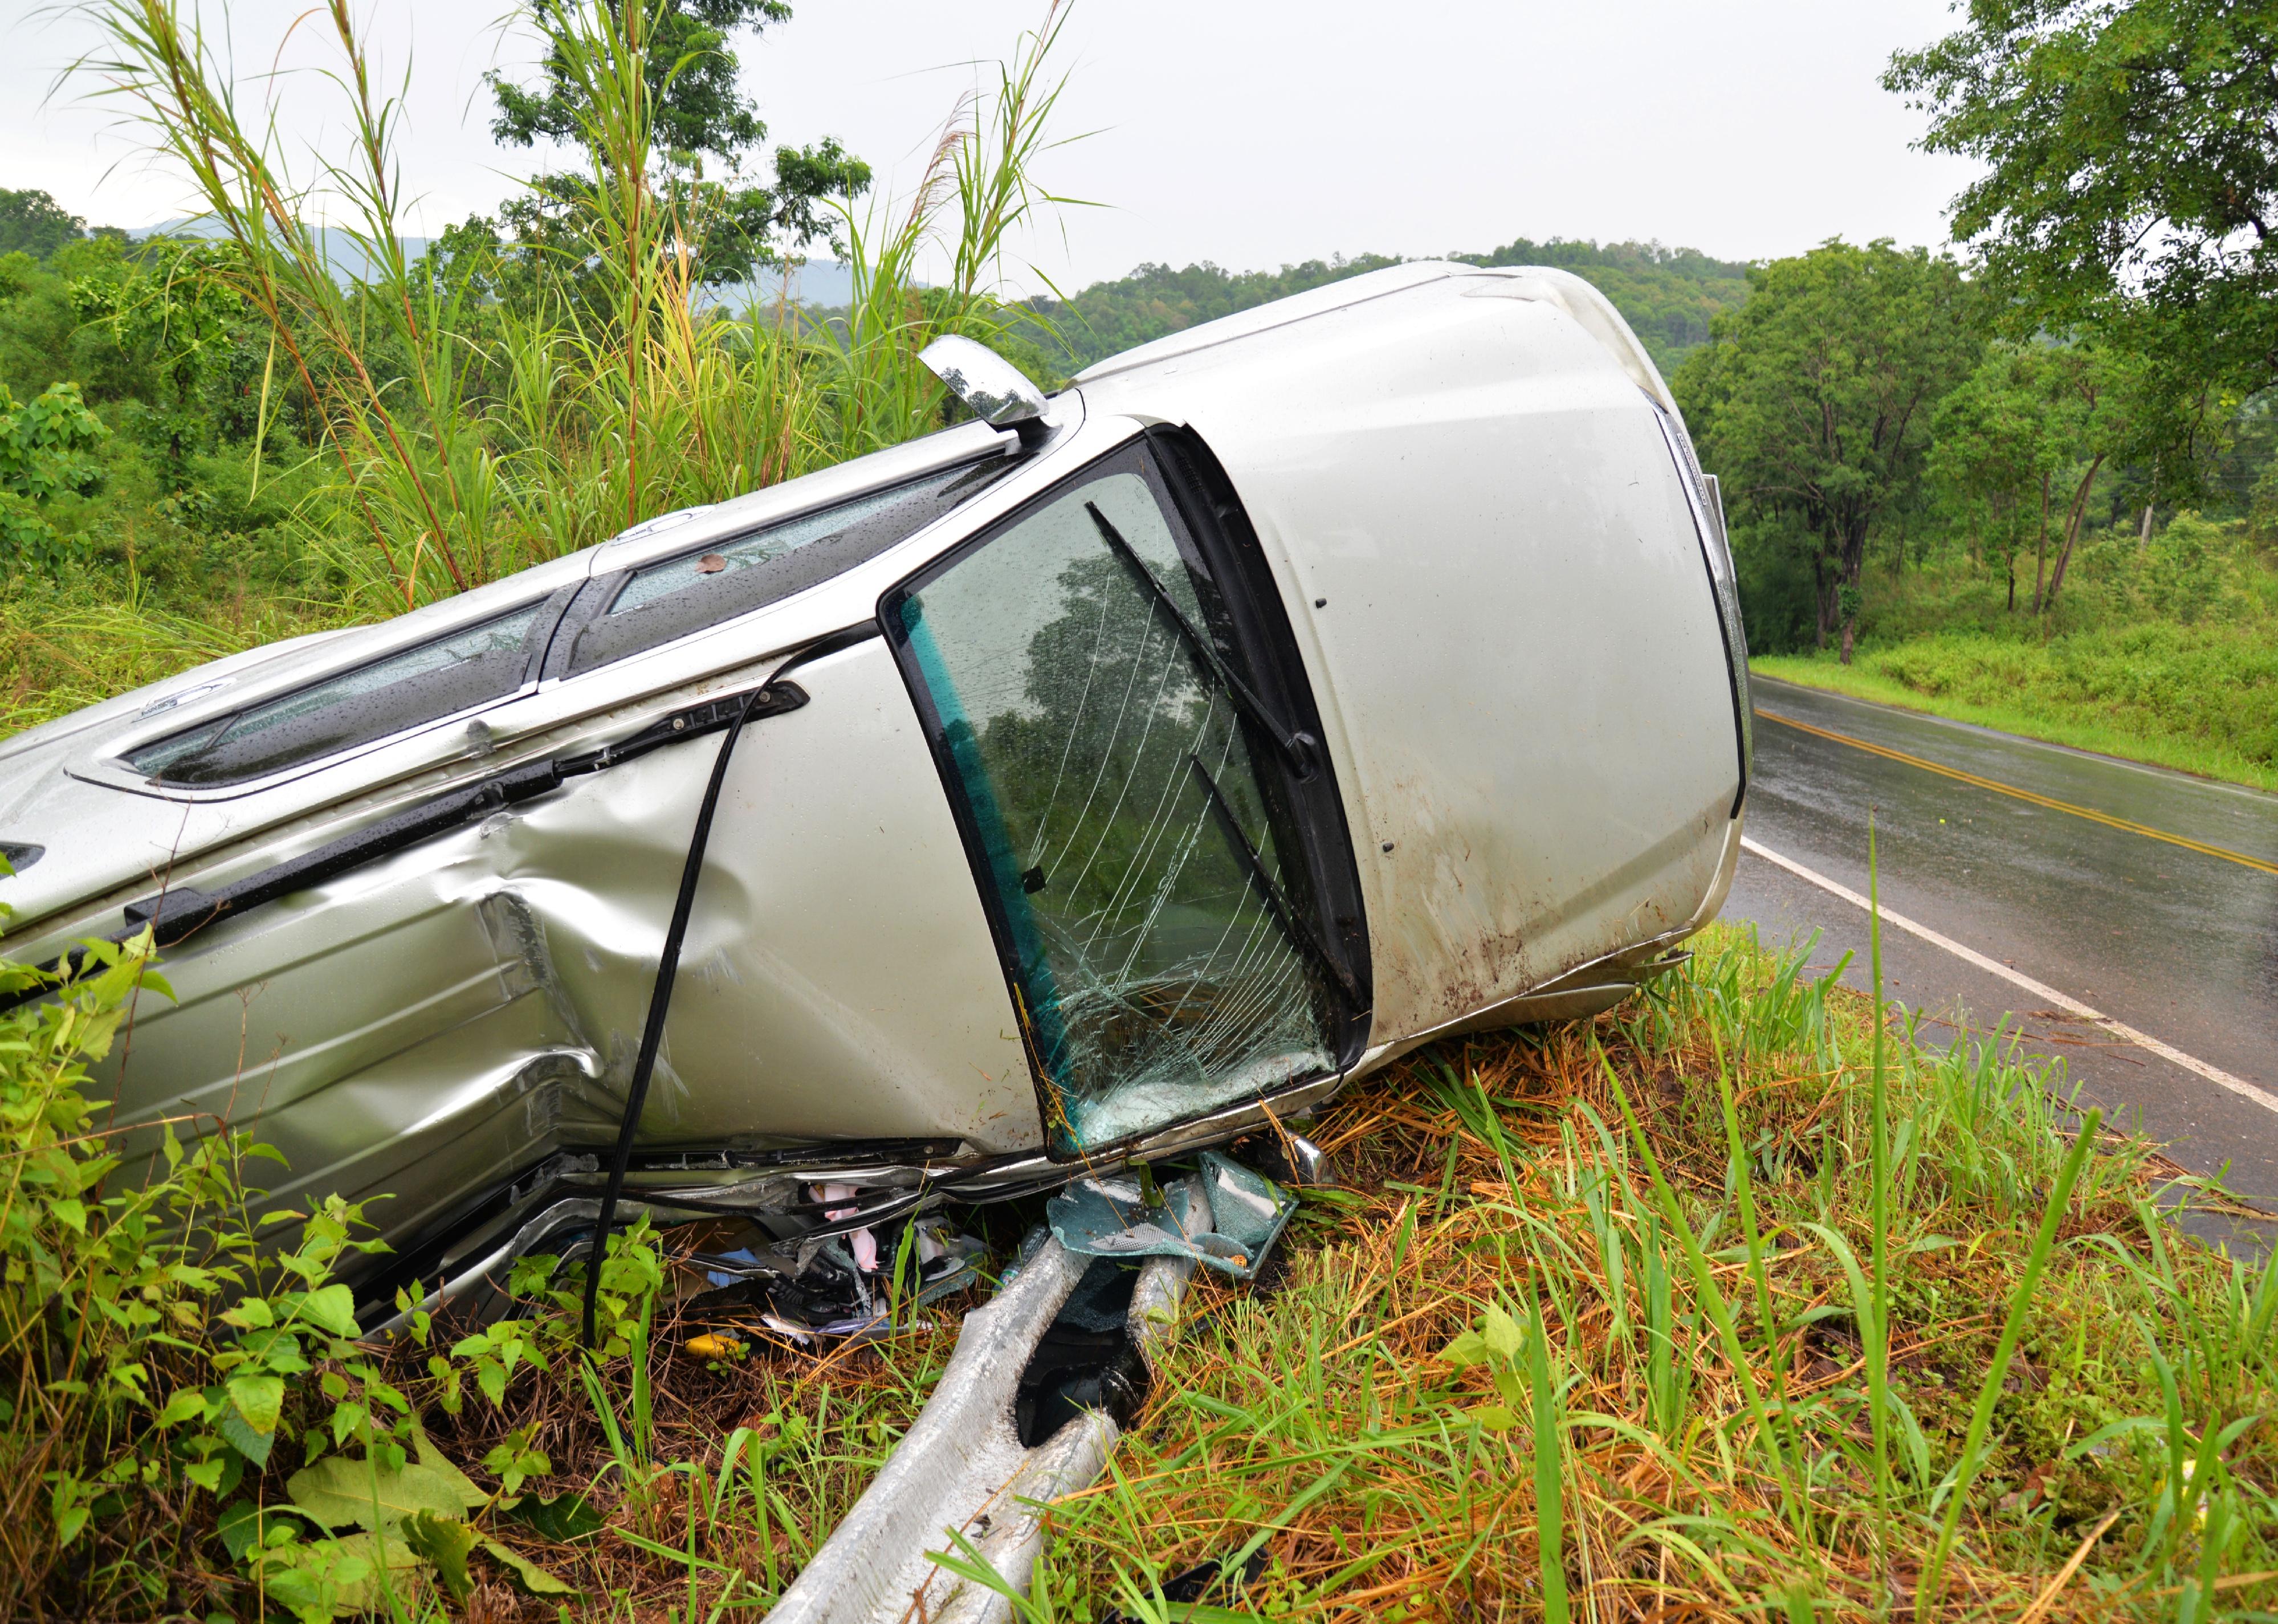
#1. Memphis, Tennessee
Car on its side next to a wet road.
– Motor vehicle crash fatalities: 34.32 per 100,000 residents (223 total)
– Pedestrian fatalities from vehicle crashes: 9.70 per 100,000 residents (63 total)
You may also like: How driving is subsidized in America