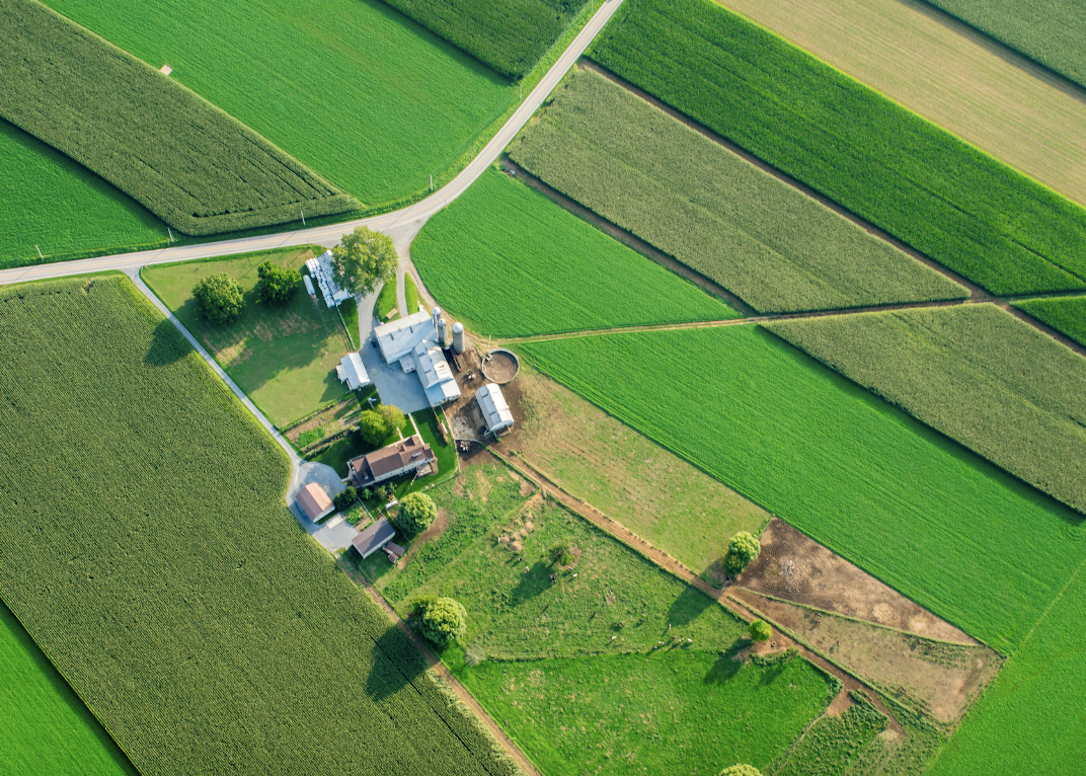
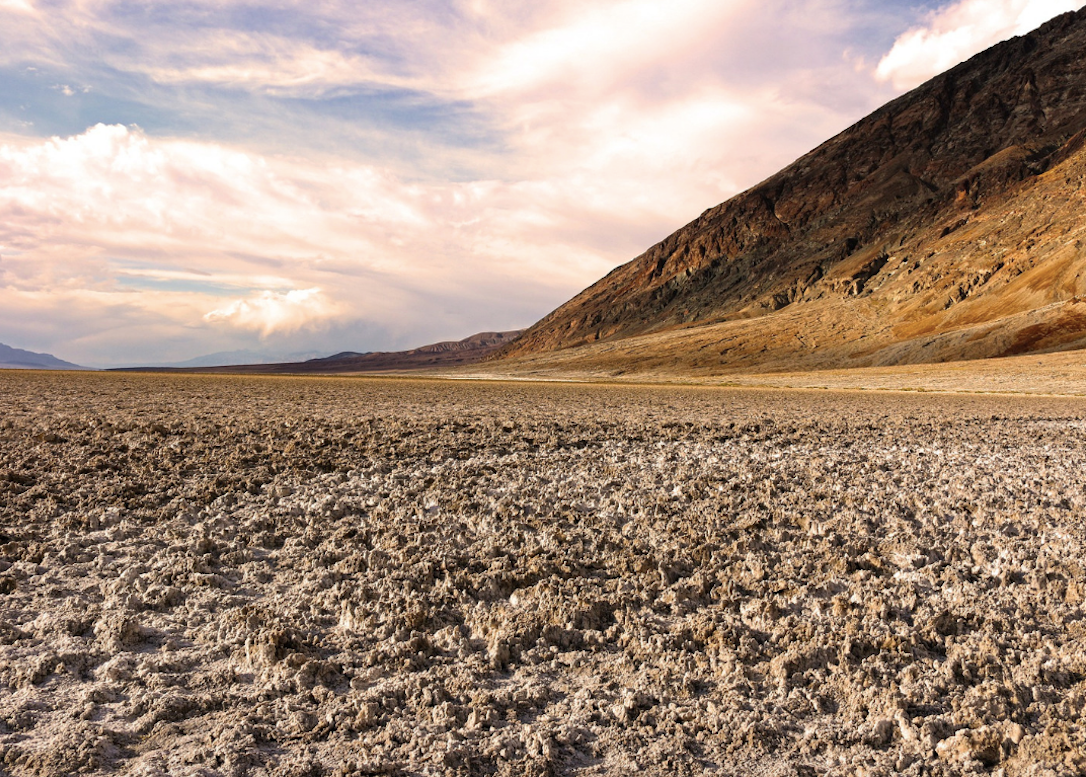
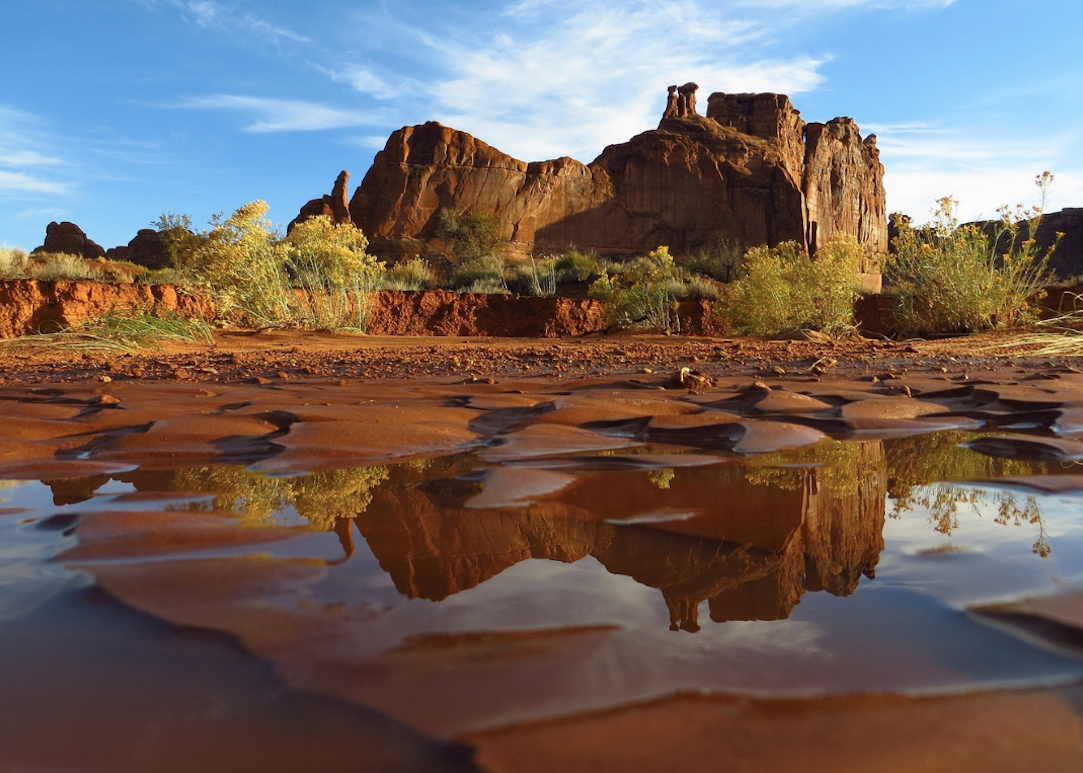
States with the worst droughts
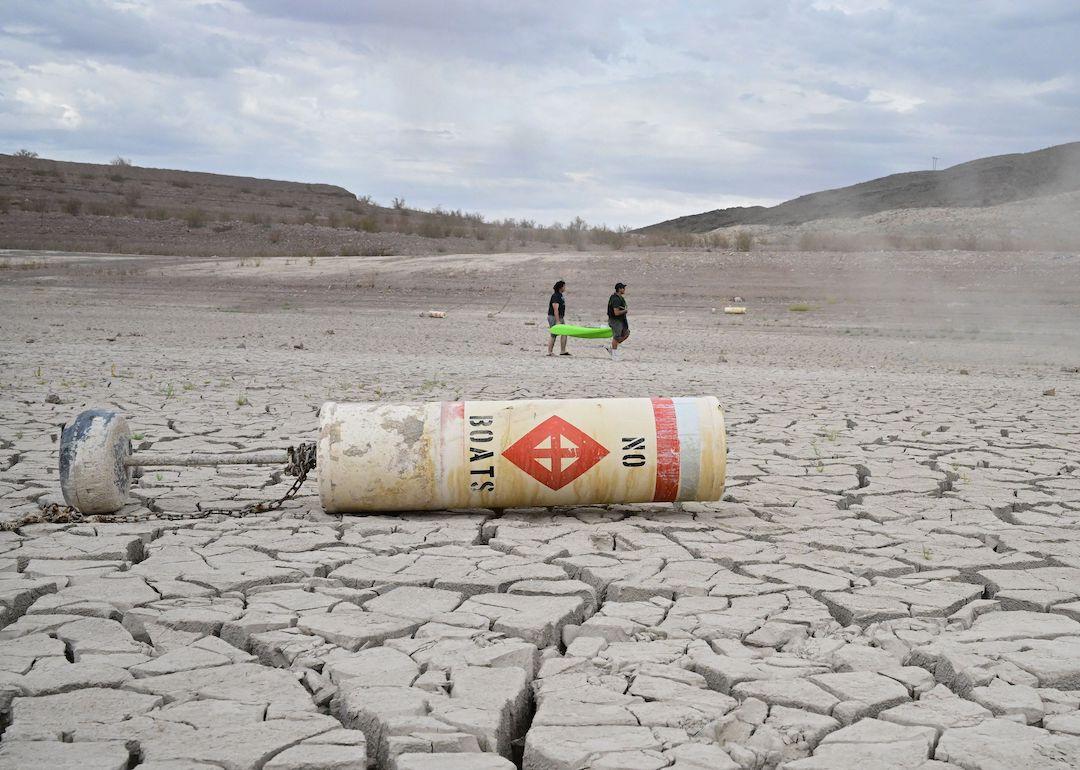
Frederic J. Brown // AFP via Getty Images
States with the worst droughts
Between 2000 and 2021, the Western U.S. experienced a megadrought that shattered the record for the driest 22-year span in the area since 800 C.E. Nearly 20% of the drought conditions can be attributed to human-caused climate change, according to a study published in Nature Climate Change.
Droughts and megadroughts—periods of drought that last several years or decades—have occurred throughout history on every continent aside from Antarctica. In the past, droughts were mostly caused by changes in tropical ocean temperatures; however, scientists predict that the increasing frequency and severity of droughts experienced in the past century will only get worse as conditions produced by climate change—less precipitation and higher temperatures—grow more extreme.
Drought conditions in the U.S. have wreaked havoc on the livelihoods of millions of people. From water rationing in California to devastating agricultural losses in the Great Plains, droughts have major environmental, economic, and social consequences. In 2012, drought in the Midwest and Great Plains alone caused $14.5 billion in loss payments from the federal crop insurance program.
Stacker cited data from the U.S. Drought Monitor to identify the states with the worst droughts based on decade averages. States are ranked by the percentage of the area in any level of drought, with the percentage of the population experiencing drought serving as a first tiebreaker and the percentage of an area experiencing severe drought as a second tiebreaker. For states not currently experiencing drought conditions, the decade average served as a tiebreaker.
The USDM categorizes drought conditions using a five-point scale ranging from “abnormally dry,” indicating some short-term crop dryness or a lingering water deficit, to “exceptional drought,” a serious condition involving a water emergency that leads to widespread crop/pasture losses.
The list also describes conditions that led to drought—or the lack thereof—in each state, while looking at the events leading up to the state’s change in drought status over the course of the year. The USDM data was collected between March 21 and 27 and was released on March 27, 2023. Continue reading to learn which states experience the worst droughts.
You may also like: How wildfires have worsened in recent years
![]()
Pixabay
#50. West Virginia
– Drought conditions, March 2023: None
– Drought conditions, decade average: 17.6% of area, affecting 15.9% of the population
Pixabay
#49. Alaska
– Drought conditions, March 2023: None
– Drought conditions, decade average: 18.7% of area, affecting 30.6% of the population
Pixabay
#48. Ohio
– Drought conditions, March 2023: None
– Drought conditions, decade average: 23.1% of area, affecting 23.4% of the population

Pixabay
#47. Illinois
– Drought conditions, March 2023: None
– Drought conditions, decade average: 25.2% of area, affecting 23.8% of the population

Pixabay
#46. Kentucky
– Drought conditions, March 2023: None
– Drought conditions, decade average: 25.8% of area, affecting 24.6% of the population
You may also like: Major cities with the biggest projected water shortages by 2040
Pixabay
#45. Tennessee
– Drought conditions, March 2023: None
– Drought conditions, decade average: 29.6% of area, affecting 30.2% of the population
Pixabay
#44. Indiana
– Drought conditions, March 2023: None
– Drought conditions, decade average: 30.4% of area, affecting 29.6% of the population
Pixabay
#43. Wisconsin
– Drought conditions, March 2023: None
– Drought conditions, decade average: 32.2% of area, affecting 32.9% of the population
Pixabay
#42. Arkansas
– Drought conditions, March 2023: None
– Drought conditions, decade average: 37.5% of area, affecting 38.7% of the population
Zach Frank // Shutterstock
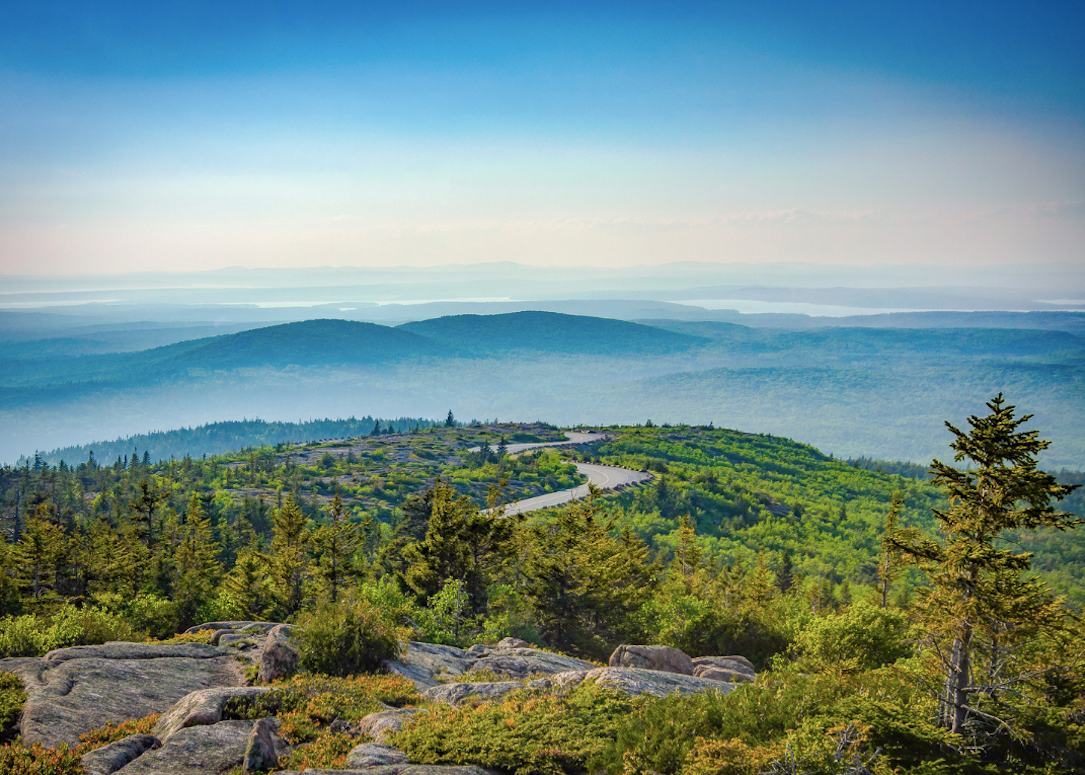
#41. Maine
– Drought conditions, March 2023: None
– Drought conditions, decade average: 38.8% of area, affecting 48.4% of the population
You may also like: Top 10 best and worst foods for the environment

Pixabay
#40. New Hampshire
– Drought conditions, March 2023: None
– Drought conditions, decade average: 49.7% of area, affecting 55.6% of the population

Pixabay
#39. Massachusetts
– Drought conditions, March 2023: None
– Drought conditions, decade average: 54.6% of area, affecting 58.0% of the population
Pixabay
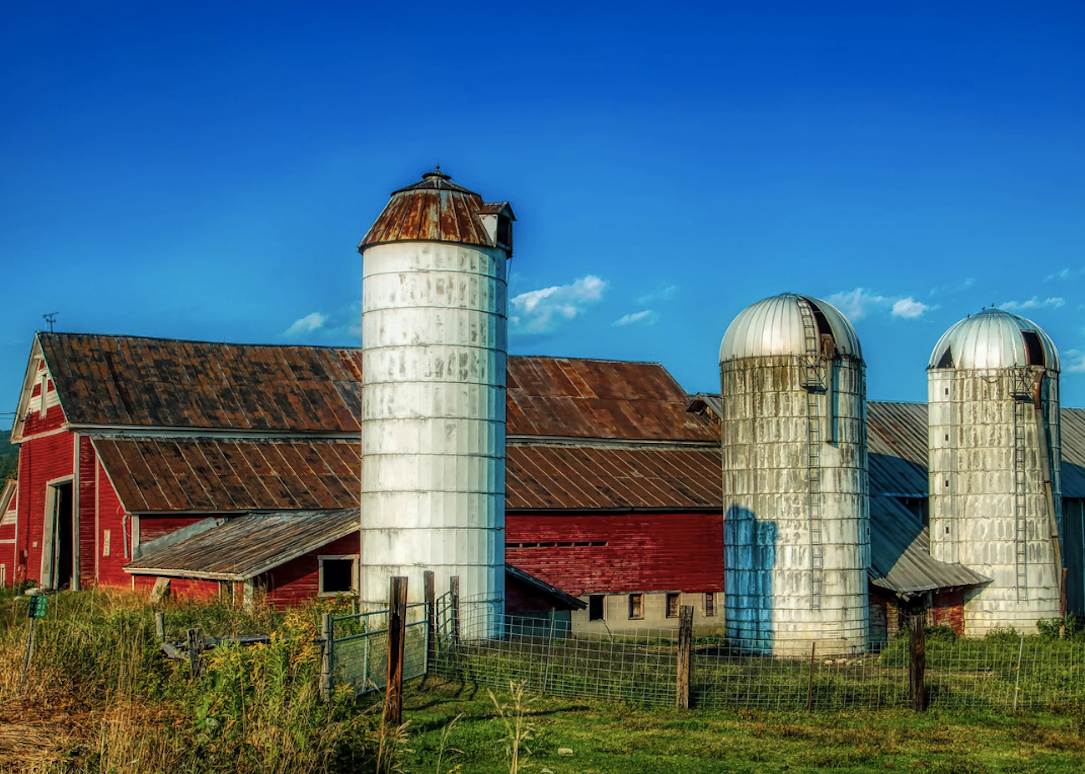
#38. Vermont
– Drought conditions, March 2023: None
– Drought conditions, decade average: 57.1% of area, affecting 56.1% of the population

Jon Bilous // Shutterstock
#37. Connecticut
– Drought conditions, March 2023: None
– Drought conditions, decade average: 68.1% of area, affecting 66.6% of the population
ecc311 // Shutterstock
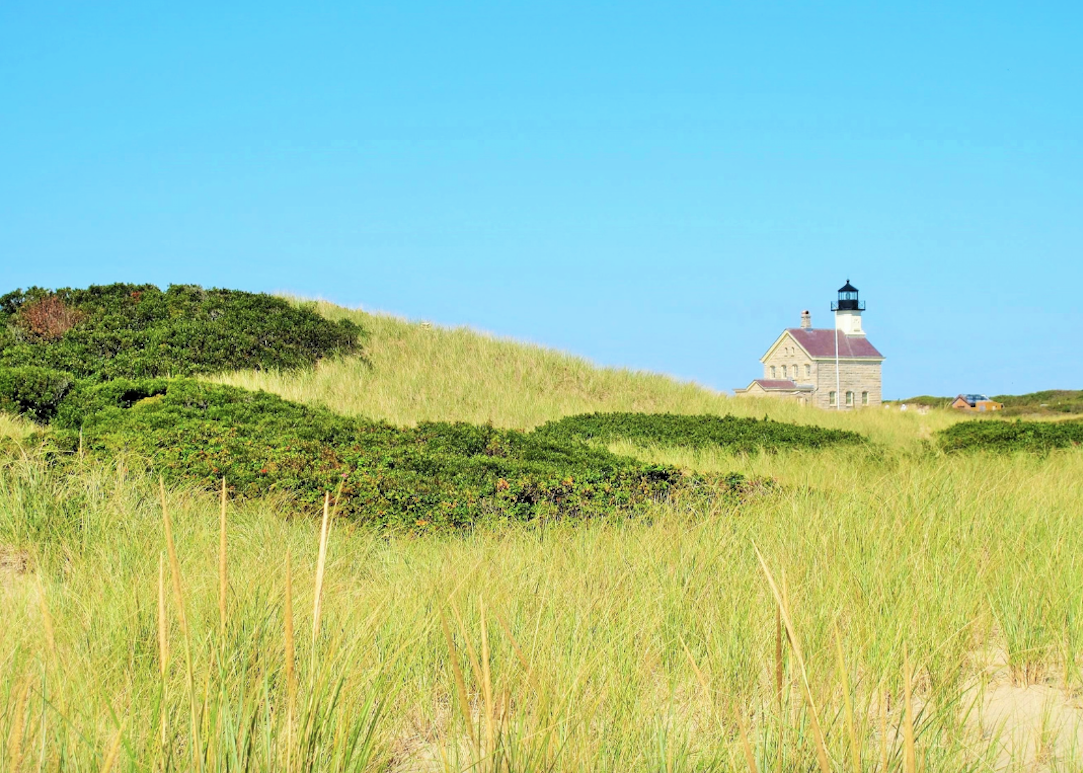
#36. Rhode Island
– Drought conditions, March 2023: None
– Drought conditions, decade average: 80.5% of area, affecting 79.5% of the population
You may also like: Most expensive climate disasters in recent decades
Pixabay
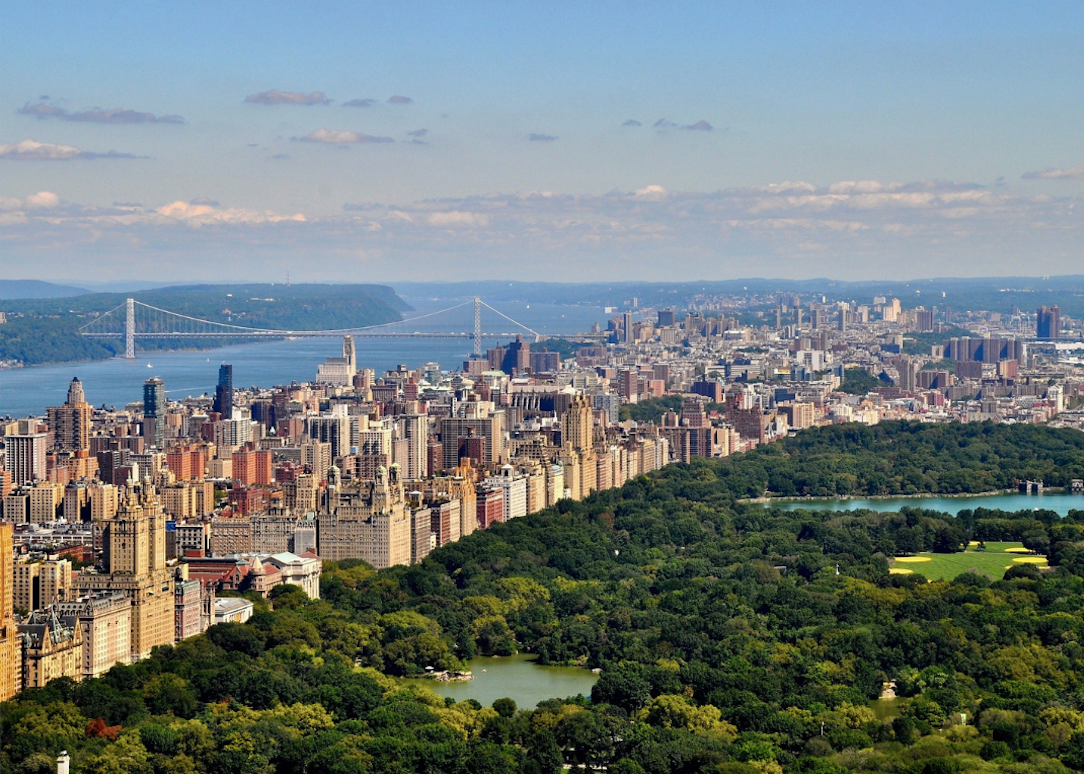
#35. New York
– Drought conditions, March 2023: 1.9% of area, affecting 8.6% of population (1.7 million people)
— Abnormally dry: 1.9% of area, 8.6% of population (1,667,153 people)
— Moderate drought: 0.0% of area, 0.0% of population (0 people)
— Severe drought: 0.0% of area, 0.0% of population (0 people)
— Extreme drought: 0.0% of area, 0.0% of population (0 people)
— Exceptional drought: 0.0% of area, 0.0% of population (0 people)
– Drought conditions, decade average: 33.9% of area, affecting 39.2% of the population
CEW // Shutterstock
#34. Pennsylvania
– Drought conditions, March 2023: 3.9% of area, affecting 10.2% of population (1.3 million people)
— Abnormally dry: 3.9% of area, 10.2% of population (1,297,760 people)
— Moderate drought: 0.0% of area, 0.0% of population (0 people)
— Severe drought: 0.0% of area, 0.0% of population (0 people)
— Extreme drought: 0.0% of area, 0.0% of population (0 people)
— Exceptional drought: 0.0% of area, 0.0% of population (0 people)
– Drought conditions, decade average: 29.6% of area, affecting 27.5% of the population
Pixabay
#33. Mississippi
– Drought conditions, March 2023: 6.5% of area, affecting 14.2% of population (420,991 people)
— Abnormally dry: 6.5% of area, 14.1% of population (419,088 people)
— Moderate drought: 0.0% of area, 0.1% of population (1,903 people)
— Severe drought: 0.0% of area, 0.0% of population (0 people)
— Extreme drought: 0.0% of area, 0.0% of population (0 people)
— Exceptional drought: 0.0% of area, 0.0% of population (0 people)
– Drought conditions, decade average: 34.1% of area, affecting 33.5% of the population
Pixabay
#32. Missouri
– Drought conditions, March 2023: 7.5% of area, affecting 5.5% of population (328,164 people)
— Abnormally dry: 6.0% of area, 4.8% of population (285,864 people)
— Moderate drought: 1.3% of area, 0.7% of population (39,068 people)
— Severe drought: 0.2% of area, 0.1% of population (3,232 people)
— Extreme drought: 0.0% of area, 0.0% of population (0 people)
— Exceptional drought: 0.0% of area, 0.0% of population (0 people)
– Drought conditions, decade average: 38.6% of area, affecting 35.8% of the population
Chichimaru // Shhutterstock
#31. Michigan
– Drought conditions, March 2023: 10.1% of area, affecting 32.2% of population (3.2 million people)
— Abnormally dry: 7.6% of area, 20.6% of population (2,036,159 people)
— Moderate drought: 2.5% of area, 11.6% of population (1,141,642 people)
— Severe drought: 0.0% of area, 0.0% of population (0 people)
— Extreme drought: 0.0% of area, 0.0% of population (0 people)
— Exceptional drought: 0.0% of area, 0.0% of population (0 people)
– Drought conditions, decade average: 30.4% of area, affecting 35.7% of the population
You may also like: How US trees are powering Europe’s renewable energy goals
Ritu Manoj Jethani // Shutterstock
#30. Delaware
– Drought conditions, March 2023: 12.5% of area, affecting 31.7% of population (284,390 people)
— Abnormally dry: 12.5% of area, 31.7% of population (284,390 people)
— Moderate drought: 0.0% of area, 0.0% of population (0 people)
— Severe drought: 0.0% of area, 0.0% of population (0 people)
— Extreme drought: 0.0% of area, 0.0% of population (0 people)
— Exceptional drought: 0.0% of area, 0.0% of population (0 people)
– Drought conditions, decade average: 35.3% of area, affecting 36.8% of the population

Pixabay
#29. South Carolina
– Drought conditions, March 2023: 16.1% of area, affecting 14.1% of population (627,703 people)
— Abnormally dry: 16.1% of area, 14.1% of population (627,703 people)
— Moderate drought: 0.0% of area, 0.0% of population (0 people)
— Severe drought: 0.0% of area, 0.0% of population (0 people)
— Extreme drought: 0.0% of area, 0.0% of population (0 people)
— Exceptional drought: 0.0% of area, 0.0% of population (0 people)
– Drought conditions, decade average: 37.3% of area, affecting 35.5% of the population

Susanne Pommer // Shutterstock
#28. Georgia
– Drought conditions, March 2023: 17.3% of area, affecting 5.2% of population (500,933 people)
— Abnormally dry: 12.2% of area, 3.9% of population (377,192 people)
— Moderate drought: 5.1% of area, 1.3% of population (123,741 people)
— Severe drought: 0.0% of area, 0.0% of population (0 people)
— Extreme drought: 0.0% of area, 0.0% of population (0 people)
— Exceptional drought: 0.0% of area, 0.0% of population (0 people)
– Drought conditions, decade average: 38.3% of area, affecting 35.4% of the population
Pixabay
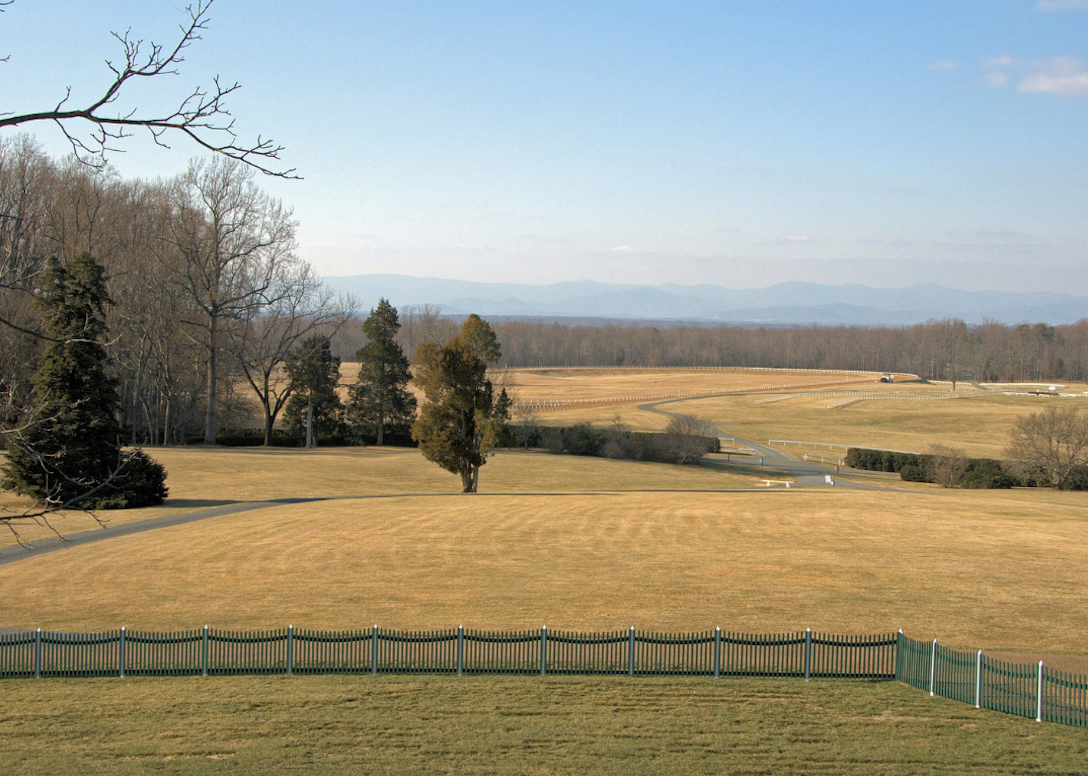
#27. Virginia
– Drought conditions, March 2023: 22.5% of area, affecting 27.0% of population (2.1 million people)
— Abnormally dry: 21.7% of area, 26.7% of population (2,108,739 people)
— Moderate drought: 0.8% of area, 0.3% of population (21,963 people)
— Severe drought: 0.0% of area, 0.0% of population (0 people)
— Extreme drought: 0.0% of area, 0.0% of population (0 people)
— Exceptional drought: 0.0% of area, 0.0% of population (0 people)
– Drought conditions, decade average: 30.6% of area, affecting 29.1% of the population

Sean Pavone // Shutterstock
#26. Louisiana
– Drought conditions, March 2023: 22.6% of area, affecting 38.3% of population (1.7 million people)
— Abnormally dry: 11.9% of area, 27.0% of population (1,223,998 people)
— Moderate drought: 10.6% of area, 11.3% of population (510,364 people)
— Severe drought: 0.0% of area, 0.0% of population (0 people)
— Extreme drought: 0.0% of area, 0.0% of population (0 people)
— Exceptional drought: 0.0% of area, 0.0% of population (0 people)
– Drought conditions, decade average: 39.1% of area, affecting 38.1% of the population
You may also like: How far is the US from a 100% renewable energy future?
Pixabay
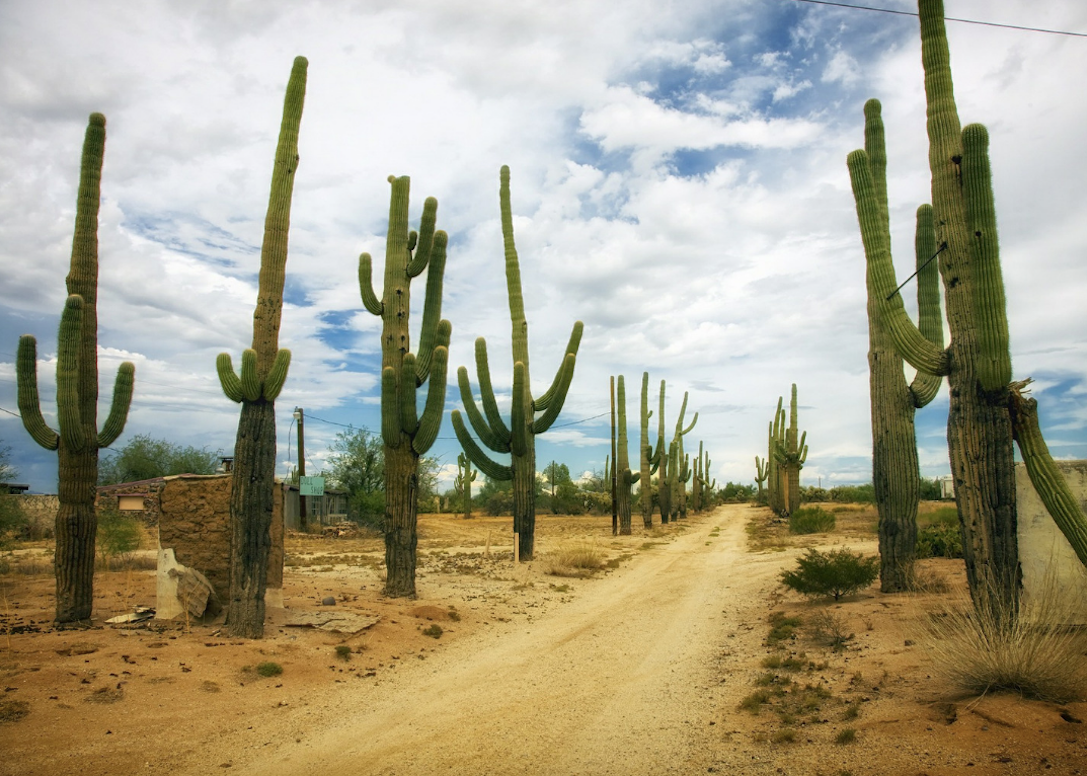
#25. Arizona
– Drought conditions, March 2023: 24.5% of area, affecting 16.5% of population (1.1 million people)
— Abnormally dry: 16.2% of area, 13.7% of population (877,466 people)
— Moderate drought: 8.3% of area, 2.7% of population (174,182 people)
— Severe drought: 0.0% of area, 0.0% of population (547 people)
— Extreme drought: 0.0% of area, 0.0% of population (0 people)
— Exceptional drought: 0.0% of area, 0.0% of population (0 people)
– Drought conditions, decade average: 81.3% of area, affecting 80.7% of the population

Pixabay
#24. New Jersey
– Drought conditions, March 2023: 27.2% of area, affecting 12.2% of population (1.1 million people)
— Abnormally dry: 27.2% of area, 12.2% of population (1,073,243 people)
— Moderate drought: 0.0% of area, 0.0% of population (0 people)
— Severe drought: 0.0% of area, 0.0% of population (0 people)
— Extreme drought: 0.0% of area, 0.0% of population (0 people)
— Exceptional drought: 0.0% of area, 0.0% of population (0 people)
– Drought conditions, decade average: 40.6% of area, affecting 45.8% of the population
Pixabay
#23. Alabama
– Drought conditions, March 2023: 30.1% of area, affecting 24.1% of population (1.2 million people)
— Abnormally dry: 29.3% of area, 22.9% of population (1,092,699 people)
— Moderate drought: 0.8% of area, 1.2% of population (57,539 people)
— Severe drought: 0.0% of area, 0.0% of population (0 people)
— Extreme drought: 0.0% of area, 0.0% of population (0 people)
— Exceptional drought: 0.0% of area, 0.0% of population (0 people)
– Drought conditions, decade average: 35.7% of area, affecting 35.6% of the population
Joseph Sohm // Shutterstock
#22. Maryland
– Drought conditions, March 2023: 32.9% of area, affecting 33.5% of population (1.7 million people)
— Abnormally dry: 32.9% of area, 33.5% of population (1,725,753 people)
— Moderate drought: 0.0% of area, 0.0% of population (0 people)
— Severe drought: 0.0% of area, 0.0% of population (0 people)
— Extreme drought: 0.0% of area, 0.0% of population (0 people)
— Exceptional drought: 0.0% of area, 0.0% of population (0 people)
– Drought conditions, decade average: 25.6% of area, affecting 27.0% of the population

John_T // Shutterstock
#21. North Carolina
– Drought conditions, March 2023: 40.0% of area, affecting 25.2% of population (2.4 million people)
— Abnormally dry: 37.6% of area, 23.9% of population (2,275,391 people)
— Moderate drought: 2.4% of area, 1.3% of population (122,440 people)
— Severe drought: 0.0% of area, 0.0% of population (0 people)
— Extreme drought: 0.0% of area, 0.0% of population (0 people)
— Exceptional drought: 0.0% of area, 0.0% of population (0 people)
– Drought conditions, decade average: 35.8% of area, affecting 37.5% of the population
You may also like: States with the worst droughts
Edgar Lee Espe // Shutterstock
#20. Minnesota
– Drought conditions, March 2023: 41.4% of area, affecting 15.2% of population (803,368 people)
— Abnormally dry: 25.8% of area, 10.0% of population (527,789 people)
— Moderate drought: 15.6% of area, 5.2% of population (275,579 people)
— Severe drought: 0.0% of area, 0.0% of population (0 people)
— Extreme drought: 0.0% of area, 0.0% of population (0 people)
— Exceptional drought: 0.0% of area, 0.0% of population (0 people)
– Drought conditions, decade average: 38.9% of area, affecting 37.2% of the population
Pixabay
#19. California
– Drought conditions, March 2023: 51.5% of area, affecting 26.4% of population (9.8 million people)
— Abnormally dry: 15.6% of area, 13.9% of population (5,174,192 people)
— Moderate drought: 27.4% of area, 11.4% of population (4,256,306 people)
— Severe drought: 8.5% of area, 1.1% of population (414,708 people)
— Extreme drought: 0.0% of area, 0.0% of population (0 people)
— Exceptional drought: 0.0% of area, 0.0% of population (0 people)
– Drought conditions, decade average: 77.2% of area, affecting 80.1% of the population
Pixabay
#18. Colorado
– Drought conditions, March 2023: 53.4% of area, affecting 51.9% of population (2.6 million people)
— Abnormally dry: 17.2% of area, 21.3% of population (1,070,196 people)
— Moderate drought: 27.2% of area, 27.3% of population (1,371,522 people)
— Severe drought: 7.1% of area, 3.2% of population (163,061 people)
— Extreme drought: 1.8% of area, 0.1% of population (6,629 people)
— Exceptional drought: 0.2% of area, 0.0% of population (252 people)
– Drought conditions, decade average: 60.9% of area, affecting 53.0% of the population
Pixabay
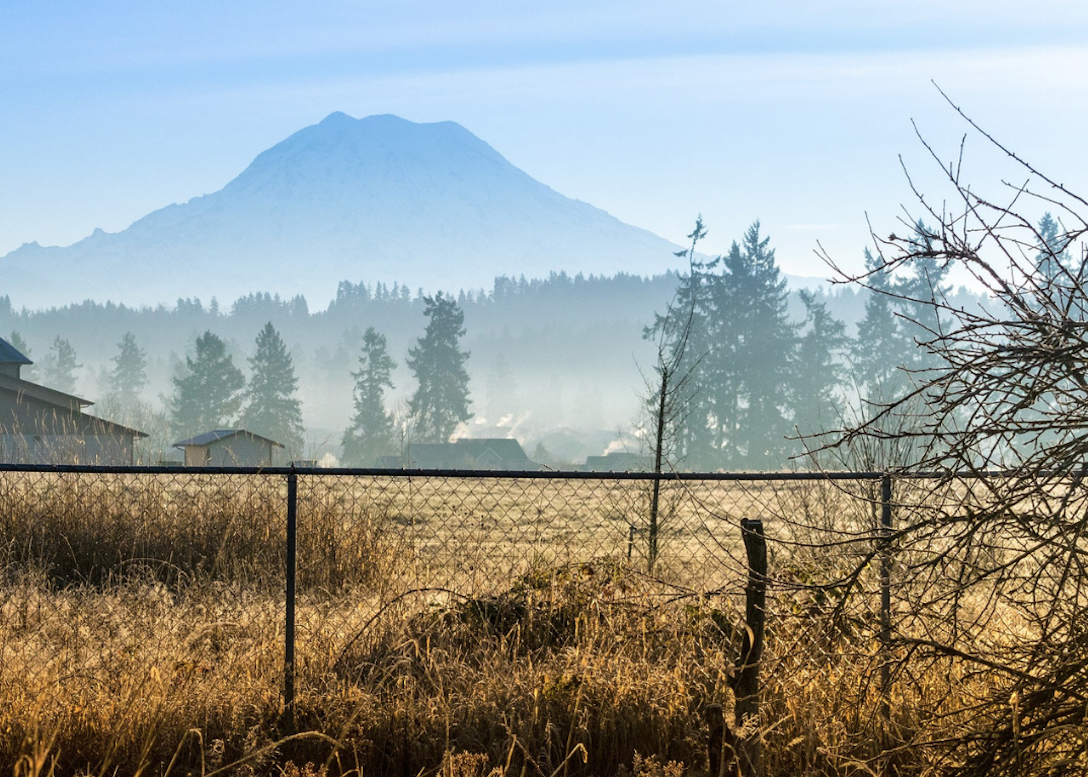
#17. Washington
– Drought conditions, March 2023: 55.0% of area, affecting 75.0% of population (5.0 million people)
— Abnormally dry: 53.9% of area, 74.8% of population (4,969,407 people)
— Moderate drought: 1.1% of area, 0.1% of population (9,623 people)
— Severe drought: 0.0% of area, 0.0% of population (0 people)
— Extreme drought: 0.0% of area, 0.0% of population (0 people)
— Exceptional drought: 0.0% of area, 0.0% of population (0 people)
– Drought conditions, decade average: 61.7% of area, affecting 51.1% of the population
Pixabay
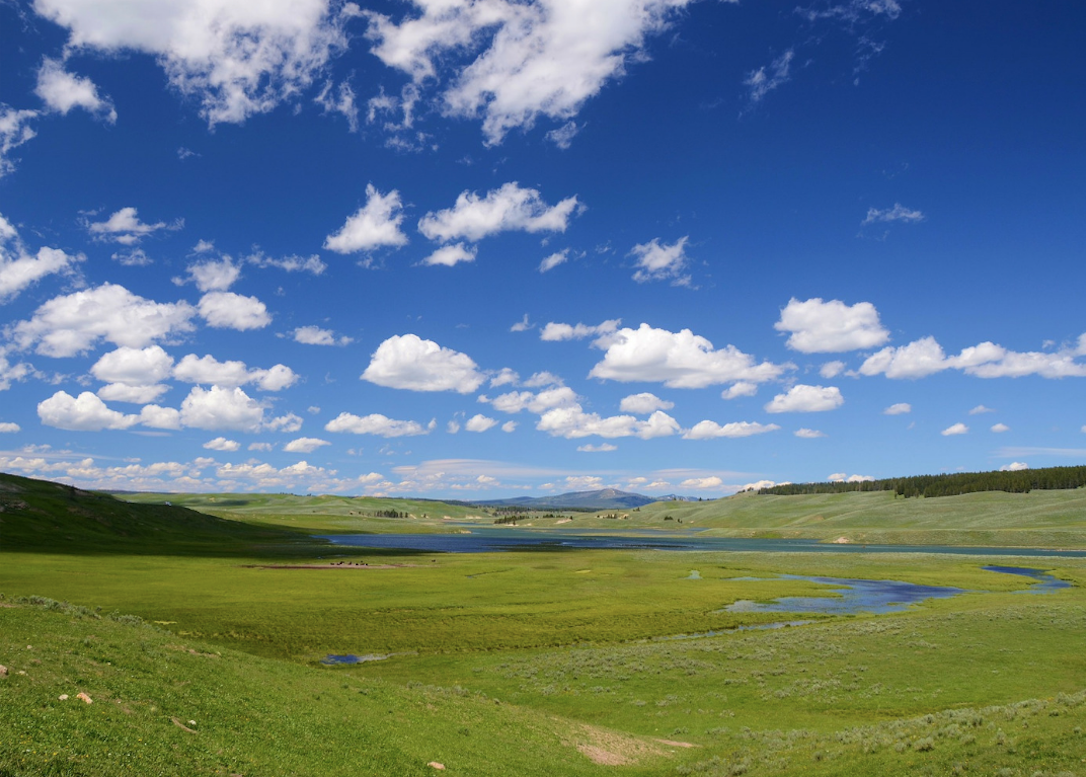
#16. Wyoming
– Drought conditions, March 2023: 56.5% of area, affecting 59.4% of population (334,951 people)
— Abnormally dry: 18.4% of area, 16.4% of population (92,118 people)
— Moderate drought: 29.2% of area, 34.7% of population (195,342 people)
— Severe drought: 7.6% of area, 5.8% of population (32,832 people)
— Extreme drought: 1.3% of area, 2.6% of population (14,660 people)
— Exceptional drought: 0.0% of area, 0.0% of population (0 people)
– Drought conditions, decade average: 45.8% of area, affecting 43.3% of the population
You may also like: How long it takes 50 common items to decompose
Pixabay
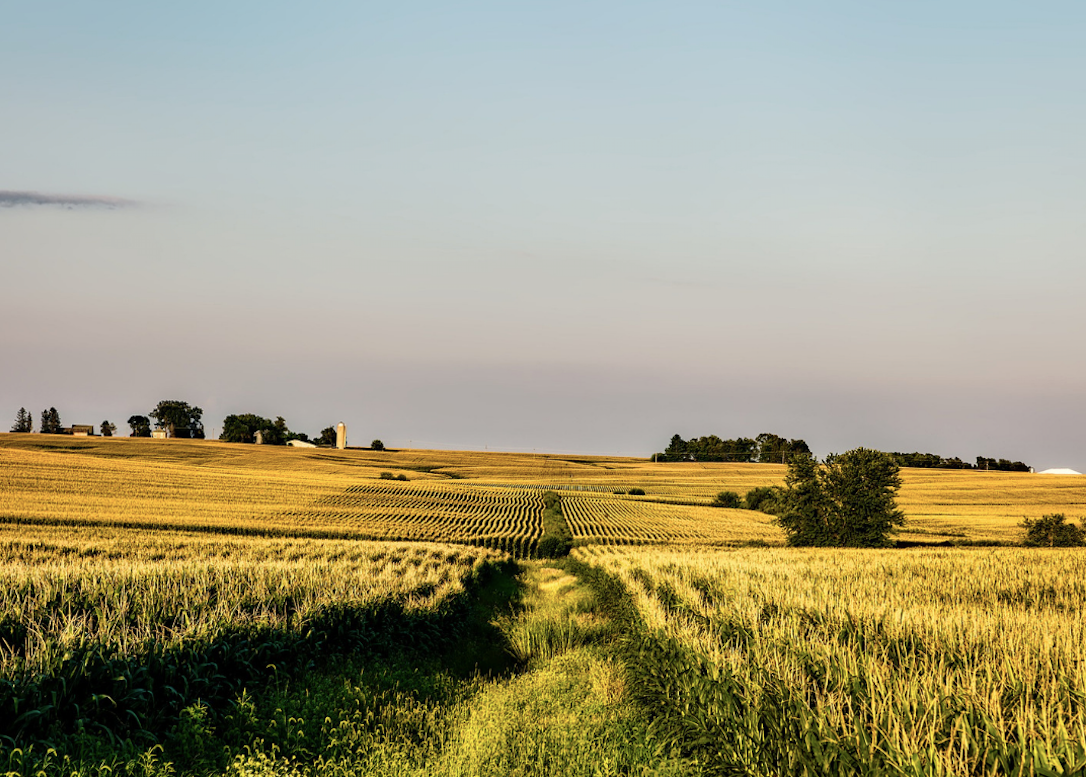
#15. Iowa
– Drought conditions, March 2023: 64.7% of area, affecting 57.6% of population (1.7 million people)
— Abnormally dry: 32.7% of area, 38.8% of population (1,169,145 people)
— Moderate drought: 16.4% of area, 9.3% of population (279,069 people)
— Severe drought: 14.0% of area, 7.6% of population (228,289 people)
— Extreme drought: 0.9% of area, 1.2% of population (36,941 people)
— Exceptional drought: 0.6% of area, 0.7% of population (20,903 people)
– Drought conditions, decade average: 40.9% of area, affecting 40.2% of the population

Pixabay
#14. New Mexico
– Drought conditions, March 2023: 65.3% of area, affecting 79.6% of population (1.6 million people)
— Abnormally dry: 32.4% of area, 62.7% of population (1,290,426 people)
— Moderate drought: 17.4% of area, 8.3% of population (171,553 people)
— Severe drought: 11.7% of area, 6.6% of population (136,685 people)
— Extreme drought: 3.6% of area, 1.9% of population (39,853 people)
— Exceptional drought: 0.2% of area, 0.0% of population (269 people)
– Drought conditions, decade average: 73.7% of area, affecting 78.0% of the population
Pixabay
#13. Oklahoma
– Drought conditions, March 2023: 65.6% of area, affecting 68.0% of population (2.6 million people)
— Abnormally dry: 6.5% of area, 13.1% of population (490,561 people)
— Moderate drought: 9.0% of area, 20.1% of population (754,692 people)
— Severe drought: 13.5% of area, 15.9% of population (597,707 people)
— Extreme drought: 25.4% of area, 16.7% of population (624,689 people)
— Exceptional drought: 11.2% of area, 2.2% of population (82,384 people)
– Drought conditions, decade average: 54.3% of area, affecting 50.9% of the population
Pixabay
#12. Texas
– Drought conditions, March 2023: 78.4% of area, affecting 49.1% of population (12.3 million people)
— Abnormally dry: 14.2% of area, 13.6% of population (3,430,183 people)
— Moderate drought: 20.7% of area, 8.0% of population (2,011,462 people)
— Severe drought: 29.3% of area, 17.0% of population (4,263,025 people)
— Extreme drought: 11.1% of area, 6.0% of population (1,496,091 people)
— Exceptional drought: 3.2% of area, 4.5% of population (1,135,767 people)
– Drought conditions, decade average: 50.1% of area, affecting 44.2% of the population
Pixabay
#11. Kansas
– Drought conditions, March 2023: 84.3% of area, affecting 50.9% of population (1.5 million people)
— Abnormally dry: 9.4% of area, 5.5% of population (156,844 people)
— Moderate drought: 9.4% of area, 4.7% of population (132,831 people)
— Severe drought: 13.2% of area, 10.2% of population (292,358 people)
— Extreme drought: 16.1% of area, 19.8% of population (564,038 people)
— Exceptional drought: 36.3% of area, 10.8% of population (306,655 people)
– Drought conditions, decade average: 55.3% of area, affecting 45.4% of the population
You may also like: Climate change’s impact on the coffee industry
Pixabay
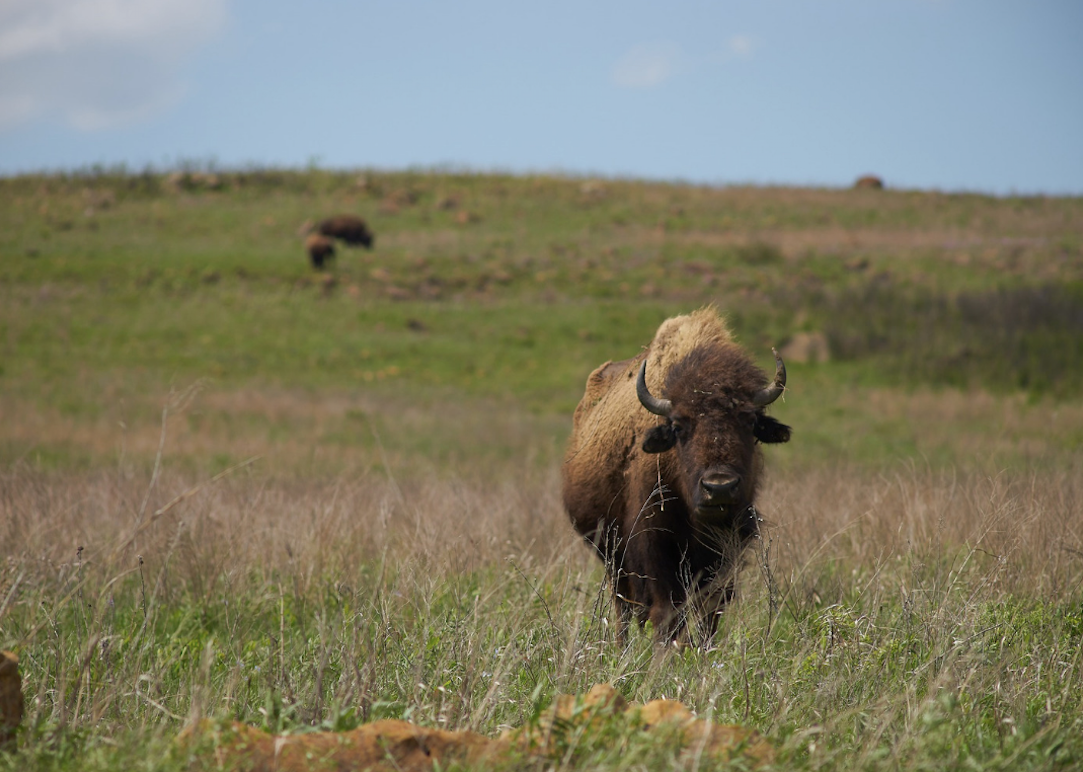
#10. Montana
– Drought conditions, March 2023: 84.4% of area, affecting 76.2% of population (754,192 people)
— Abnormally dry: 36.1% of area, 36.7% of population (362,717 people)
— Moderate drought: 36.4% of area, 32.5% of population (321,877 people)
— Severe drought: 12.0% of area, 7.0% of population (69,598 people)
— Extreme drought: 0.0% of area, 0.0% of population (0 people)
— Exceptional drought: 0.0% of area, 0.0% of population (0 people)
– Drought conditions, decade average: 45.4% of area, affecting 44.9% of the population

Pixabay
#9. Florida
– Drought conditions, March 2023: 88.5% of area, affecting 90.6% of population (16.8 million people)
— Abnormally dry: 19.7% of area, 17.2% of population (3,184,983 people)
— Moderate drought: 50.5% of area, 58.6% of population (10,887,699 people)
— Severe drought: 18.2% of area, 14.8% of population (2,753,767 people)
— Extreme drought: 0.0% of area, 0.0% of population (0 people)
— Exceptional drought: 0.0% of area, 0.0% of population (0 people)
– Drought conditions, decade average: 29.5% of area, affecting 27.9% of the population

Pixabay
#8. Hawaii
– Drought conditions, March 2023: 90.5% of area, affecting 95.1% of population (1.3 million people)
— Abnormally dry: 90.5% of area, 95.1% of population (1,293,210 people)
— Moderate drought: 0.0% of area, 0.0% of population (0 people)
— Severe drought: 0.0% of area, 0.0% of population (0 people)
— Extreme drought: 0.0% of area, 0.0% of population (0 people)
— Exceptional drought: 0.0% of area, 0.0% of population (0 people)
– Drought conditions, decade average: 55.6% of area, affecting 52.2% of the population
Pixabay
#7. Oregon
– Drought conditions, March 2023: 91.5% of area, affecting 62.4% of population (2.4 million people)
— Abnormally dry: 18.2% of area, 24.1% of population (923,676 people)
— Moderate drought: 39.8% of area, 32.9% of population (1,260,008 people)
— Severe drought: 26.3% of area, 3.8% of population (144,680 people)
— Extreme drought: 5.8% of area, 1.4% of population (52,374 people)
— Exceptional drought: 1.4% of area, 0.3% of population (10,067 people)
– Drought conditions, decade average: 82.5% of area, affecting 70.8% of the population
Pixabay
#6. Utah
– Drought conditions, March 2023: 93.0% of area, affecting 99.3% of population (2.7 million people)
— Abnormally dry: 11.0% of area, 4.6% of population (127,911 people)
— Moderate drought: 49.1% of area, 60.0% of population (1,658,885 people)
— Severe drought: 32.0% of area, 34.5% of population (953,441 people)
— Extreme drought: 1.0% of area, 0.2% of population (4,352 people)
— Exceptional drought: 0.0% of area, 0.0% of population (0 people)
– Drought conditions, decade average: 81.8% of area, affecting 82.5% of the population
You may also like: U.S. cities with the cleanest air
Pixabay
#5. Nevada
– Drought conditions, March 2023: 95.5% of area, affecting 96.3% of population (2.6 million people)
— Abnormally dry: 16.0% of area, 6.1% of population (164,570 people)
— Moderate drought: 59.8% of area, 37.1% of population (1,001,265 people)
— Severe drought: 19.7% of area, 53.1% of population (1,434,910 people)
— Extreme drought: 0.0% of area, 0.0% of population (0 people)
— Exceptional drought: 0.0% of area, 0.0% of population (0 people)
– Drought conditions, decade average: 79.5% of area, affecting 80.3% of the population
Pixabay
#4. Idaho
– Drought conditions, March 2023: 97.7% of area, affecting 93.7% of population (1.5 million people)
— Abnormally dry: 24.4% of area, 49.5% of population (775,419 people)
— Moderate drought: 70.2% of area, 44.0% of population (689,128 people)
— Severe drought: 3.1% of area, 0.3% of population (4,463 people)
— Extreme drought: 0.0% of area, 0.0% of population (0 people)
— Exceptional drought: 0.0% of area, 0.0% of population (0 people)
– Drought conditions, decade average: 62.4% of area, affecting 64.9% of the population
Pixabay
#3. Nebraska
– Drought conditions, March 2023: 99.6% of area, affecting 99.8% of population (1.8 million people)
— Abnormally dry: 1.0% of area, 0.4% of population (7,934 people)
— Moderate drought: 20.0% of area, 18.7% of population (340,586 people)
— Severe drought: 44.6% of area, 59.9% of population (1,093,989 people)
— Extreme drought: 28.9% of area, 14.0% of population (255,147 people)
— Exceptional drought: 5.1% of area, 6.8% of population (124,322 people)
– Drought conditions, decade average: 47.9% of area, affecting 39.2% of the population
Pixabay
#2. North Dakota
– Drought conditions, March 2023: 100.0% of area, affecting 100.0% of population (672,591 people)
— Abnormally dry: 56.9% of area, 71.7% of population (481,912 people)
— Moderate drought: 43.1% of area, 28.3% of population (190,514 people)
— Severe drought: 0.1% of area, 0.0% of population (165 people)
— Extreme drought: 0.0% of area, 0.0% of population (0 people)
— Exceptional drought: 0.0% of area, 0.0% of population (0 people)
– Drought conditions, decade average: 57.3% of area, affecting 53.3% of the population
Pixabay
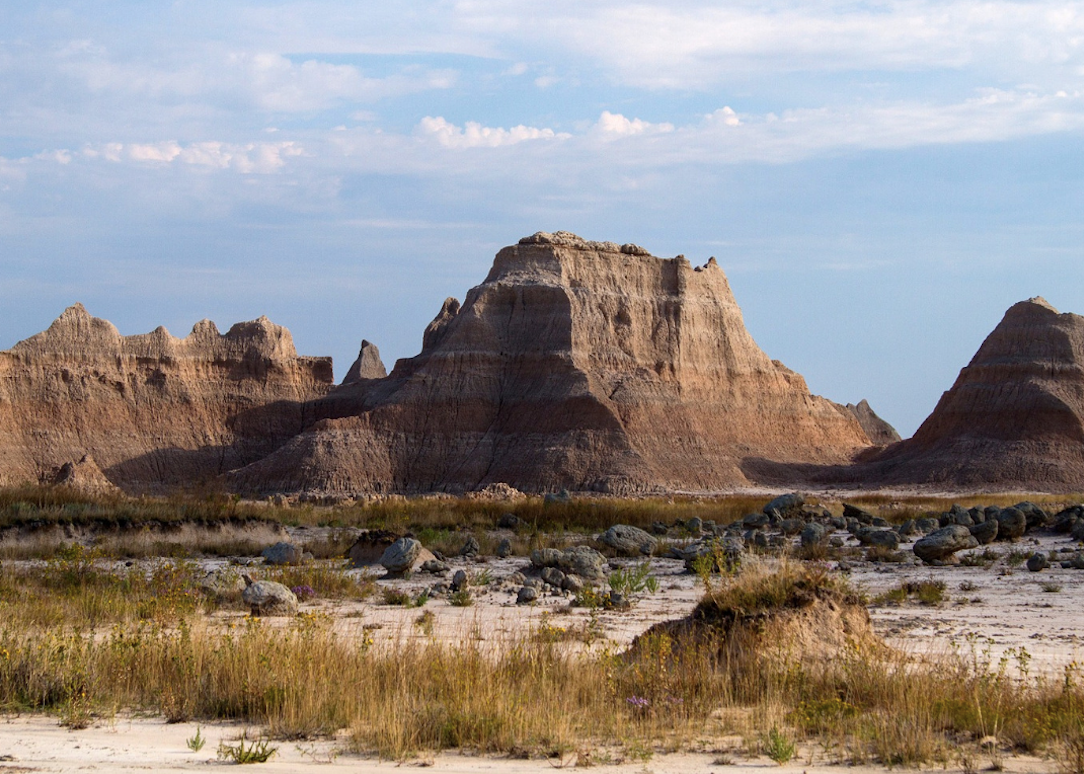
#1. South Dakota
– Drought conditions, March 2023: 100.0% of area, affecting 100.0% of population (814,180 people)
— Abnormally dry: 56.6% of area, 64.9% of population (533,700 people)
— Moderate drought: 38.0% of area, 30.6% of population (244,843 people)
— Severe drought: 5.4% of area, 4.4% of population (34,931 people)
— Extreme drought: 0.0% of area, 0.1% of population (706 people)
— Exceptional drought: 0.0% of area, 0.0% of population (0 people)
– Drought conditions, decade average: 57.8% of area, affecting 53.5% of the population
You may also like: 25 endangered animals that only live in America