The counties where American children have the best and worst shot at upward economic mobility

Canva
The counties where American children have the best and worst shot at upward economic mobility
A Black mother teaching her daughter financial literacy.
Americans have long understood that their birthplace can significantly affect their futures, and academics have increasingly been able to connect tangible early life factors like where they live and the friendships they’ve cultivated with potential future income.
Among the most recent studies shedding light on what’s known as economic mobility—a person’s ability to move themselves and their families up the socioeconomic ladder over their lifetime—are a series of papers authored by Harvard University researchers leveraging vast troves of social networking data.
Wealth Enhancement Group used data from Harvard University‘s Social Capital Atlas project to identify where in the U.S. children have the best (and worst) chances at upward economic mobility.
The research draws on a privacy-protected dataset representing 21 billion friendships from Facebook made public through its parent company Meta’s Data for Good project. It also uses anonymous tax records, according to the authors. The scholars assigned a score to locales according to how economically connected low- and high-income people living in the area have historically been over at least a decade, per that data. The dataset does not include scores for about 180 of the 3,000 or so counties in the U.S.
The research attempts to fill in the gaps of previous efforts to study American economic mobility that did not consider a person’s vast social networks nor their importance in creating better lives for themselves and their children.
It turns out the ability to cultivate friendships linking people of different socioeconomic backgrounds with one another is the strongest factor in determining whether a child can surpass the earning potential of their parents, Harvard researchers found. They call this economic connectedness. Economic connectedness is a form of social capital, which is the relationships that allow us to obtain resources and opportunities to gain advantages in life. It’s a measure that refers to the degree to which low-income people have connections with people across class lines and are friends with high-income people
![]()

Canva
Where climbing the ladder is most daunting
An Asian father teaching his son about investing.
The authors specifically define economic connectedness as the share of above-median income friends a person earning below median income has on the social media platform.
Many of the counties that score the lowest for economic connectedness are located in places where the typical household income and the size of the overall population are low relative to the rest of the U.S. The lowest-scoring counties for economic connectedness are located in Southern region states—including Georgia, Alabama, the Carolinas, Mississippi, and Florida—and the Texas border, with Mexico.
The study has also shone a light on the racial and ethnic differences in economic mobility. Black and Native American children born into poverty are more likely than white and Latino children to stay there. The counties that rank low in economic connectedness and, therefore, opportunities for upward mobility provide an outline for future work that can improve the lives of people where they currently live through investment and reform.
Read on to see the five counties where children have the least opportunity for upward economic mobility.

Canva
#3,014. Allendale County, South Carolina
Aerial city view of South Carolina.
Economic connectedness: 0.36 (ranked #3,014 among counties)
Median household income: $31,800
Population: 8,304
— 22.9% white
— 73.2% Black
— 0.2% American Indian and Alaska Native
— 0.8% Asian
Canva
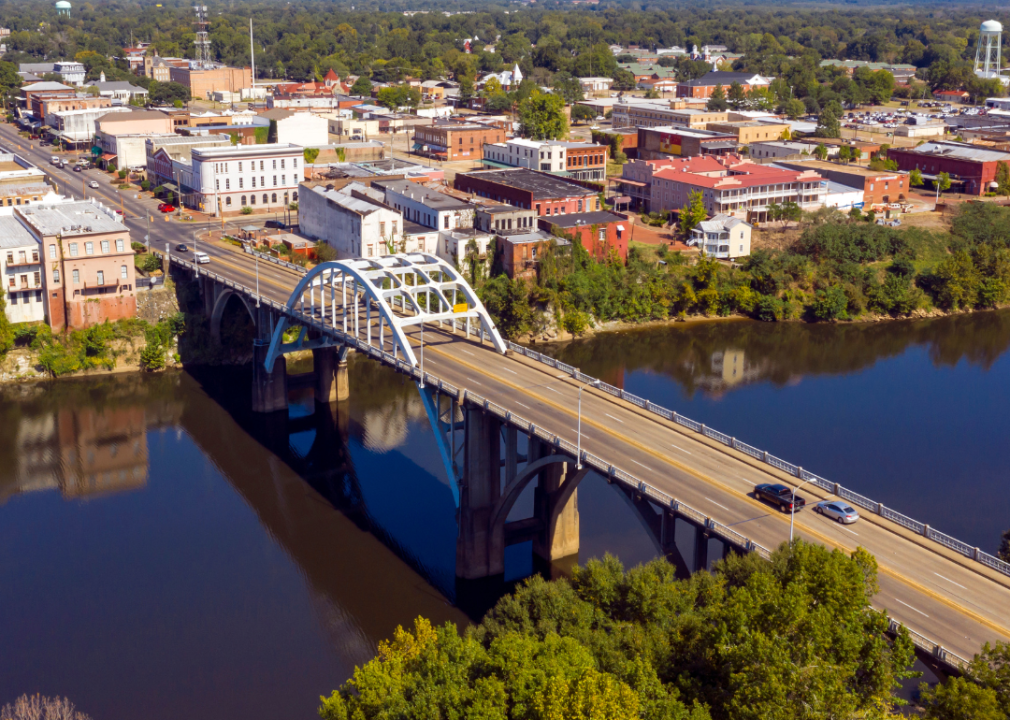
#3,015. Bullock County, Alabama
Aerial view of a bridge in Alabama.
Economic connectedness: 0.35
Median income: $29,063
Population: 10,386
— 24.8% white
— 69% Black
— 0% American Indian and Alaska Native
— 0.4% Asian

Canva
#3,016. Terrell County, Georgia
A cathedral in rural Georgia.
Economic connectedness: 0.34
Median income: $38,879
Population: 9,102
— 36.1% white
— 57% Black
— 0.1% American Indian and Alaska Native
— 4.1% Asian
Canva
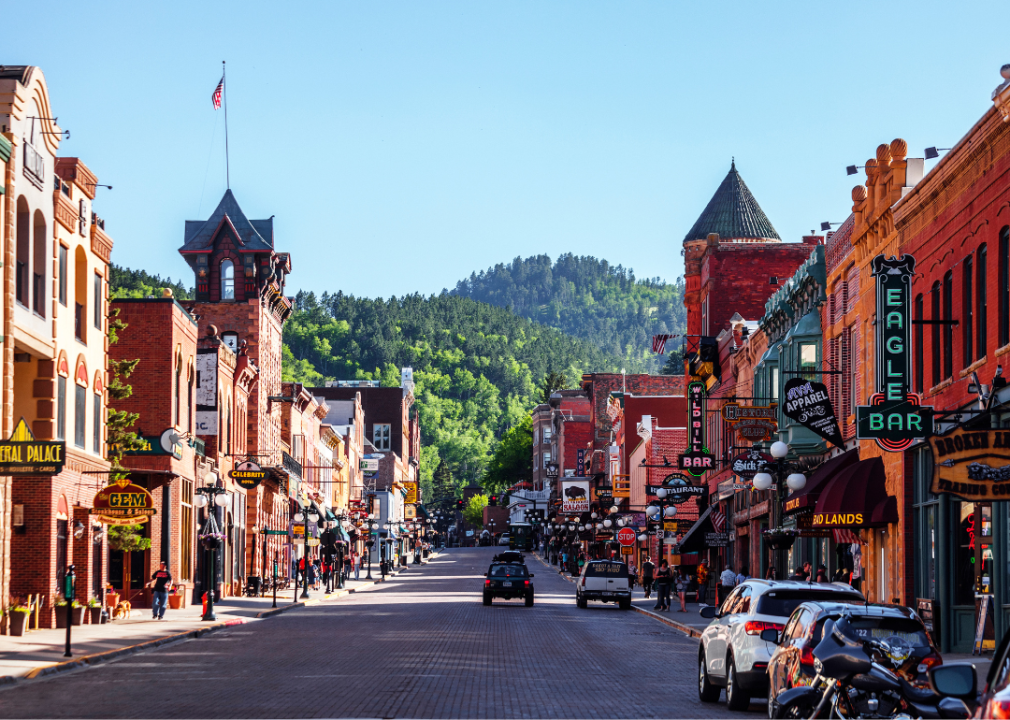
#3,017. Shannon County, South Dakota
Close-up view of a small shopping district in South Dakota.
Economic connectedness: 0.33
Median income: $33,192
Population: 13,835
— 4.3% white
— 0% Black
— 94.8% American Indian and Alaska Native
— 0% Asian

Canva
#3,018. Todd County, South Dakota
Yellow flowers sprouting from grass against a vast mountain view in South Dakota.
Economic connectedness: 0.29
Median income: $26,250
Population: 9,434
— 8.3% white
— 0% Black
— 87.4% American Indian and Alaska Native
— 2.9% Asian

Canva
‘Connections across class lines’
A Black father reading to his son on a couch.
The link between fewer individuals of higher income in an area and the lower economic connectedness score may suggest it’s difficult to be upwardly mobile when there are simply fewer people of greater means for individuals of lower socioeconomic status to befriend.
“Connections across class lines are what appear to matter,” Harvard researchers found.
Conversely, counties with higher median incomes tended to also have higher economic connectedness scores—with some caveats. Those connections may provide people with the motivation, opportunities, and access to information that can help them improve their circumstances.
Read on to see the five counties where children have the most opportunity for upward economic mobility.
Bryson DeMille // Shutterstock
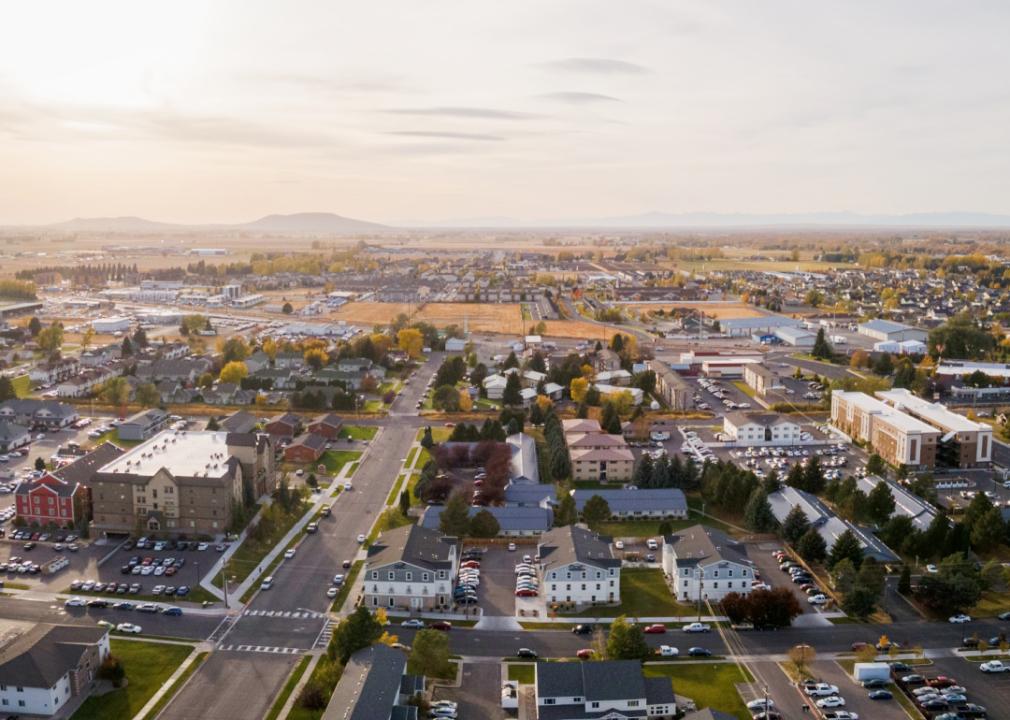
5. Madison County, Idaho
Aerial view of Rexburg, Idaho.
Economic connectedness: 1.28
Median income: $53,498
Population: 50,979
— 91.5% white
— 0.5% Black
— 0.2% American Indian and Alaska Native
— 1.5% Asian

Canva
4. Morgan County, Utah
Aerial view overlooking a valley in Utah.
Economic connectedness: 1.29
Median income: $112,721
Population: 12,162
— 94.9% white
— 0.7% Black
— 0.2% American Indian and Alaska Native
— 0.2% Asian

Canva
3. San Francisco County, California
Aerial view of a town in San Francisco.
Economic connectedness: 1.31
Median income: $126,187
Population: 865,933
— 43.4% white
— 5.2% Black
— 0.5% American Indian and Alaska Native
— 34.4% Asian
Canva
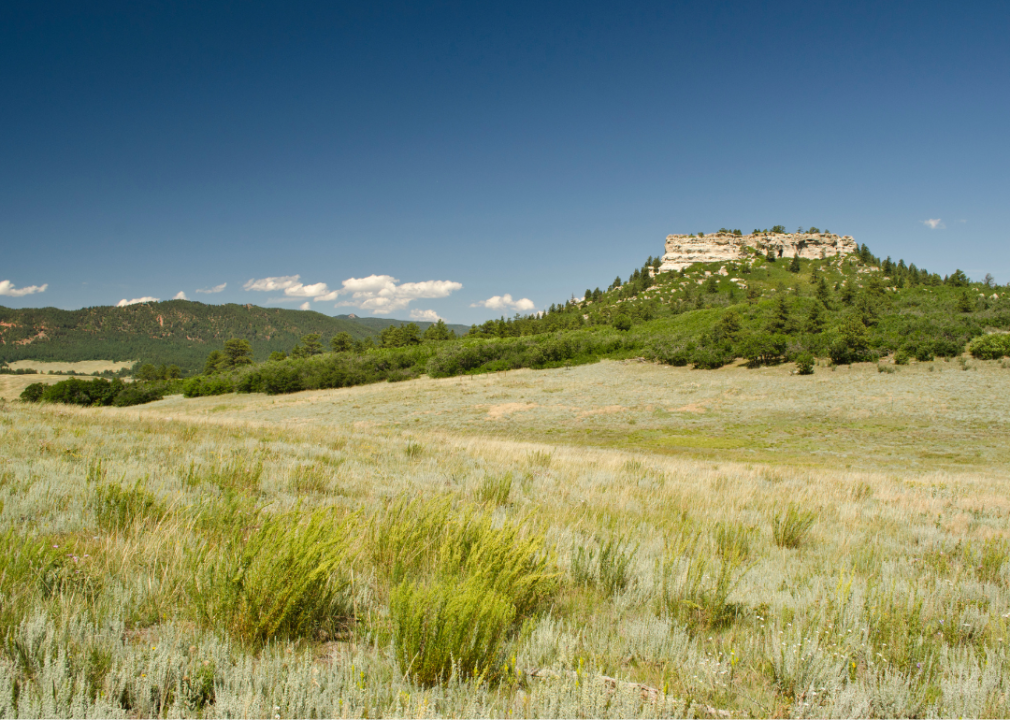
2. Douglas County, Colorado
A view of a prairie in Douglas County, Colorado.
Economic connectedness: 1.35
Median income: $127,443
Population: 351,929
— 85.7% white
— 1.5% Black
— 0.4% American Indian and Alaska Native
— 5.2% Asian

Canva
1. Rockingham County, New Hampshire
A New Hampshire townscape with a lakeside view.
Economic connectedness: 1.35
Median income: $101,683
Population: 312,771
— 93% white
— 0.9% Black
— 0.1% American Indian and Alaska Native
— 2.1% Asian
Story editing by Jeff Inglis. Copy editing by Paris Close.
This story originally appeared on Wealth Enhancement Group and was produced and
distributed in partnership with Stacker Studio.