Counties with the highest rates of strokes in Idaho

Canva
Counties with the highest rates of strokes in Idaho
For more than a century, strokes have been a leading cause of death among U.S. adults, according to the Centers for Disease Control and Prevention. The sudden cerebrovascular event affects nearly 800,000 Americans annually and is also a leading cause of disability.
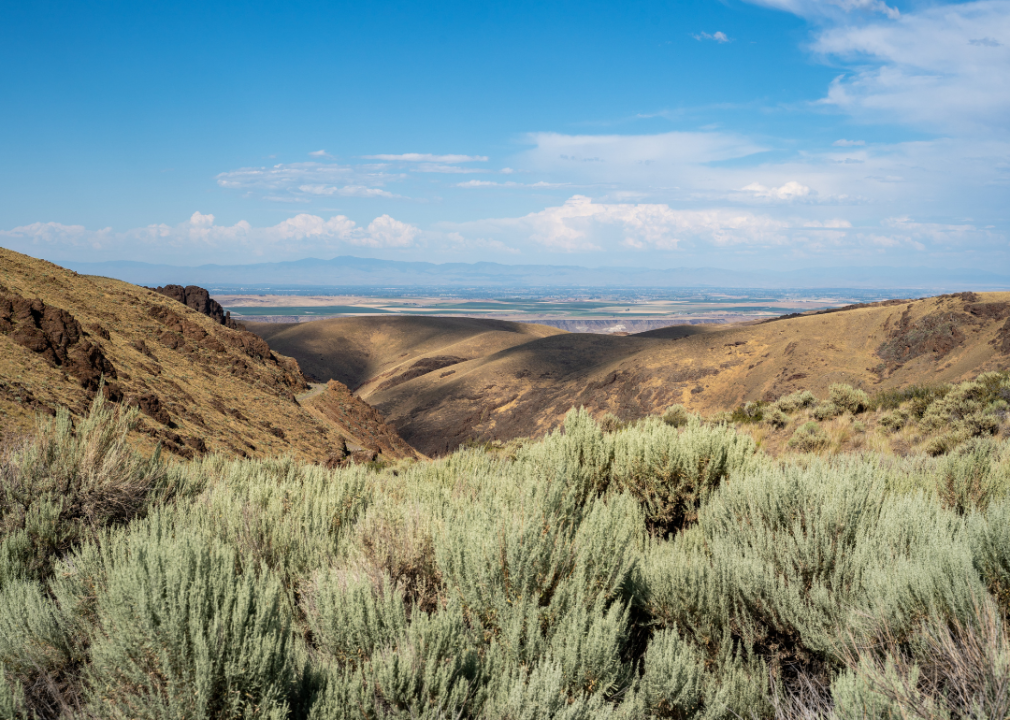
The tragedy of the nation’s stroke rate is amplified by its preventability. Four out of five strokes are preventable, according to the CDC.
Stacker used CDC data to list the counties in Idaho with the highest prevalence of stroke. Data is based on estimates compiled by the CDC, with the confidence range included for each county. Additional data on death rates between 2018 and 2020 for the two most common types of strokes, ischemic and hemorrhagic, are also included for each county. In cases of a tie, the ischemic and hemorrhagic stroke death rates are used as tiebreakers.
An ischemic stroke occurs when a blood clot blocks an artery leading to the brain. These account for 87% of strokes in the U.S. In hemorrhagic strokes, a ruptured blood vessel causes active bleeding in the brain. These kinds of strokes are often more serious.
When someone suffers a stroke, a swift medical response can have a major impact on their recovery. Early treatment by doctors can help dissolve the clot in ischemic strokes and limit the expansion of the brain bleed in hemorrhagic strokes. Knowing the signs—including drooping on one side of the face, inability to lift one arm or leg, and slurred speech—and calling 911 immediately can help save lives.
Research shows that the first one to three months after a stroke are the most crucial for retraining the brain to complete tasks that once felt second nature, with emerging research suggesting progress does not halt after six months. Ongoing therapy has an impact on stroke victims throughout their recovery journey, even if progress slows. Despite these promising findings, many health insurance plans limit how much therapy is covered and make regular, long-term treatment more challenging for survivors of strokes and their families.
The rate of strokes is most prominent throughout the Southeast; public health experts have termed the region the “stroke belt” for its higher death rates than the national average. Racial disparities are also prominent, with Black people experiencing and dying from strokes at higher rates, according to the Office of Minority Health.
Preventative care is critical for lowering stroke risk, even for people who otherwise feel healthy.
Annual check-ins with a physician can help track risk factors including high cholesterol, diabetes, and obesity. Hypertension, or high blood pressure, is the leading cause of stroke, and it can be caused by overconsumption of salty foods, drinking alcohol, smoking, stress, and genetics. High blood pressure has less obvious symptoms, but people can regularly track their metrics using at-home blood pressure cuffs to know if they need to talk to their doctor sooner than scheduled. The American Heart Association has recommendations for which readings require medical intervention.
Read on to see which counties had the highest rates of strokes in Idaho.
![]()
Charles Knowles // Shutterstock
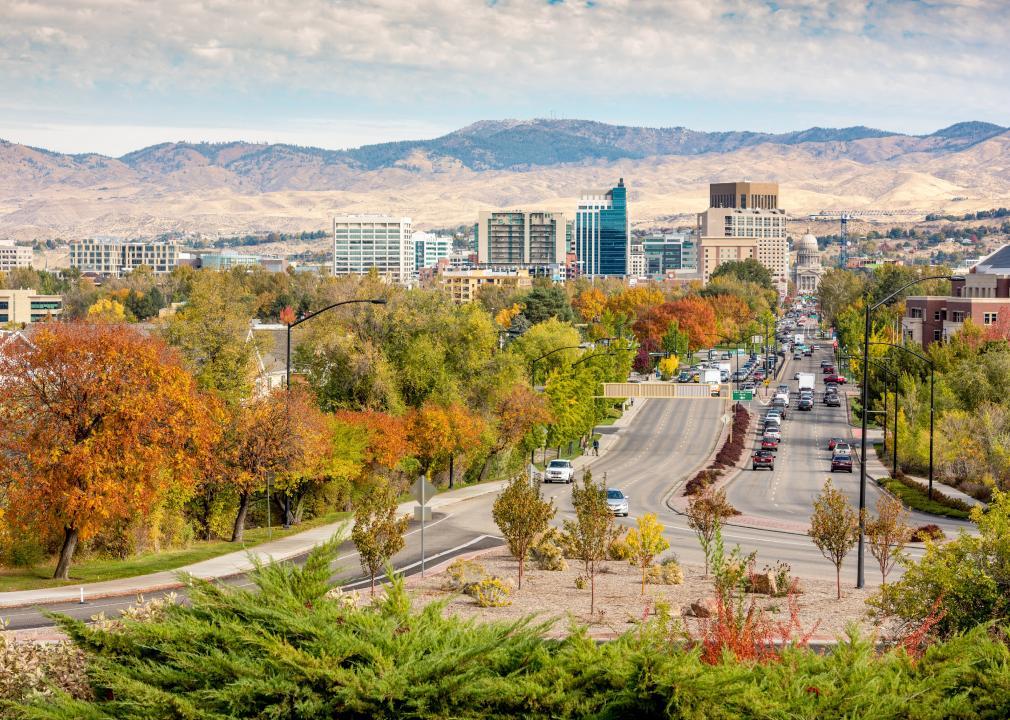
#44. Ada County
– Age-adjusted rate of all strokes among adults, estimates for 2021: 2.4% (range between 2.1% and 2.7%)
– Death rate for ischemic strokes, 2018-20: 14.2 per 100K people
– Death rate for hemorrhagic strokes, 2018-20: 6.7 per 100K people

Canva
#43. Blaine County
– Age-adjusted rate of all strokes among adults, estimates for 2021: 2.5% (range between 2.1% and 2.8%)
– Death rate for ischemic strokes, 2018-20: 15.8 per 100K people
– Death rate for hemorrhagic strokes, 2018-20: 8.7 per 100K people
Canva
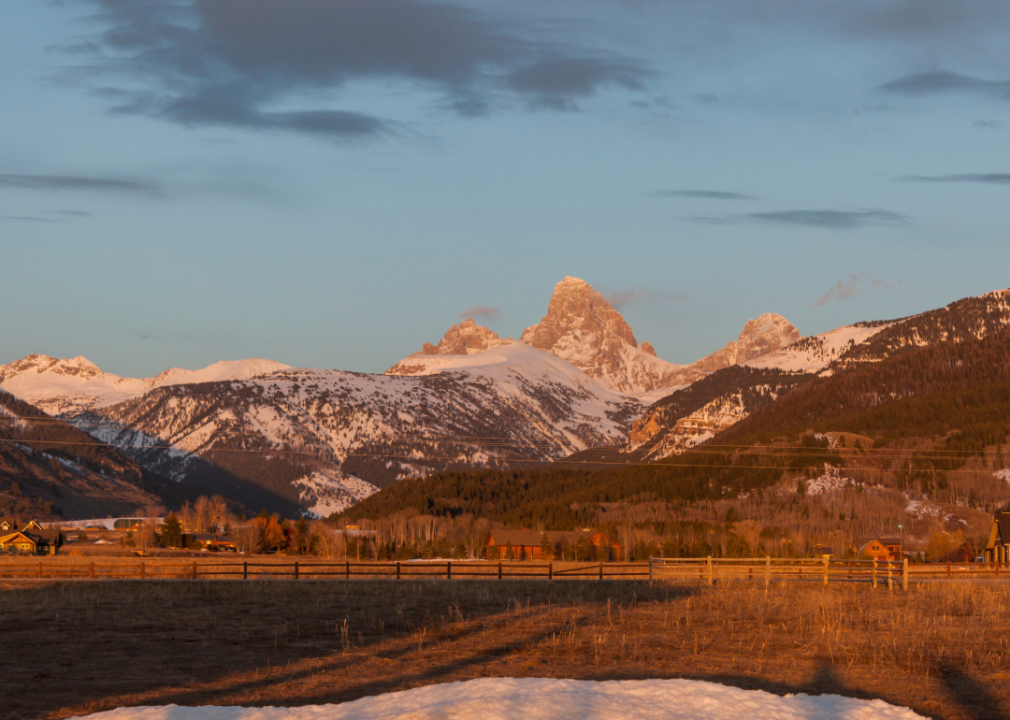
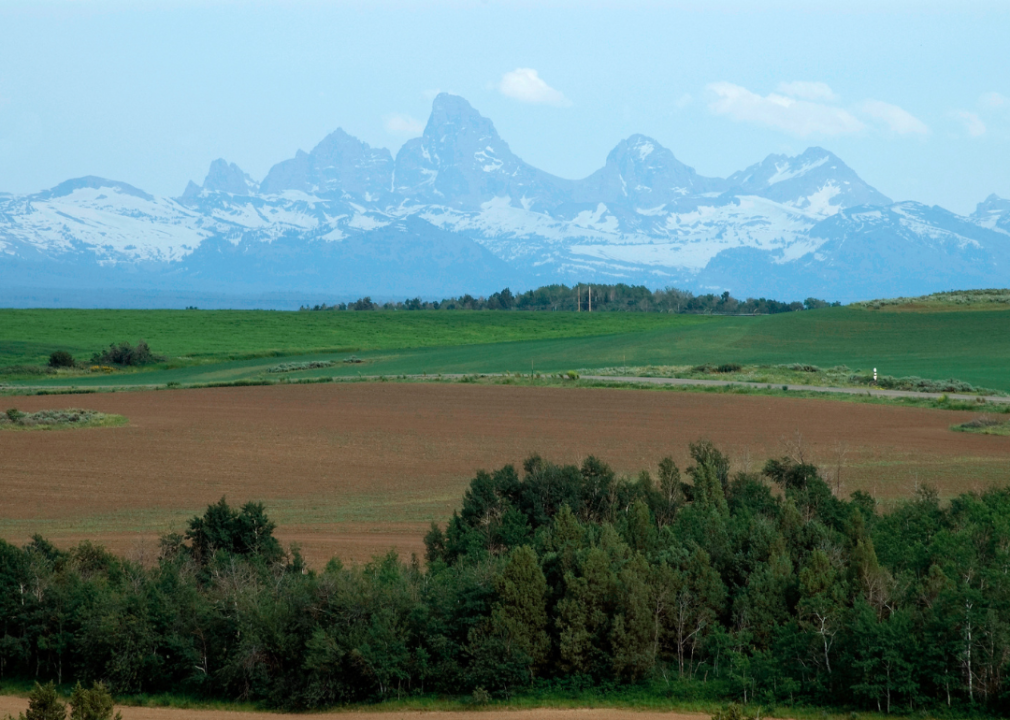
#42. Teton County
– Age-adjusted rate of all strokes among adults, estimates for 2021: 2.5% (range between 2.1% and 2.8%)
– Death rate for ischemic strokes, 2018-20: 21.7 per 100K people
– Death rate for hemorrhagic strokes, 2018-20: 6.5 per 100K people

Canva
#41. Boise County
– Age-adjusted rate of all strokes among adults, estimates for 2021: 2.6% (range between 2.3% and 3.0%)
– Death rate for ischemic strokes, 2018-20: 13.4 per 100K people
– Death rate for hemorrhagic strokes, 2018-20: 6.6 per 100K people
Danita Delimont // Shutterstock
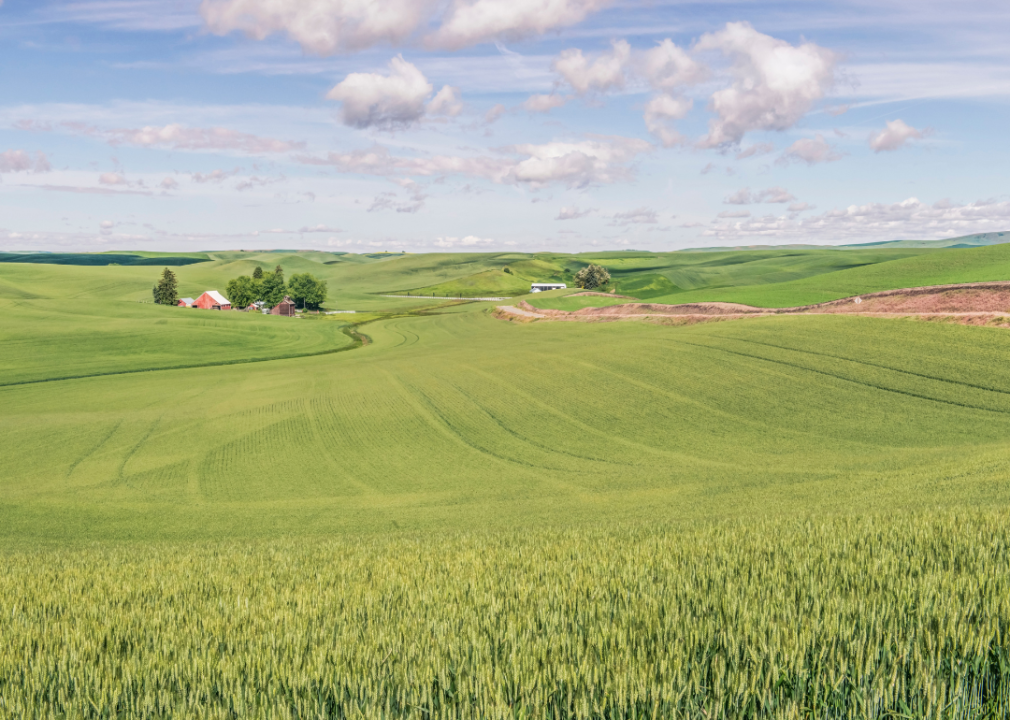
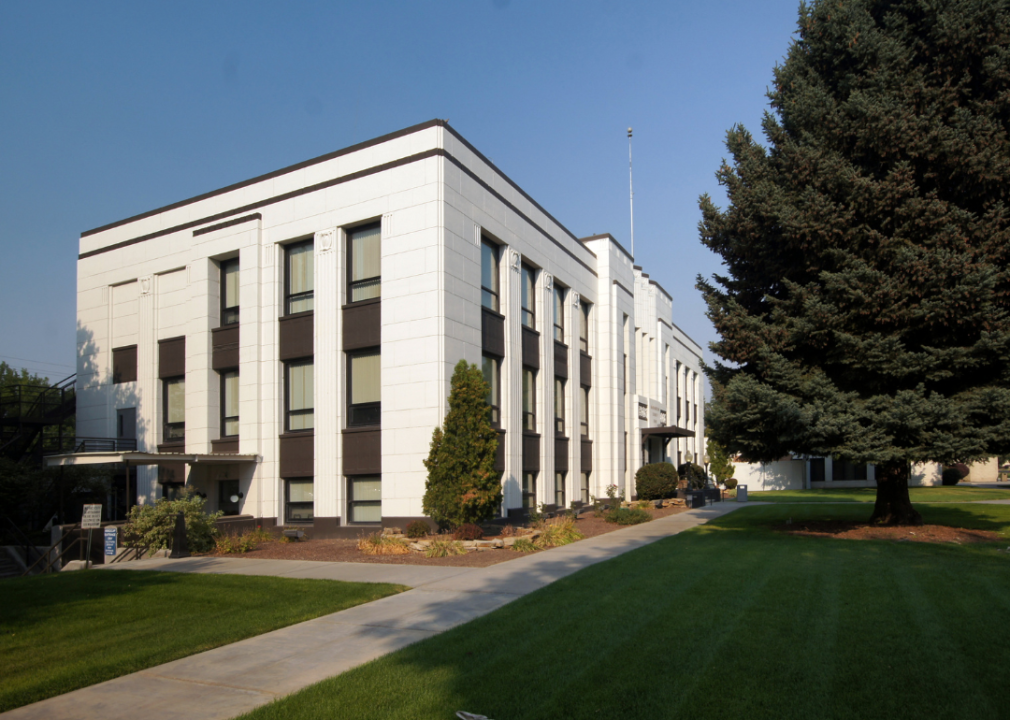
#40. Latah County
– Age-adjusted rate of all strokes among adults, estimates for 2021: 2.6% (range between 2.3% and 3.0%)
– Death rate for ischemic strokes, 2018-20: 20.6 per 100K people
– Death rate for hemorrhagic strokes, 2018-20: 7.6 per 100K people
You may also like: Least educated counties in Idaho
Canva
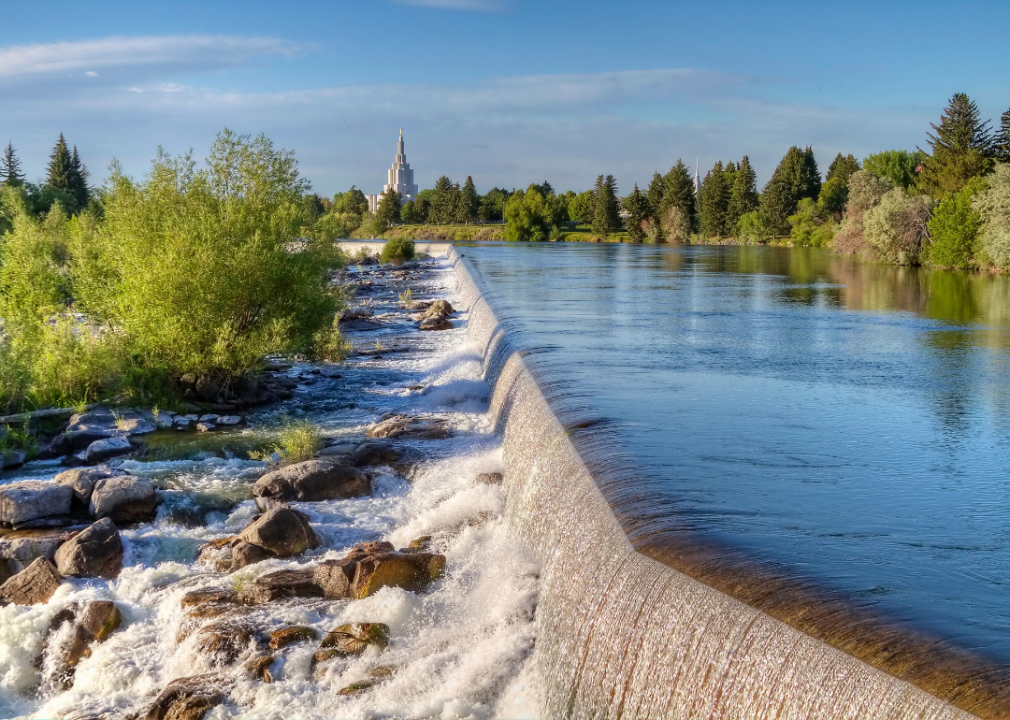
#39. Bonneville County
– Age-adjusted rate of all strokes among adults, estimates for 2021: 2.6% (range between 2.3% and 3.0%)
– Death rate for ischemic strokes, 2018-20: 21.5 per 100K people
– Death rate for hemorrhagic strokes, 2018-20: 8.9 per 100K people
Canva
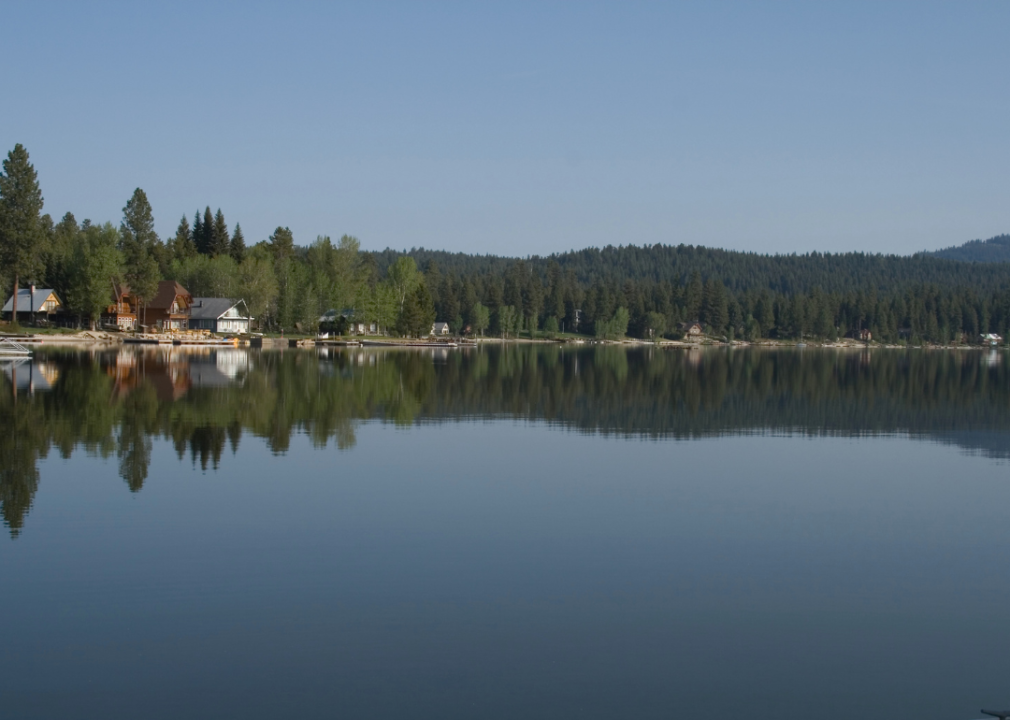
#38. Valley County
– Age-adjusted rate of all strokes among adults, estimates for 2021: 2.7% (range between 2.4% and 3.1%)
– Death rate for ischemic strokes, 2018-20: 12.4 per 100K people
– Death rate for hemorrhagic strokes, 2018-20: 4.0 per 100K people
MKStyle // Shutterstock
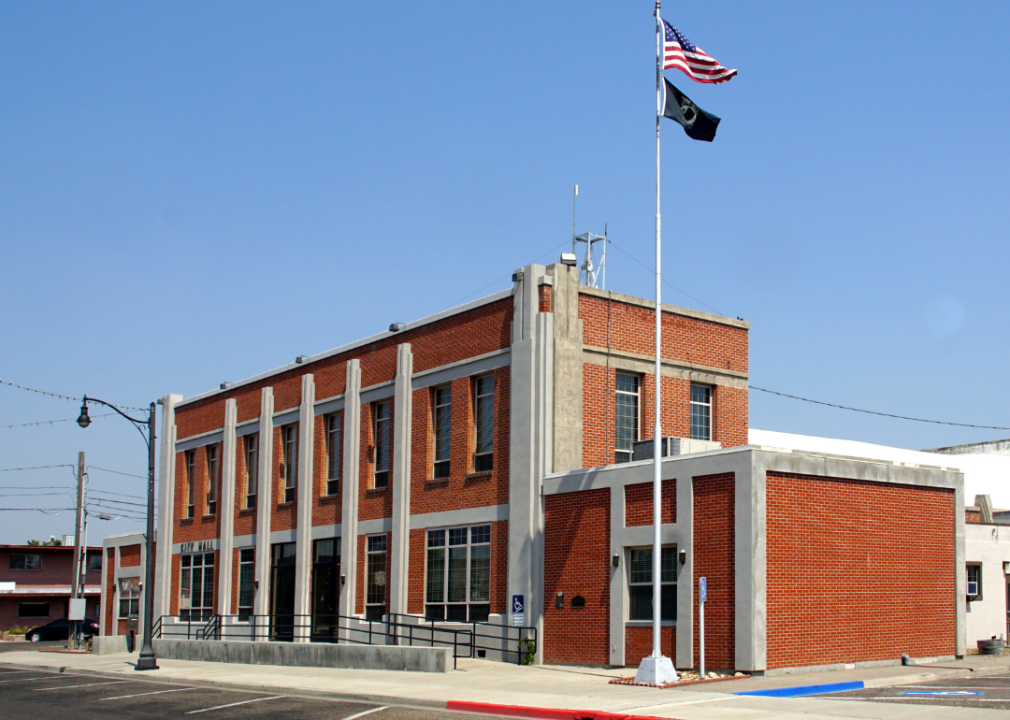
#37. Gem County
– Age-adjusted rate of all strokes among adults, estimates for 2021: 2.7% (range between 2.4% and 3.1%)
– Death rate for ischemic strokes, 2018-20: 15.4 per 100K people
– Death rate for hemorrhagic strokes, 2018-20: 6.6 per 100K people
Canva
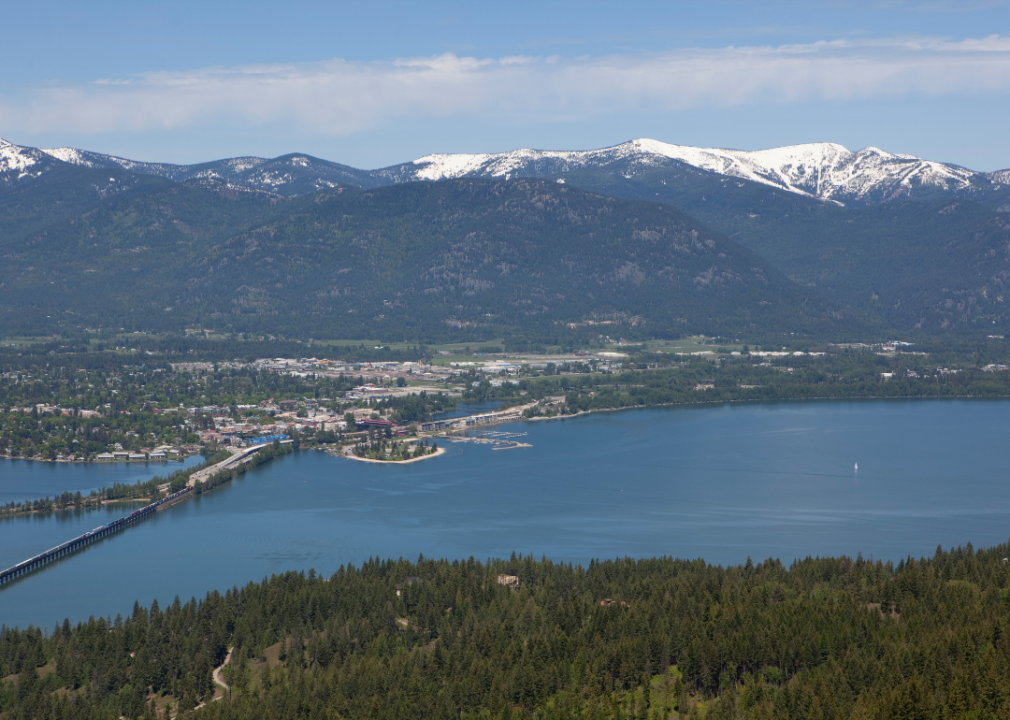
#36. Bonner County
– Age-adjusted rate of all strokes among adults, estimates for 2021: 2.7% (range between 2.4% and 3.1%)
– Death rate for ischemic strokes, 2018-20: 19.9 per 100K people
– Death rate for hemorrhagic strokes, 2018-20: 6.5 per 100K people
Canva
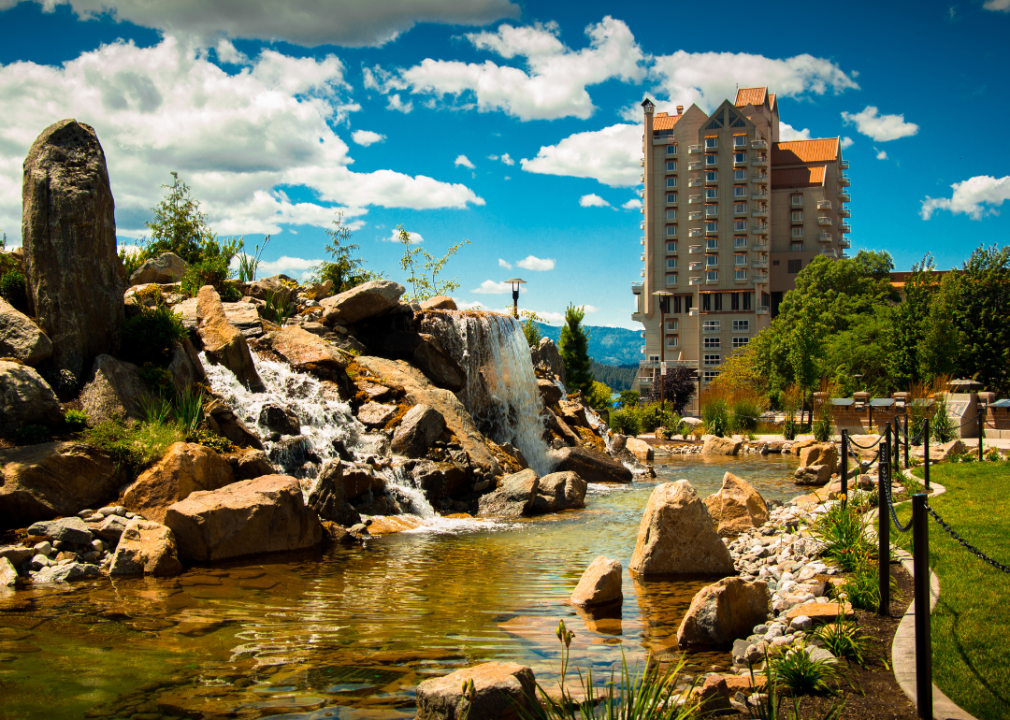
#35. Kootenai County
– Age-adjusted rate of all strokes among adults, estimates for 2021: 2.7% (range between 2.3% and 3.0%)
– Death rate for ischemic strokes, 2018-20: 20.0 per 100K people
– Death rate for hemorrhagic strokes, 2018-20: 6.3 per 100K people
You may also like: Best places to live in Idaho
Canva
#34. Caribou County
– Age-adjusted rate of all strokes among adults, estimates for 2021: 2.7% (range between 2.3% and 3.0%)
– Death rate for ischemic strokes, 2018-20: 20.7 per 100K people
– Death rate for hemorrhagic strokes, 2018-20: 9.1 per 100K people
Canva
#33. Oneida County
– Age-adjusted rate of all strokes among adults, estimates for 2021: 2.7% (range between 2.3% and 3.1%)
– Death rate for ischemic strokes, 2018-20: 21.1 per 100K people
– Death rate for hemorrhagic strokes, 2018-20: 7.5 per 100K people
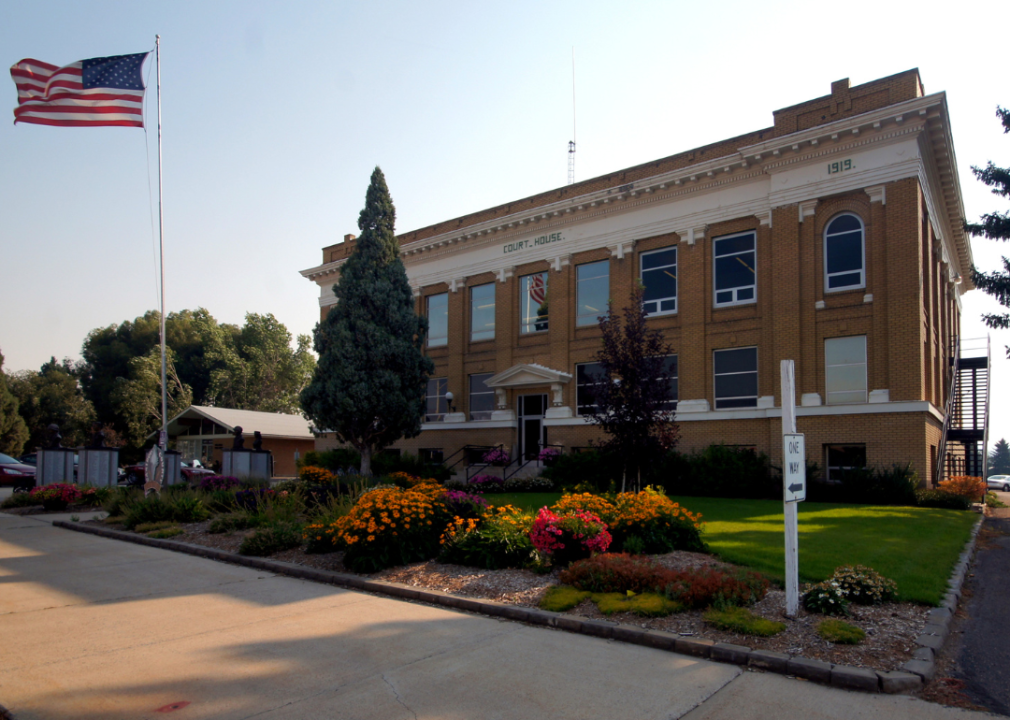
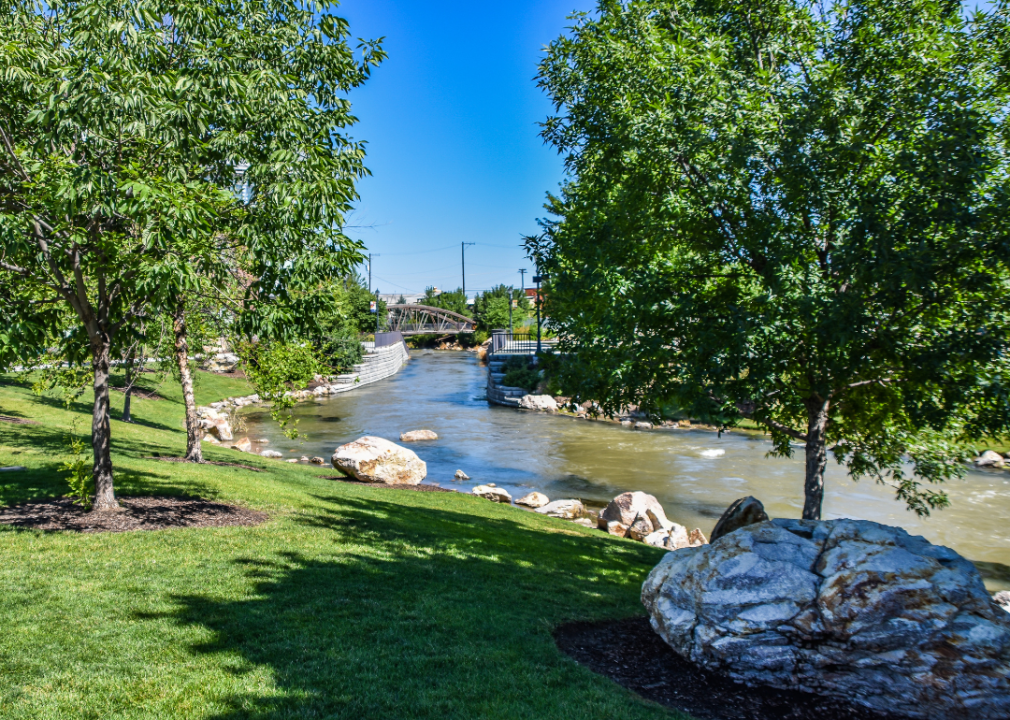
B Brown // Shutterstock
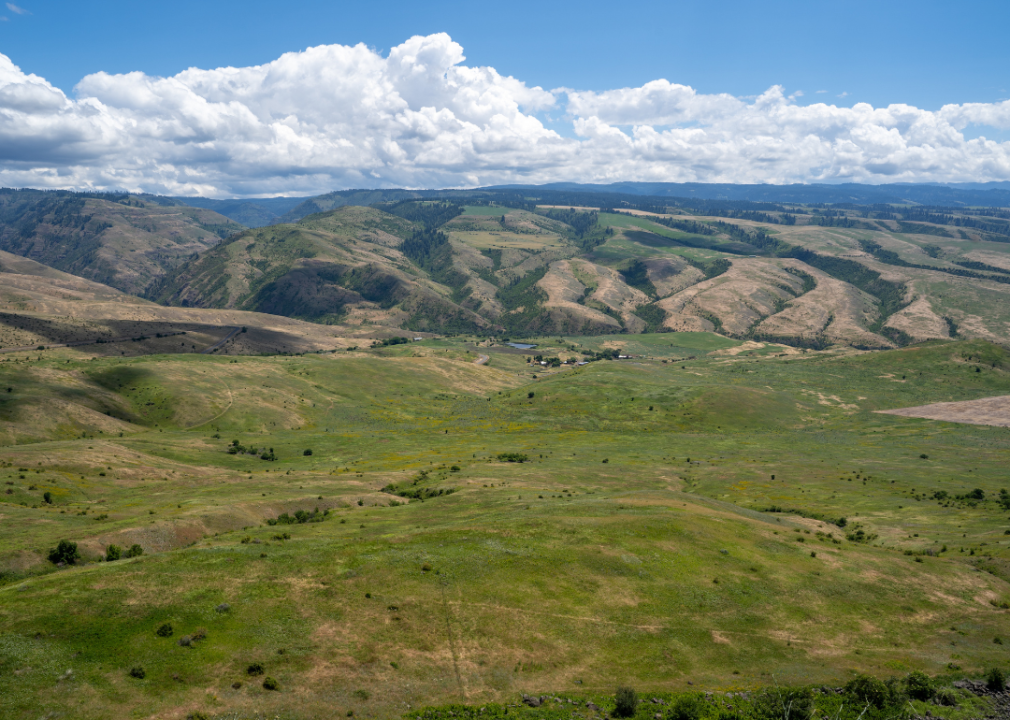
#32. Jefferson County
– Age-adjusted rate of all strokes among adults, estimates for 2021: 2.7% (range between 2.4% and 3.0%)
– Death rate for ischemic strokes, 2018-20: 23.2 per 100K people
– Death rate for hemorrhagic strokes, 2018-20: 6.9 per 100K people
Canva
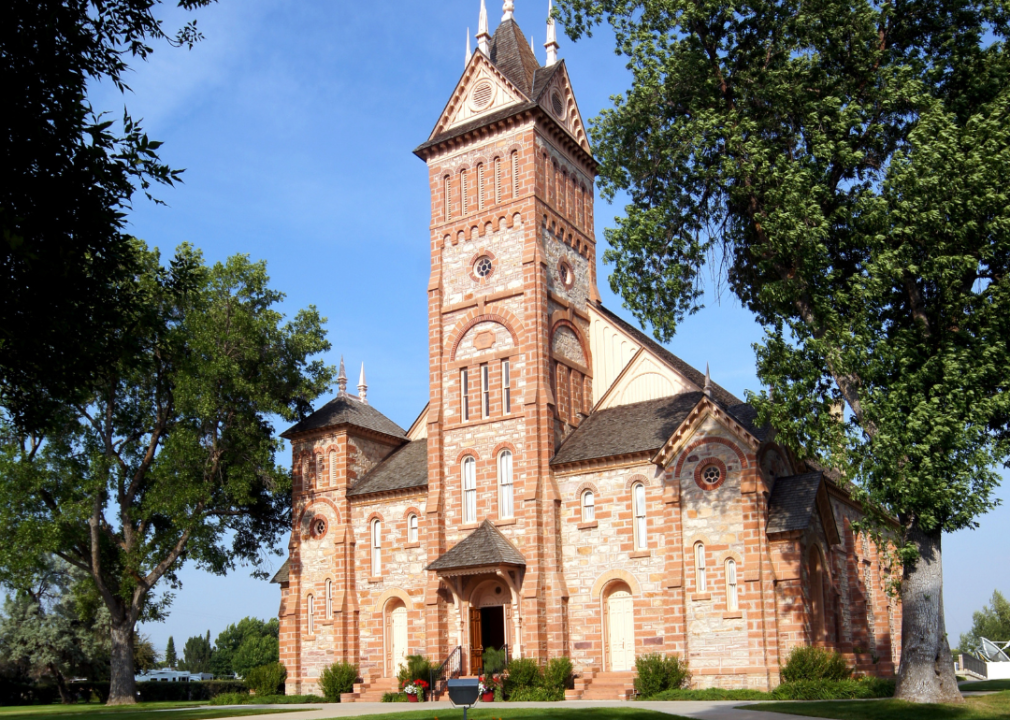
#31. Bear Lake County
– Age-adjusted rate of all strokes among adults, estimates for 2021: 2.8% (range between 2.5% and 3.2%)
– Death rate for ischemic strokes, 2018-20: 19.2 per 100K people
– Death rate for hemorrhagic strokes, 2018-20: 6.2 per 100K people

Canva
#30. Nez Perce County
– Age-adjusted rate of all strokes among adults, estimates for 2021: 2.8% (range between 2.5% and 3.2%)
– Death rate for ischemic strokes, 2018-20: 19.8 per 100K people
– Death rate for hemorrhagic strokes, 2018-20: 6.8 per 100K people
You may also like: Counties with the worst commutes in Idaho
Canva
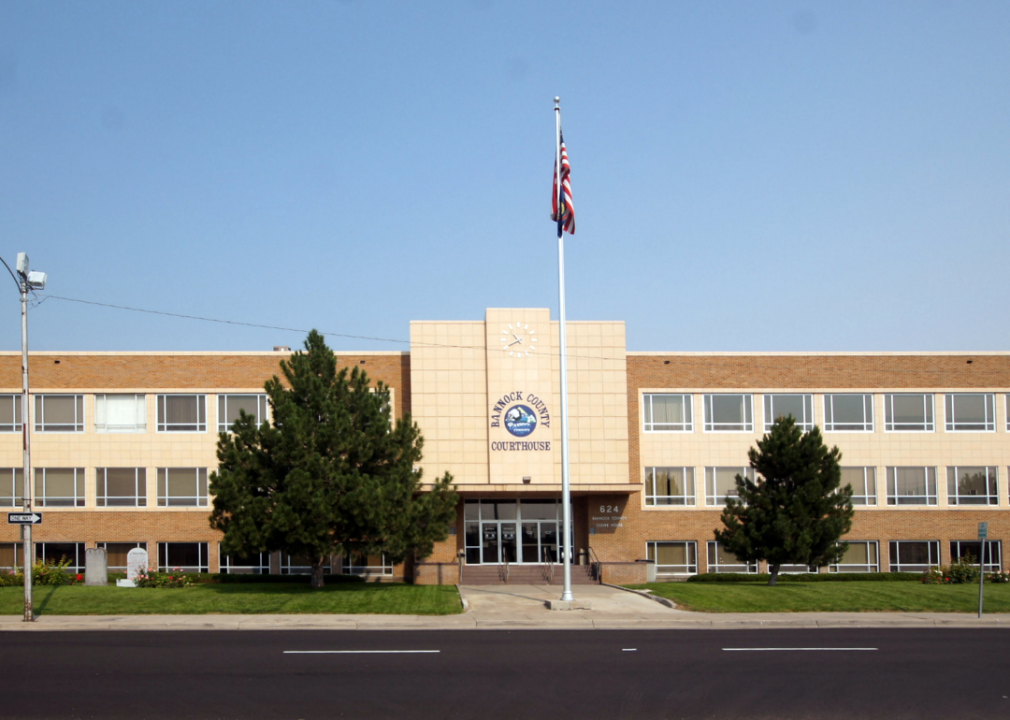
#29. Bannock County
– Age-adjusted rate of all strokes among adults, estimates for 2021: 2.8% (range between 2.4% and 3.2%)
– Death rate for ischemic strokes, 2018-20: 21.5 per 100K people
– Death rate for hemorrhagic strokes, 2018-20: 8.7 per 100K people
Canva
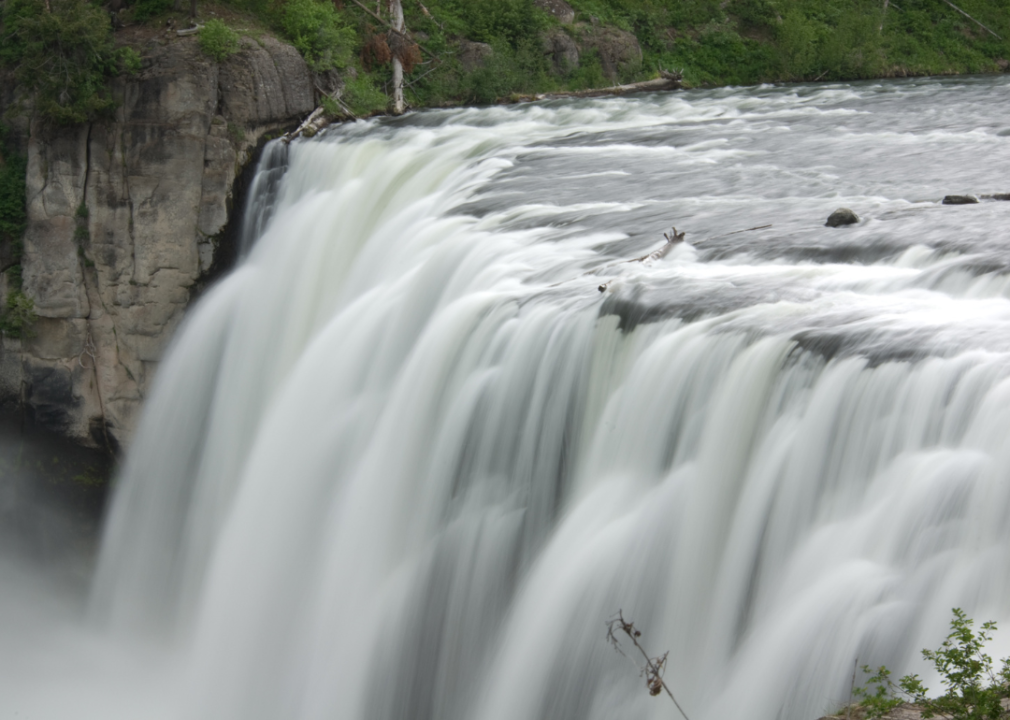
#28. Fremont County
– Age-adjusted rate of all strokes among adults, estimates for 2021: 2.8% (range between 2.4% and 3.1%)
– Death rate for ischemic strokes, 2018-20: 26.0 per 100K people
– Death rate for hemorrhagic strokes, 2018-20: 4.7 per 100K people
Canva
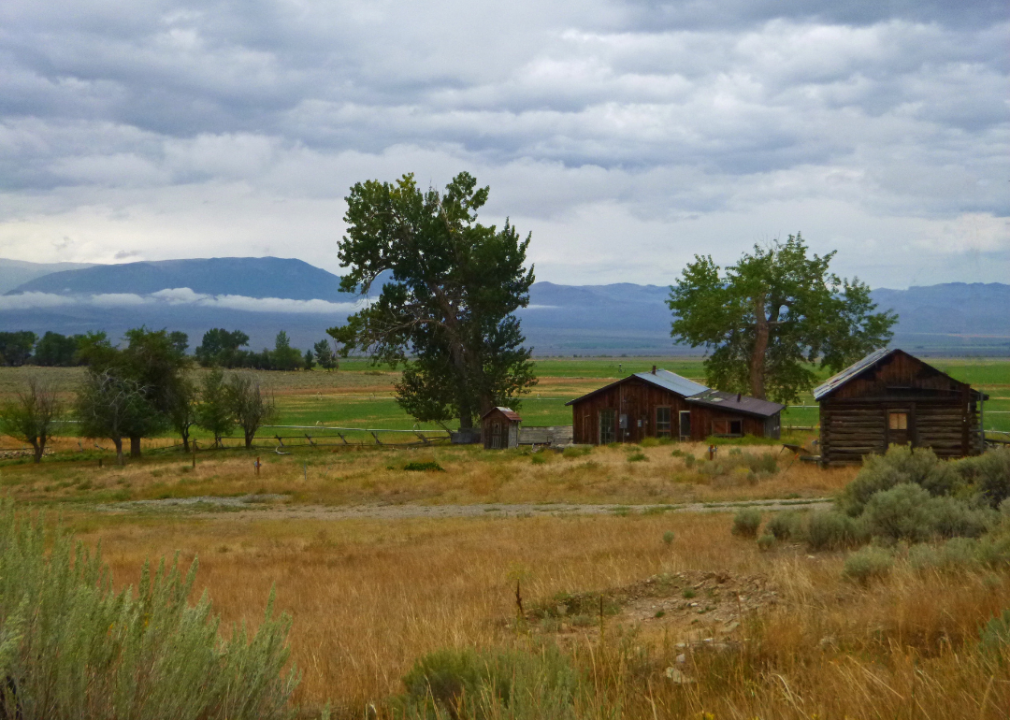
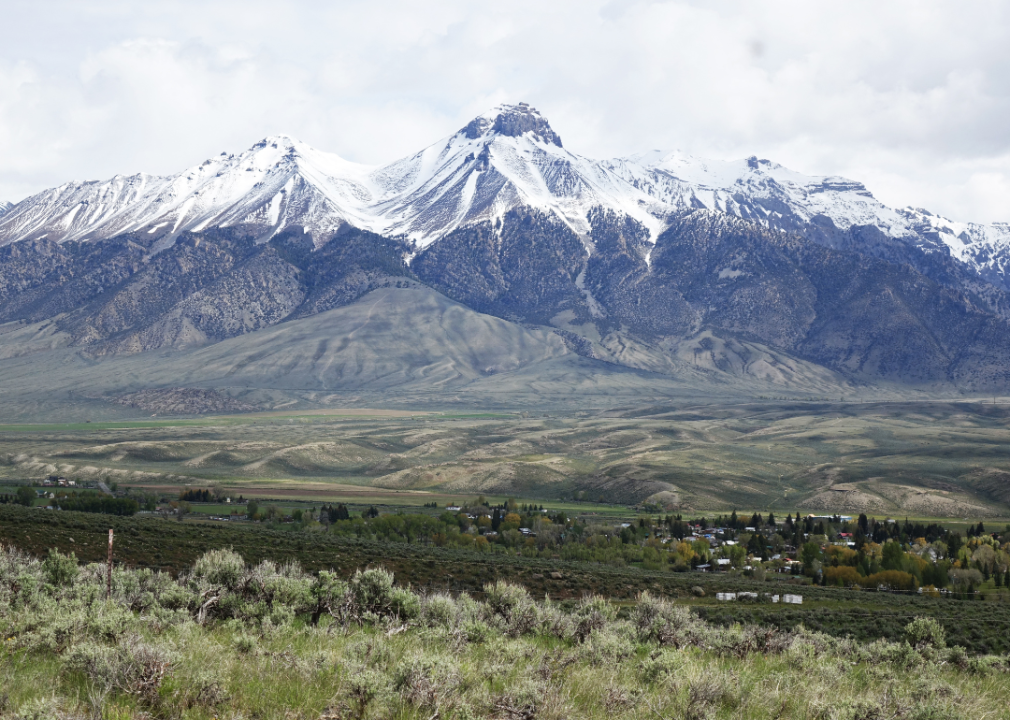
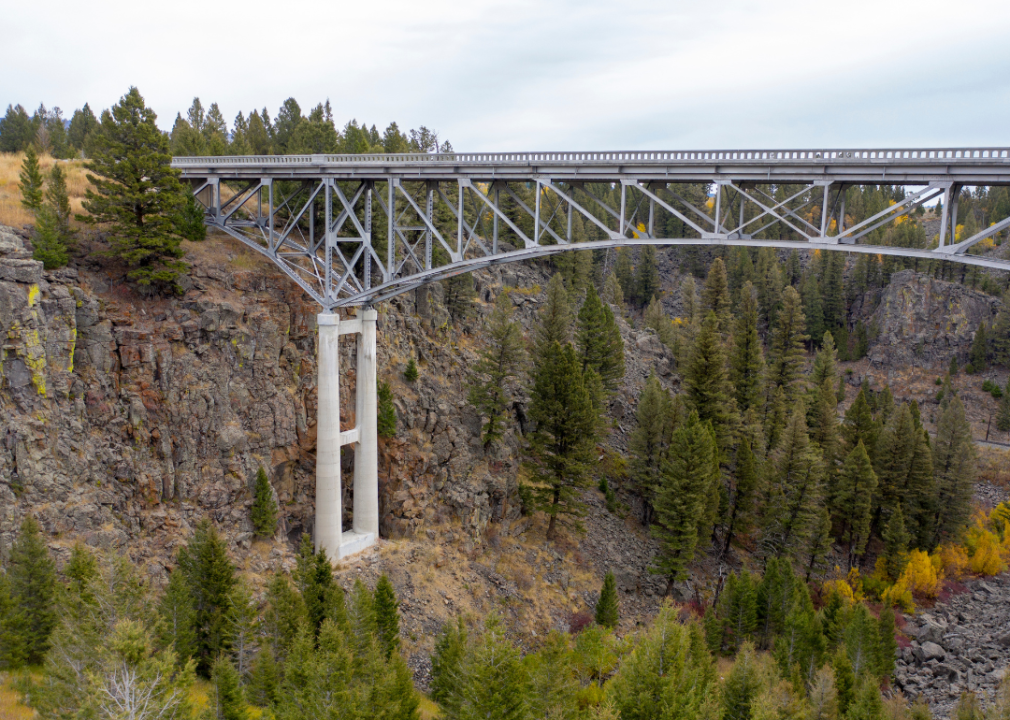
#27. Lemhi County
– Age-adjusted rate of all strokes among adults, estimates for 2021: 2.9% (range between 2.5% and 3.3%)
– Death rate for ischemic strokes, 2018-20: 14.9 per 100K people
– Death rate for hemorrhagic strokes, 2018-20: 7.4 per 100K people

Canva
#26. Adams County
– Age-adjusted rate of all strokes among adults, estimates for 2021: 2.9% (range between 2.5% and 3.3%)
– Death rate for ischemic strokes, 2018-20: 15.3 per 100K people
– Death rate for hemorrhagic strokes, 2018-20: 3.6 per 100K people
Canva
#25. Clearwater County
– Age-adjusted rate of all strokes among adults, estimates for 2021: 2.9% (range between 2.5% and 3.2%)
– Death rate for ischemic strokes, 2018-20: 16.4 per 100K people
– Death rate for hemorrhagic strokes, 2018-20: 7.0 per 100K people
You may also like: See how Idaho will be affected if Roe v. Wade is overturned
Canva
#24. Canyon County
– Age-adjusted rate of all strokes among adults, estimates for 2021: 2.9% (range between 2.5% and 3.3%)
– Death rate for ischemic strokes, 2018-20: 16.5 per 100K people
– Death rate for hemorrhagic strokes, 2018-20: 6.7 per 100K people
Canva
#23. Payette County
– Age-adjusted rate of all strokes among adults, estimates for 2021: 2.9% (range between 2.5% and 3.3%)
– Death rate for ischemic strokes, 2018-20: 17.0 per 100K people
– Death rate for hemorrhagic strokes, 2018-20: 6.6 per 100K people

Canva
#22. Twin Falls County
– Age-adjusted rate of all strokes among adults, estimates for 2021: 2.9% (range between 2.5% and 3.3%)
– Death rate for ischemic strokes, 2018-20: 19.6 per 100K people
– Death rate for hemorrhagic strokes, 2018-20: 8.3 per 100K people
Canva
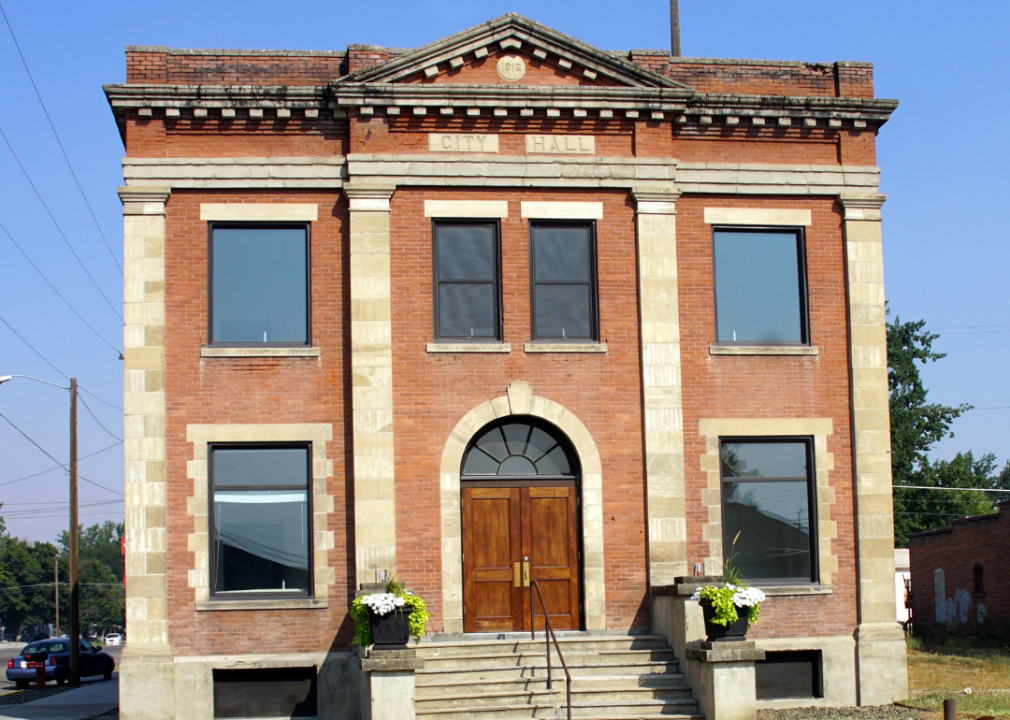
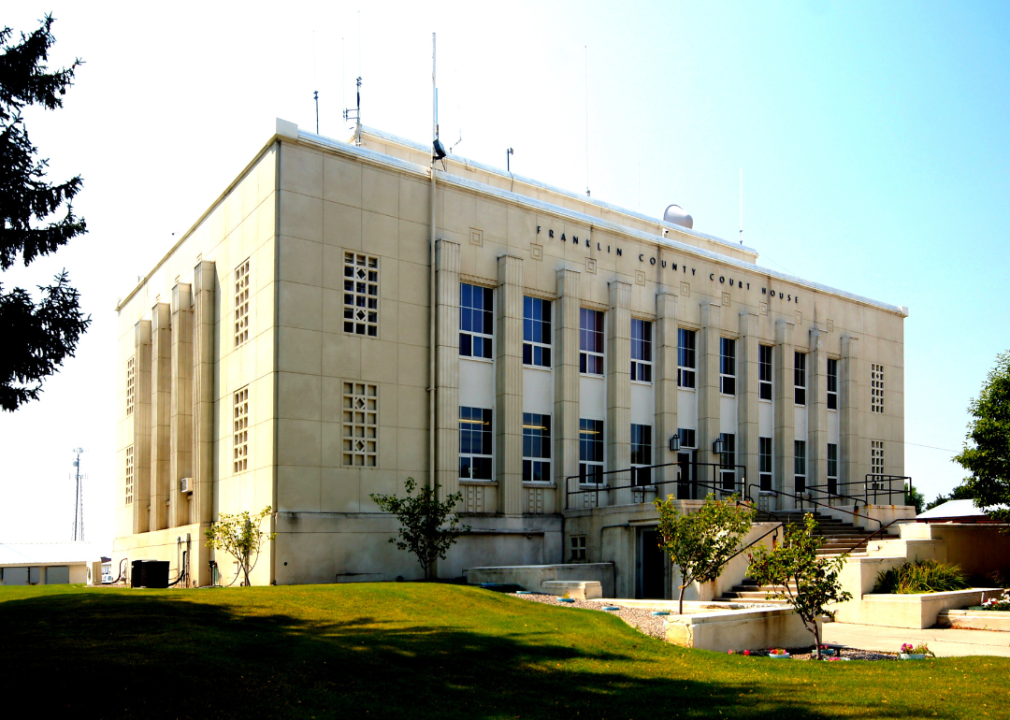
#21. Franklin County
– Age-adjusted rate of all strokes among adults, estimates for 2021: 2.9% (range between 2.5% and 3.2%)
– Death rate for ischemic strokes, 2018-20: 20.2 per 100K people
– Death rate for hemorrhagic strokes, 2018-20: 6.6 per 100K people

Canva
#20. Idaho County
– Age-adjusted rate of all strokes among adults, estimates for 2021: 3.0% (range between 2.6% and 3.4%)
– Death rate for ischemic strokes, 2018-20: 15.5 per 100K people
– Death rate for hemorrhagic strokes, 2018-20: 6.8 per 100K people
You may also like: Countries Idaho imports the most goods from
Canva
#19. Custer County
– Age-adjusted rate of all strokes among adults, estimates for 2021: 3.0% (range between 2.5% and 3.4%)
– Death rate for ischemic strokes, 2018-20: 16.7 per 100K people
– Death rate for hemorrhagic strokes, 2018-20: 7.9 per 100K people
Canva
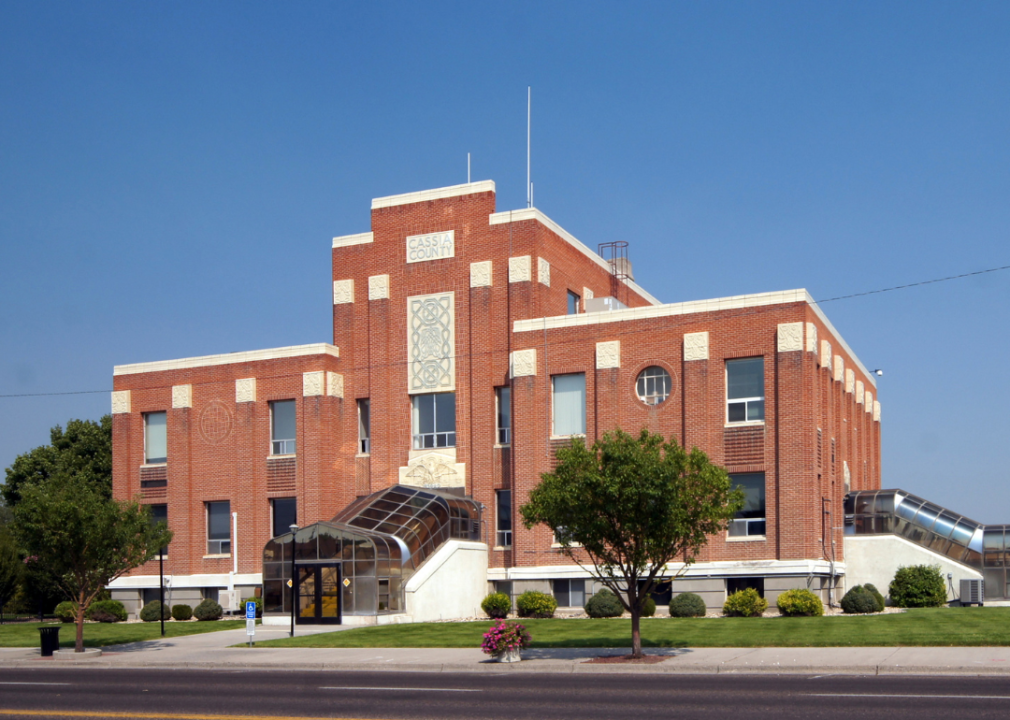
#18. Cassia County
– Age-adjusted rate of all strokes among adults, estimates for 2021: 3.0% (range between 2.6% and 3.4%)
– Death rate for ischemic strokes, 2018-20: 20.4 per 100K people
– Death rate for hemorrhagic strokes, 2018-20: 9.0 per 100K people
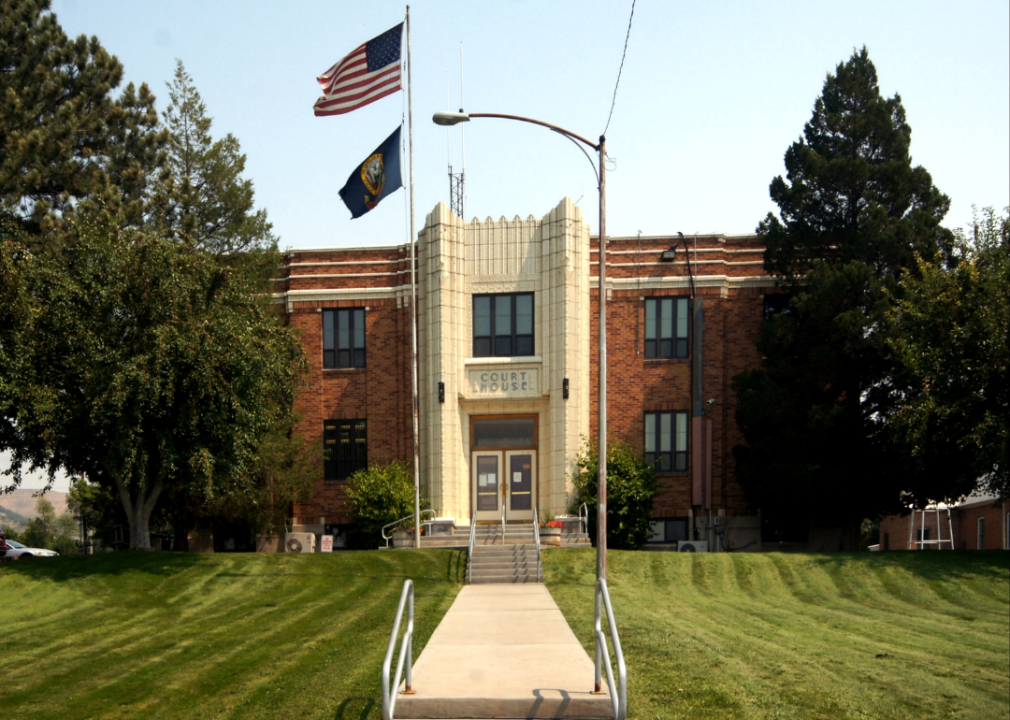
Tucker James // Shutterstock
#17. Bingham County
– Age-adjusted rate of all strokes among adults, estimates for 2021: 3.0% (range between 2.7% and 3.4%)
– Death rate for ischemic strokes, 2018-20: 20.5 per 100K people
– Death rate for hemorrhagic strokes, 2018-20: 8.4 per 100K people
Canva
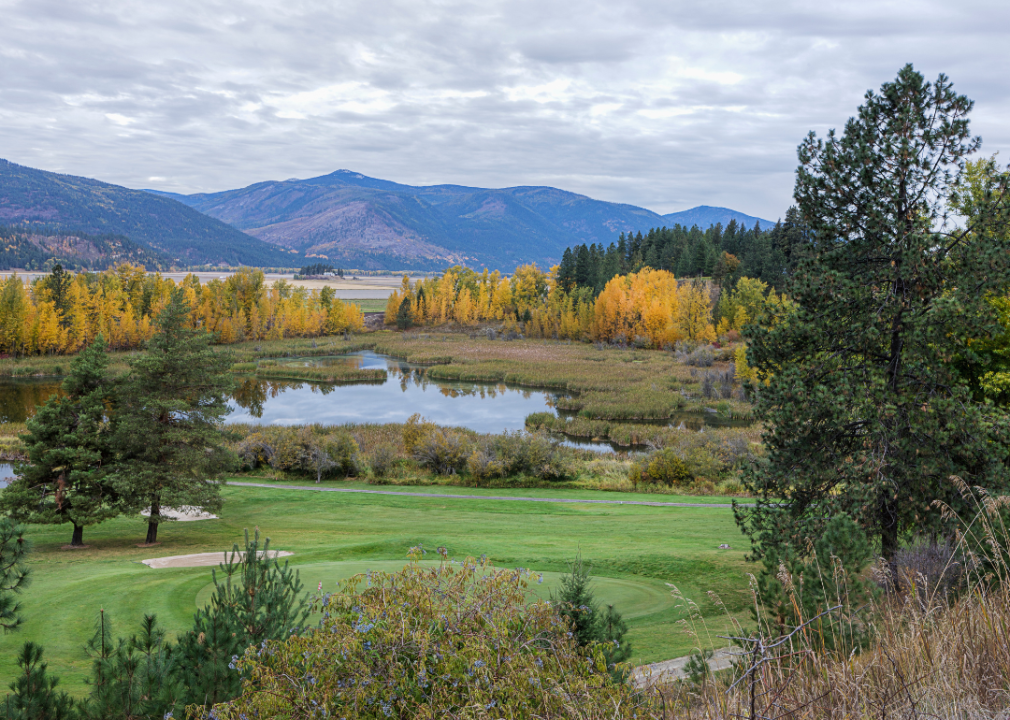
#16. Boundary County
– Age-adjusted rate of all strokes among adults, estimates for 2021: 3.0% (range between 2.6% and 3.3%)
– Death rate for ischemic strokes, 2018-20: 22.5 per 100K people
– Death rate for hemorrhagic strokes, 2018-20: 6.1 per 100K people

Canva
#15. Camas County
– Age-adjusted rate of all strokes among adults, estimates for 2021: 3.1% (range between 2.6% and 3.5%)
– Death rate for ischemic strokes, 2018-20: 13.9 per 100K people
– Death rate for hemorrhagic strokes, 2018-20: 8.2 per 100K people
You may also like: Highest-rated specialty museums in Idaho, according to Tripadvisor
Canva
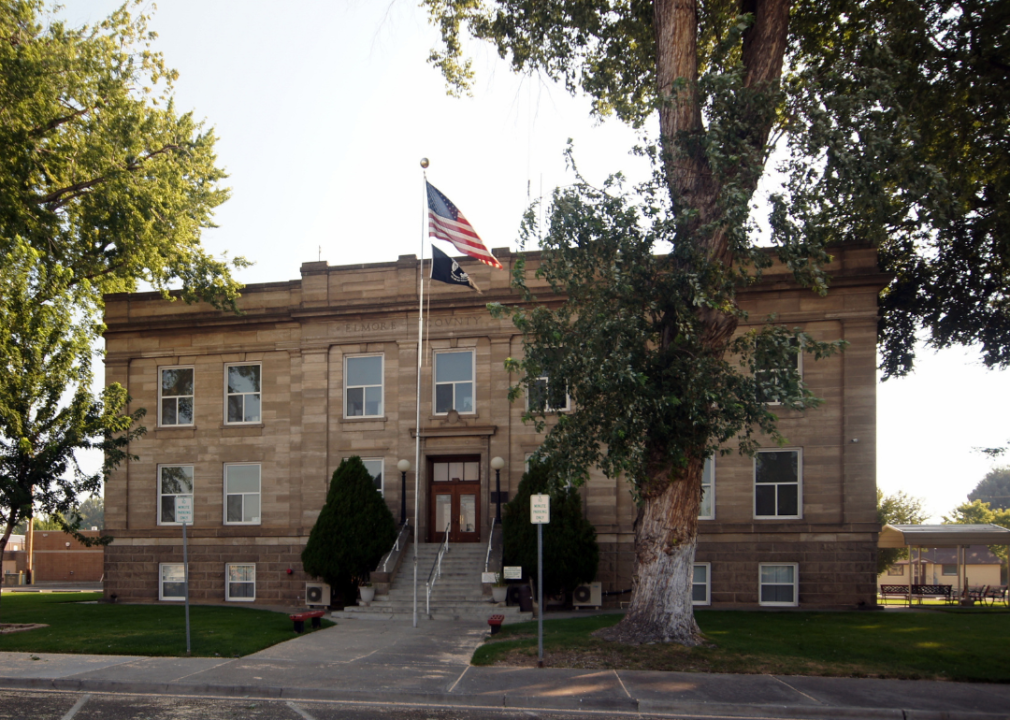
#14. Elmore County
– Age-adjusted rate of all strokes among adults, estimates for 2021: 3.1% (range between 2.8% and 3.5%)
– Death rate for ischemic strokes, 2018-20: 15.7 per 100K people
– Death rate for hemorrhagic strokes, 2018-20: 7.2 per 100K people
Canva
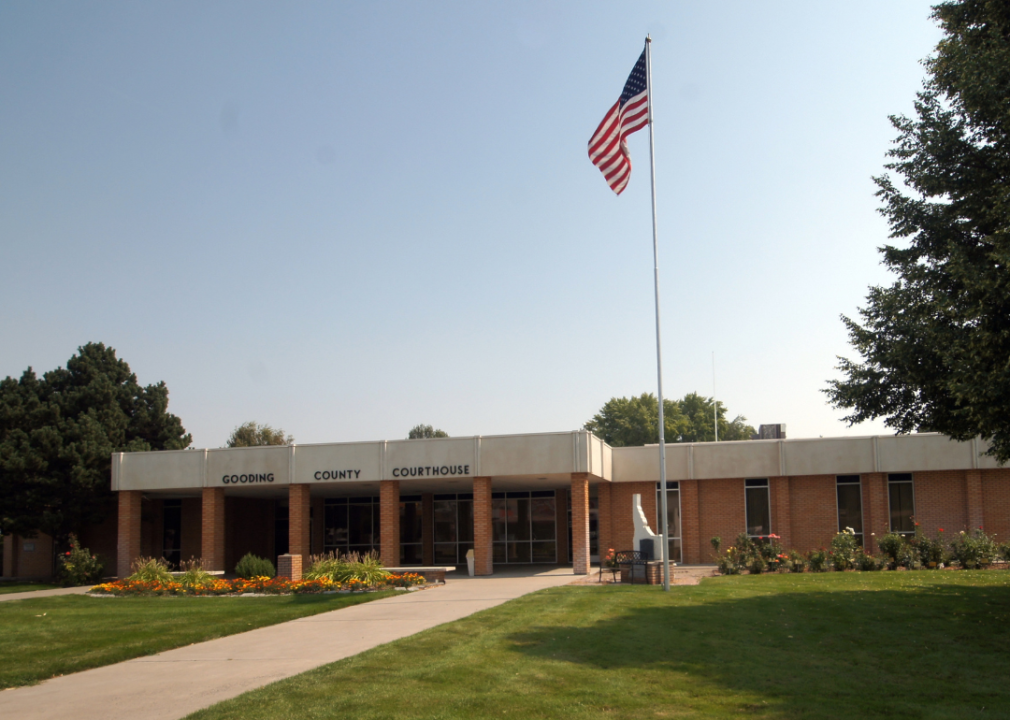
#13. Gooding County
– Age-adjusted rate of all strokes among adults, estimates for 2021: 3.1% (range between 2.7% and 3.5%)
– Death rate for ischemic strokes, 2018-20: 19.8 per 100K people
– Death rate for hemorrhagic strokes, 2018-20: 7.8 per 100K people
Canva
#12. Power County
– Age-adjusted rate of all strokes among adults, estimates for 2021: 3.1% (range between 2.8% and 3.6%)
– Death rate for ischemic strokes, 2018-20: 20.0 per 100K people
– Death rate for hemorrhagic strokes, 2018-20: 9.2 per 100K people
Canva
#11. Madison County
– Age-adjusted rate of all strokes among adults, estimates for 2021: 3.1% (range between 2.7% and 3.5%)
– Death rate for ischemic strokes, 2018-20: 24.7 per 100K people
– Death rate for hemorrhagic strokes, 2018-20: 6.5 per 100K people
Canva
#10. Lincoln County
– Age-adjusted rate of all strokes among adults, estimates for 2021: 3.2% (range between 2.8% and 3.6%)
– Death rate for ischemic strokes, 2018-20: 14.7 per 100K people
– Death rate for hemorrhagic strokes, 2018-20: 7.7 per 100K people
You may also like: Highest-rated football recruits from Idaho over the last 20 years
Canva
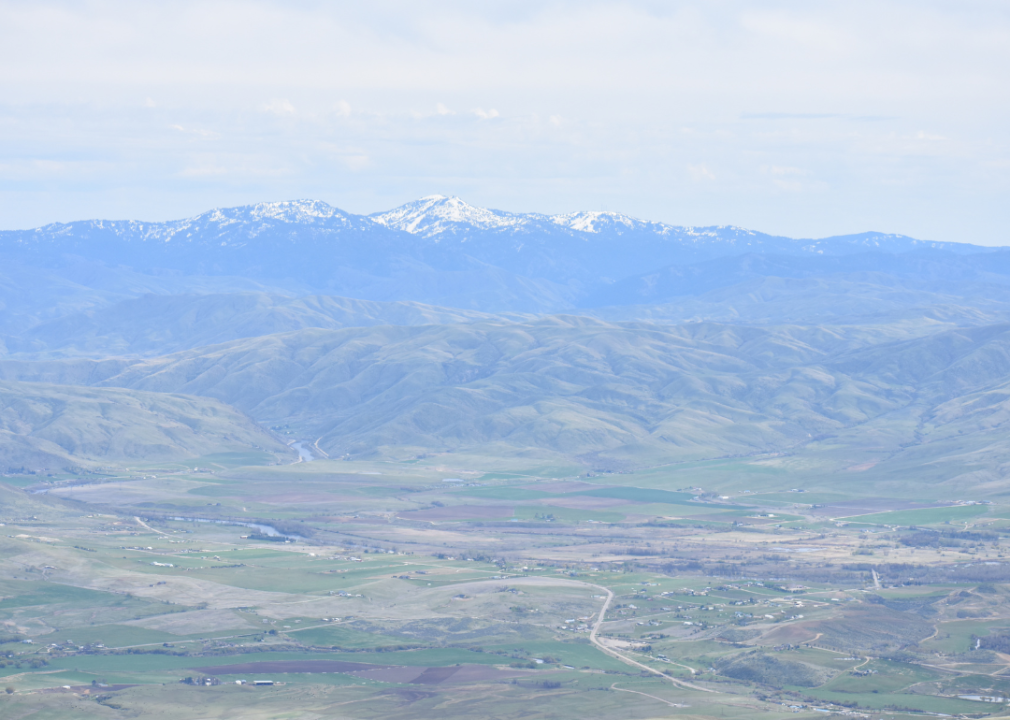
#9. Washington County
– Age-adjusted rate of all strokes among adults, estimates for 2021: 3.2% (range between 2.8% and 3.6%)
– Death rate for ischemic strokes, 2018-20: 15.7 per 100K people
– Death rate for hemorrhagic strokes, 2018-20: 4.9 per 100K people
Canva
#8. Minidoka County
– Age-adjusted rate of all strokes among adults, estimates for 2021: 3.2% (range between 2.8% and 3.6%)
– Death rate for ischemic strokes, 2018-20: 17.3 per 100K people
– Death rate for hemorrhagic strokes, 2018-20: 7.6 per 100K people
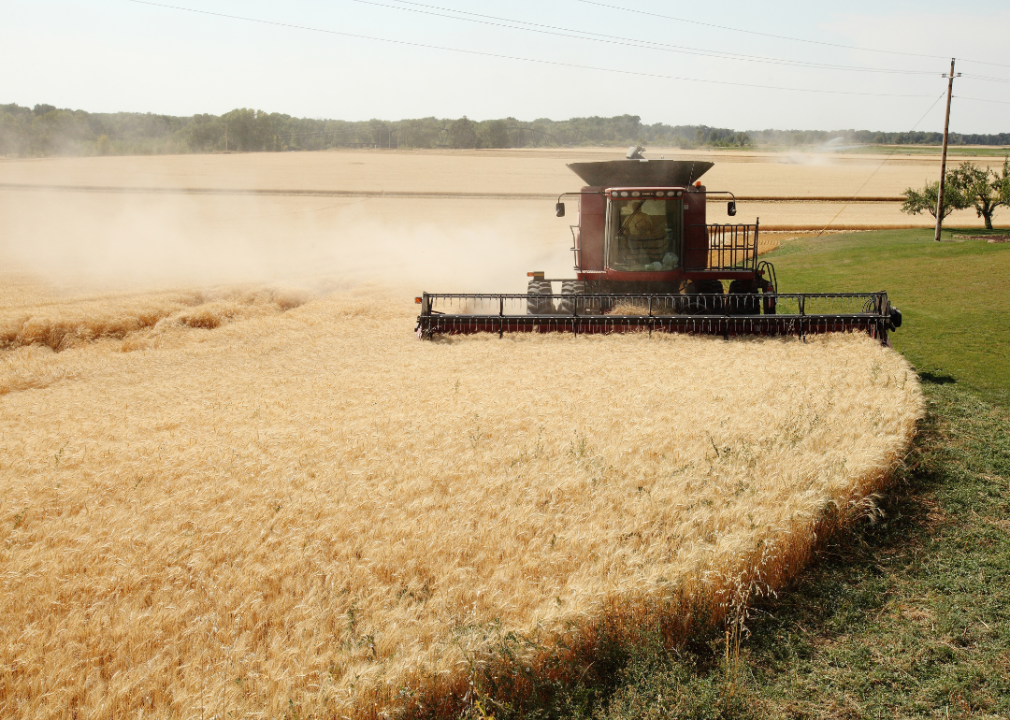
melissamn // Shutterstock
#7. Lewis County
– Age-adjusted rate of all strokes among adults, estimates for 2021: 3.2% (range between 2.8% and 3.6%)
– Death rate for ischemic strokes, 2018-20: 19.3 per 100K people
– Death rate for hemorrhagic strokes, 2018-20: 6.5 per 100K people

Norm Lane // Shutterstock
#6. Benewah County
– Age-adjusted rate of all strokes among adults, estimates for 2021: 3.2% (range between 2.8% and 3.6%)
– Death rate for ischemic strokes, 2018-20: 19.6 per 100K people
– Death rate for hemorrhagic strokes, 2018-20: 7.2 per 100K people
David Gilder // Shutterstock
#5. Clark County
– Age-adjusted rate of all strokes among adults, estimates for 2021: 3.2% (range between 2.8% and 3.6%)
– Death rate for ischemic strokes, 2018-20: 24.4 per 100K people
– Death rate for hemorrhagic strokes, 2018-20: -1.0 per 100K people
You may also like: See how much delivery drivers in Idaho make
Canva
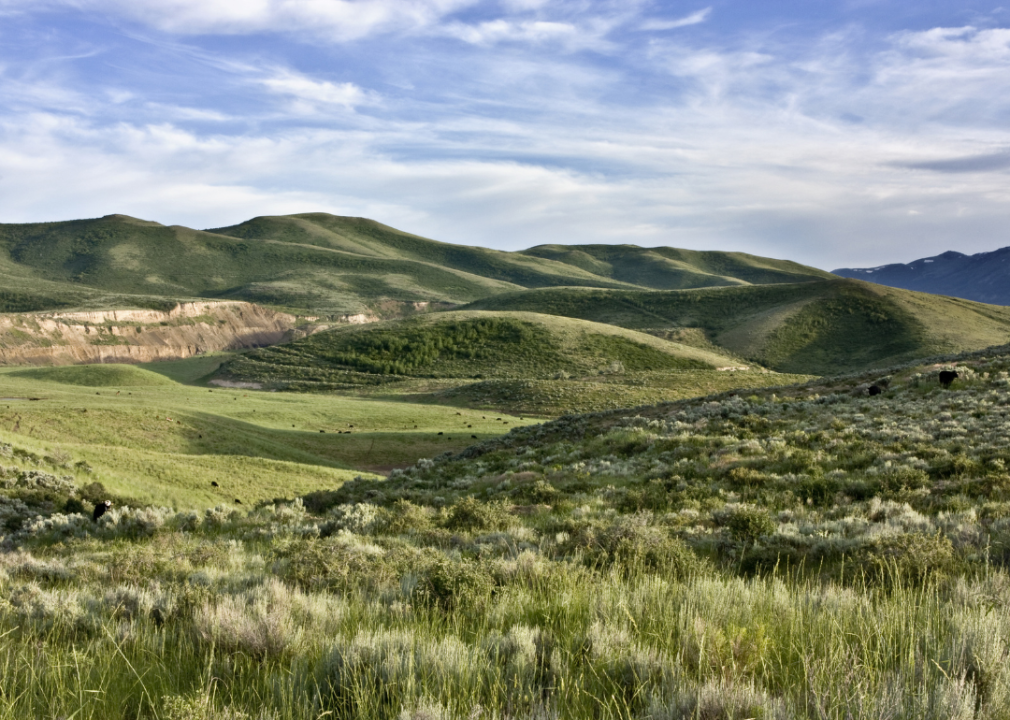
#4. Owyhee County
– Age-adjusted rate of all strokes among adults, estimates for 2021: 3.3% (range between 2.9% and 3.7%)
– Death rate for ischemic strokes, 2018-20: 18.0 per 100K people
– Death rate for hemorrhagic strokes, 2018-20: 7.3 per 100K people
davidrh // Shutterstock
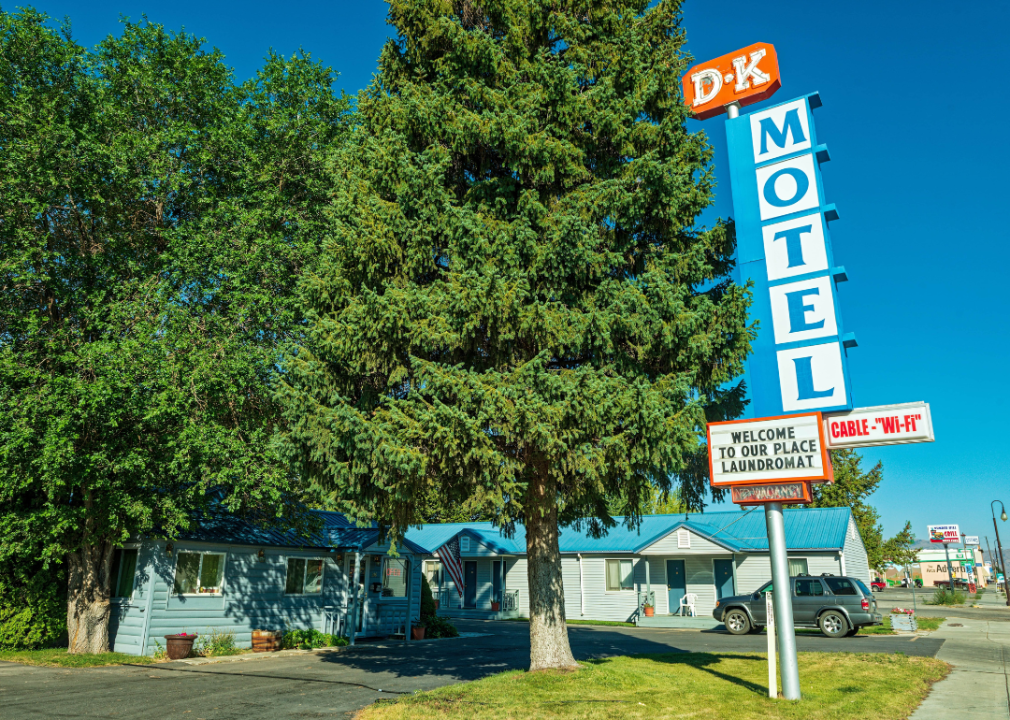
#3. Butte County
– Age-adjusted rate of all strokes among adults, estimates for 2021: 3.3% (range between 2.9% and 3.8%)
– Death rate for ischemic strokes, 2018-20: 20.1 per 100K people
– Death rate for hemorrhagic strokes, 2018-20: 9.1 per 100K people
Canva
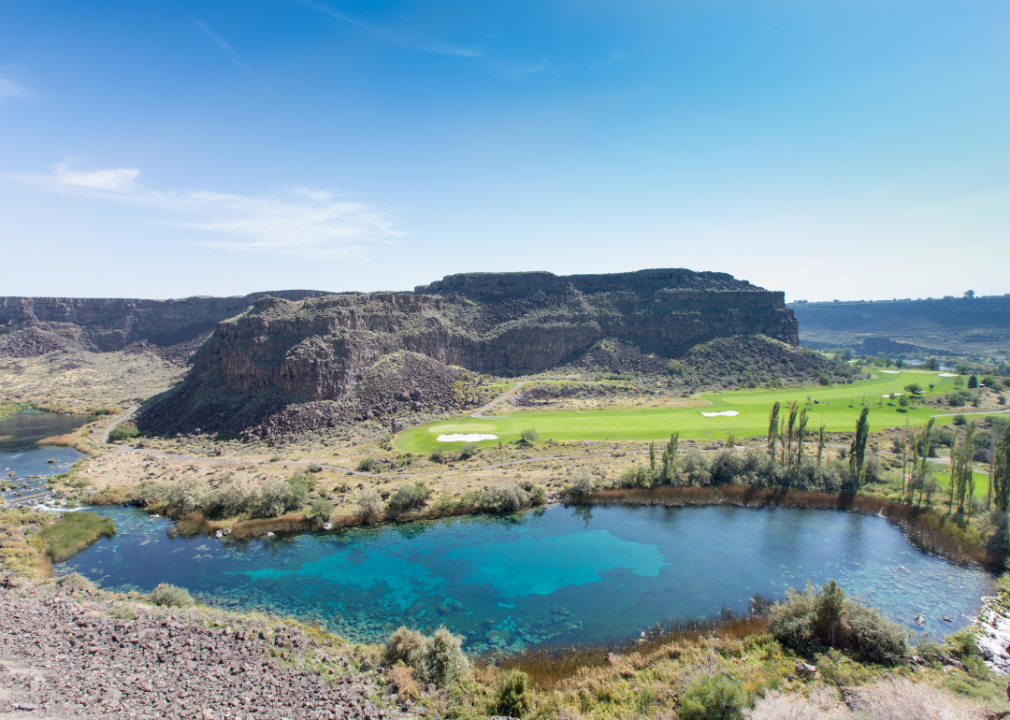
#2. Jerome County
– Age-adjusted rate of all strokes among adults, estimates for 2021: 3.3% (range between 2.9% and 3.7%)
– Death rate for ischemic strokes, 2018-20: 20.2 per 100K people
– Death rate for hemorrhagic strokes, 2018-20: 8.1 per 100K people
jfergusonphotos // Shutterstock
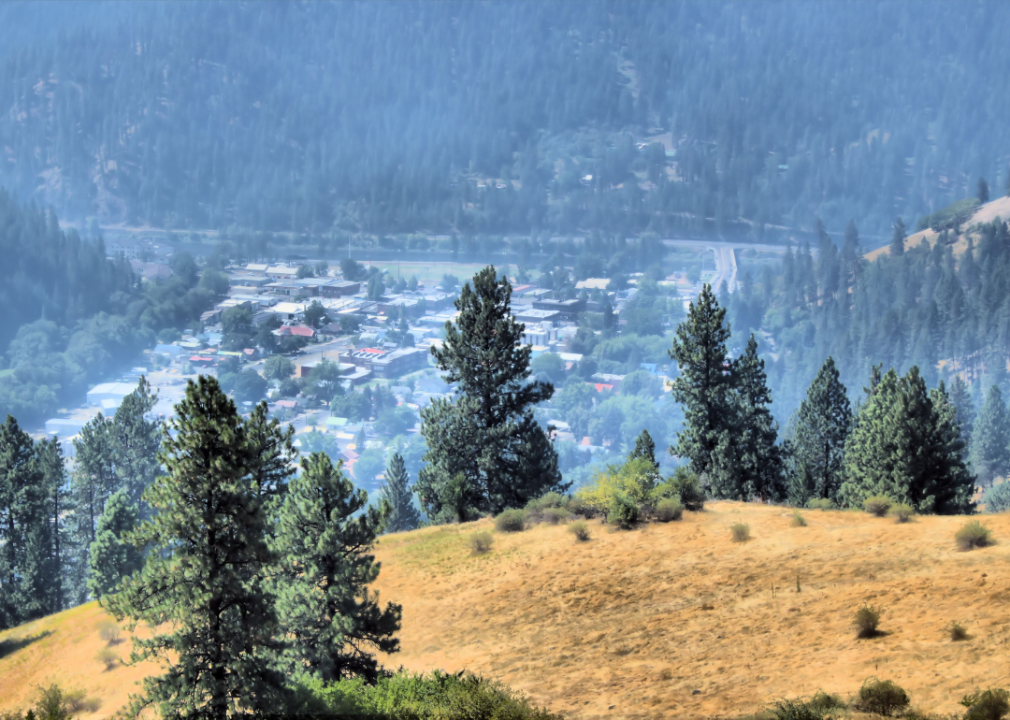
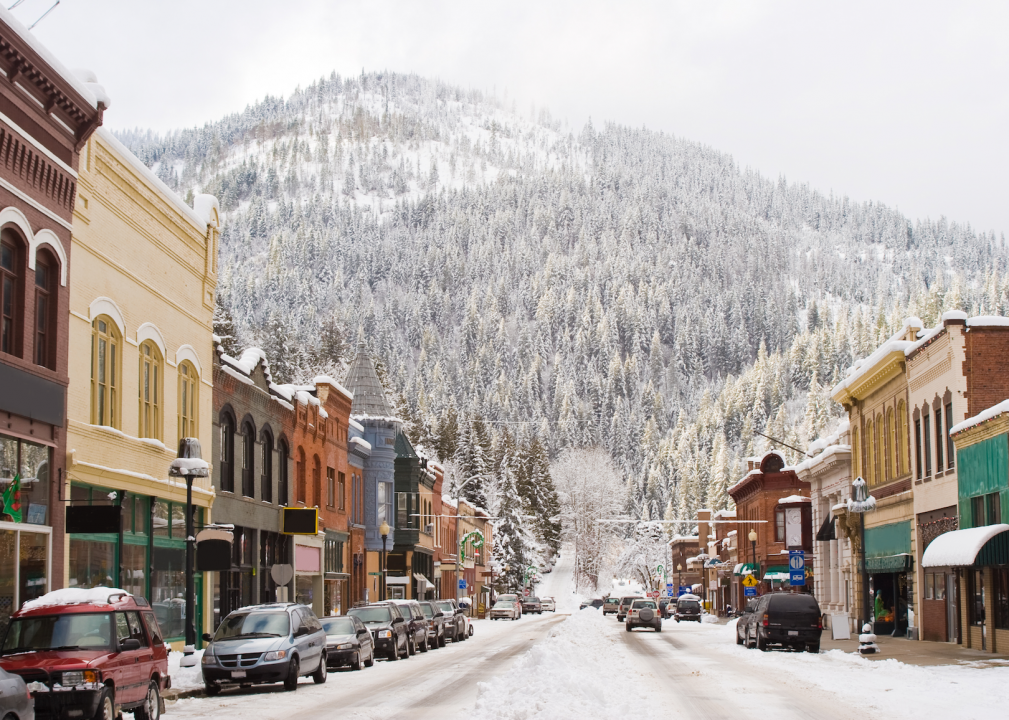
#1. Shoshone County
– Age-adjusted rate of all strokes among adults, estimates for 2021: 3.3% (range between 2.9% and 3.7%)
– Death rate for ischemic strokes, 2018-20: 21.9 per 100K people
– Death rate for hemorrhagic strokes, 2018-20: 6.4 per 100K people
This story features data reporting and writing by Emma Rubin and is part of a series utilizing data automation across 49 states.