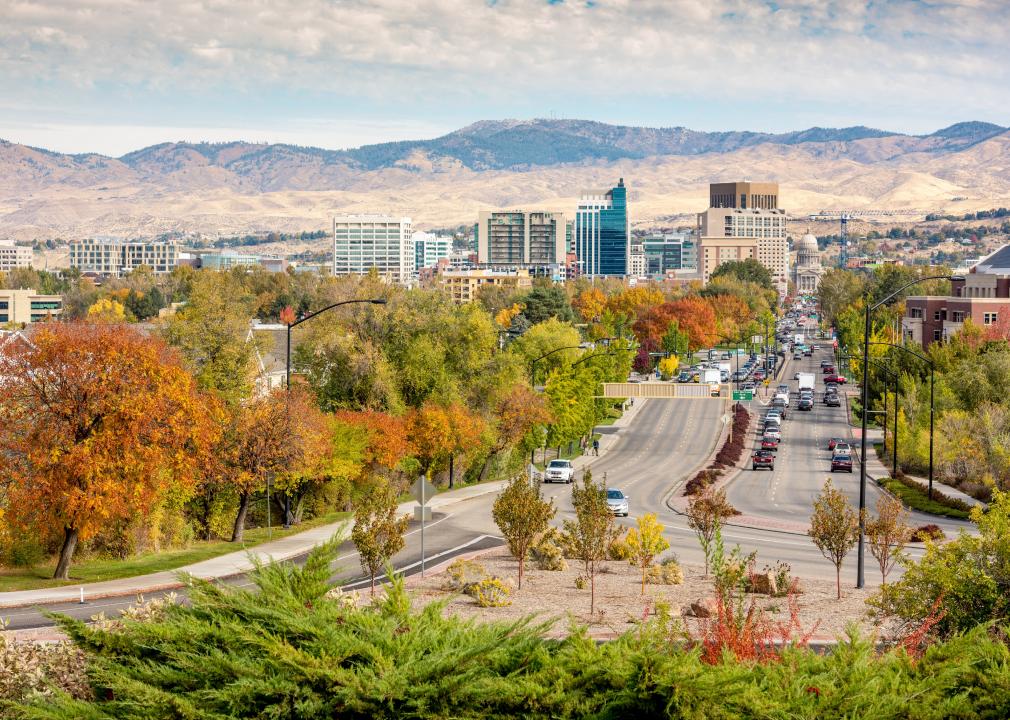
Most diverse counties in Idaho
KRRK // Wikimedia Commons
Most diverse counties in Idaho
The United States has a longstanding reputation as being a melting pot (or salad bowl), with its diversity manifesting itself across many different demographics. However, some places across the country are notably more heterogeneous than others.
Stacker compiled a list of the most diverse counties in Idaho using data from using data from the U.S. Census Bureau. Counties are ranked by the highest Simpson’s diversity index score. Simpson’s diversity index measures community diversity on a scale of 0 (least diverse) to 1 (most diverse), more on the calculation can be read here.
Think you know which counties in your home state might be the most diverse? Keep reading to see if your predictions are correct.
You may also like: Biggest sources of immigrants to Idaho
![]()
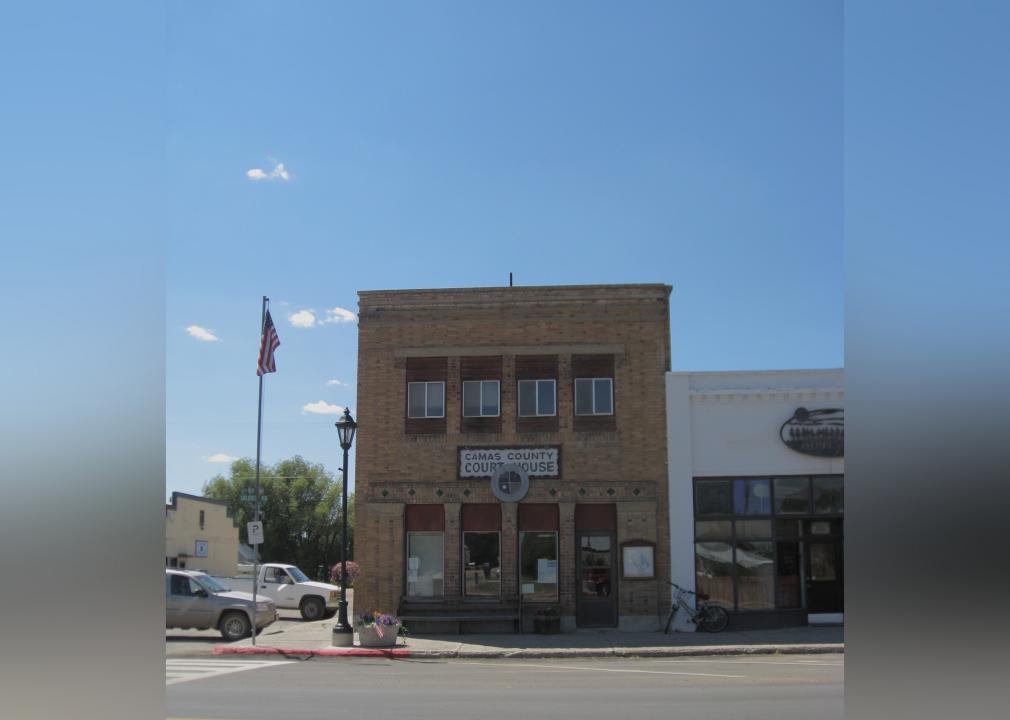
Cornellrockey04 // Wikimedia Commons
#44. Camas County
– Index: 0.006
– Total population: 1,048
– White: 99.7% (1,045)
– Black or African American: 0.0% (0)
– American Indian and Alaska Native: 0.0% (0)
– Asian: 0.0% (0)
– Native Hawaiian and other Pacific Islander: 0.0% (0)
– 2 or more races: 0.3% (3)
– Some other Race: 0.0% (0)
Squelle // Wikimedia Commons
#43. Butte County
– Index: 0.011
– Total population: 2,581
– White: 99.5% (2,567)
– Black or African American: 0.2% (4)
– American Indian and Alaska Native: 0.0% (0)
– Asian: 0.0% (0)
– Native Hawaiian and other Pacific Islander: 0.0% (0)
– 2 or more races: 0.0% (0)
– Some other Race: 0.4% (10)
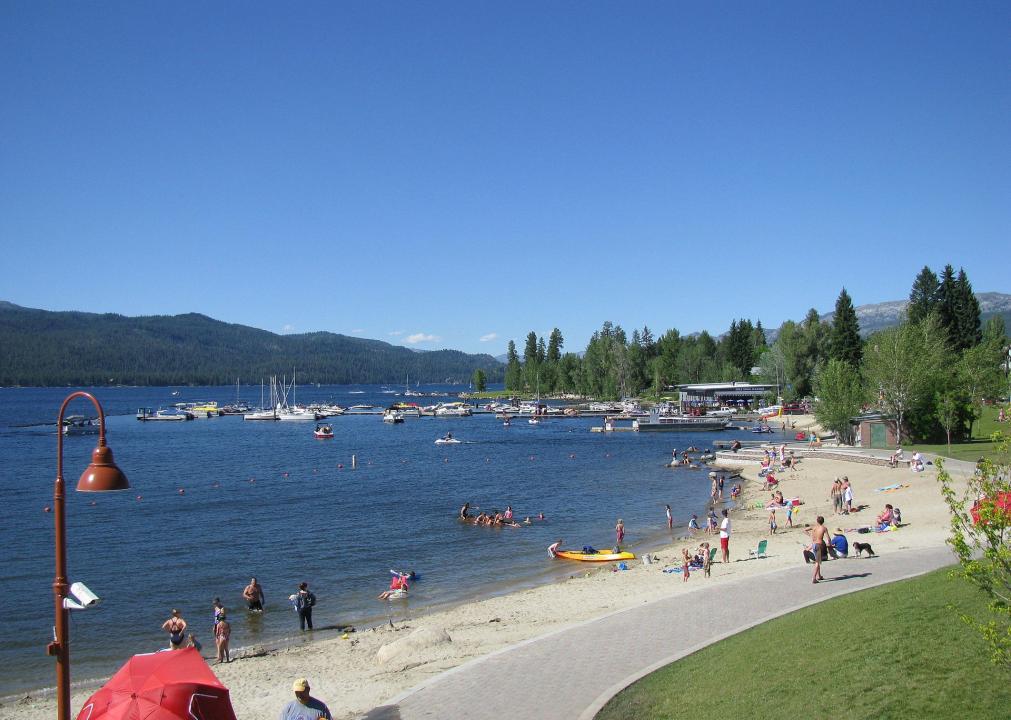
Karthikc123 // Wikimedia Commons
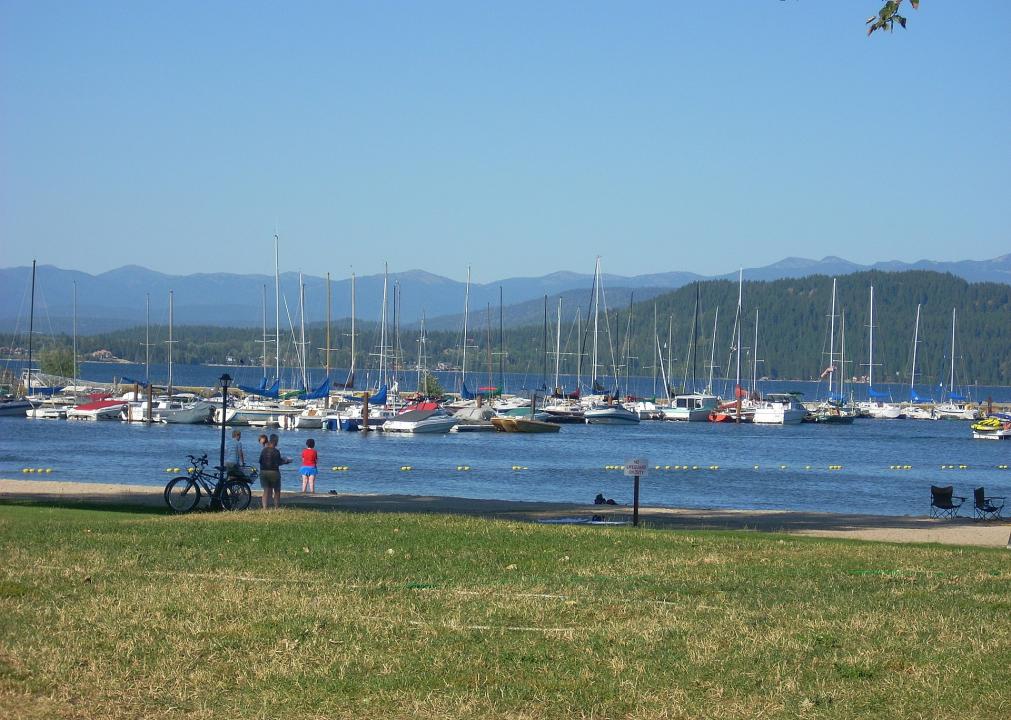
#42. Valley County
– Index: 0.025
– Total population: 10,709
– White: 98.8% (10,576)
– Black or African American: 0.1% (6)
– American Indian and Alaska Native: 0.2% (22)
– Asian: 0.3% (29)
– Native Hawaiian and other Pacific Islander: 0.0% (0)
– 2 or more races: 0.4% (41)
– Some other Race: 0.3% (35)
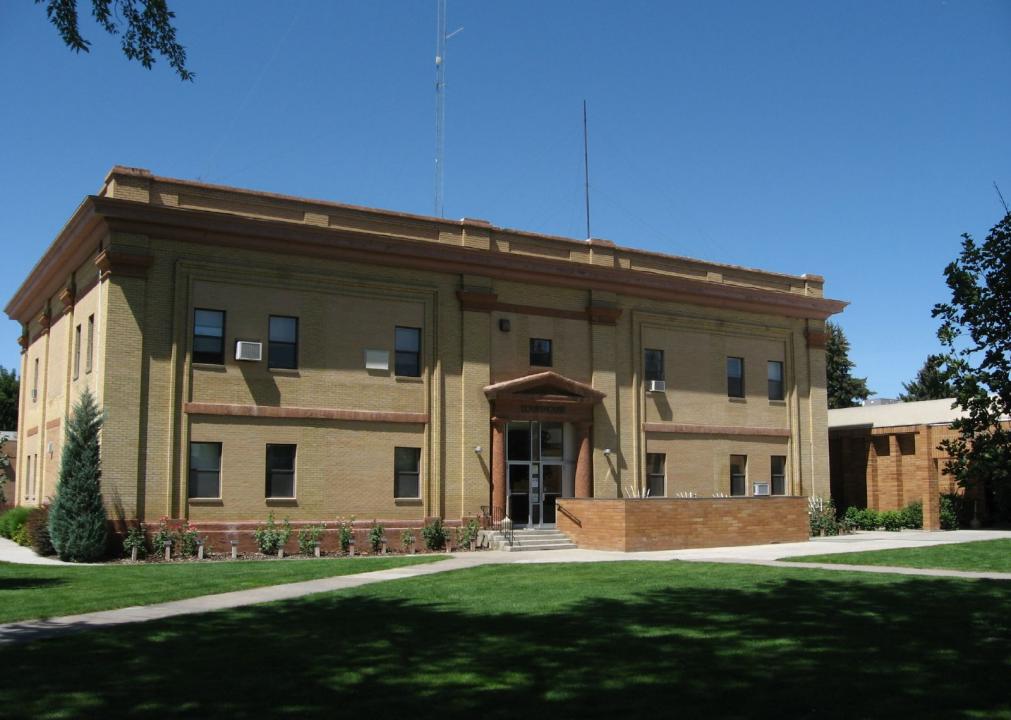
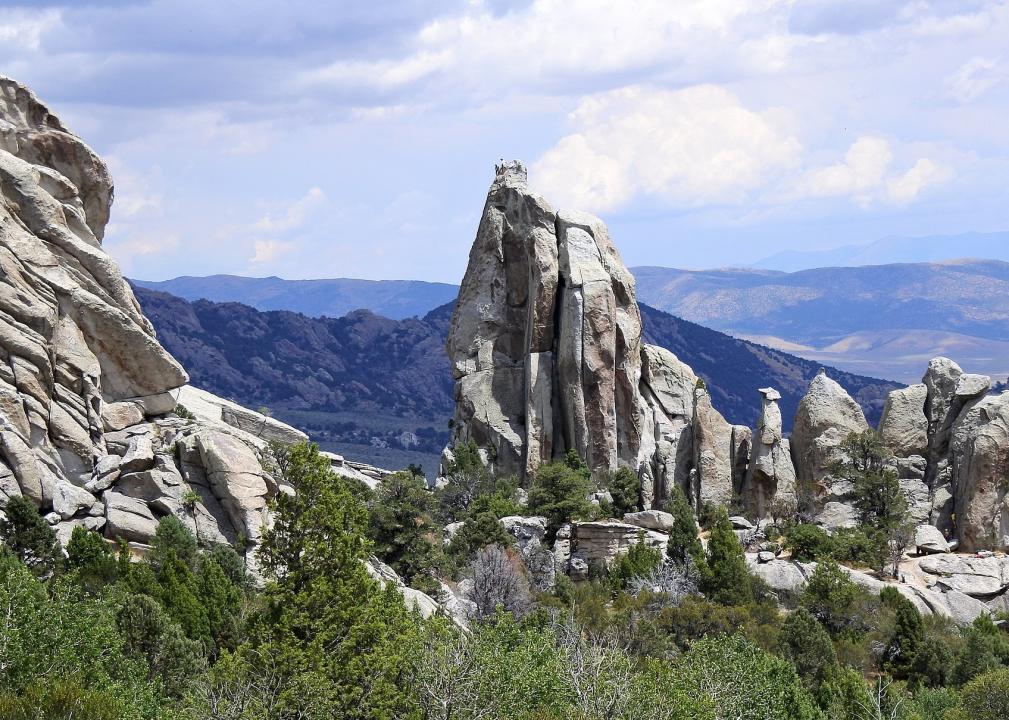
Tricia Simpson // Wikimedia Commons
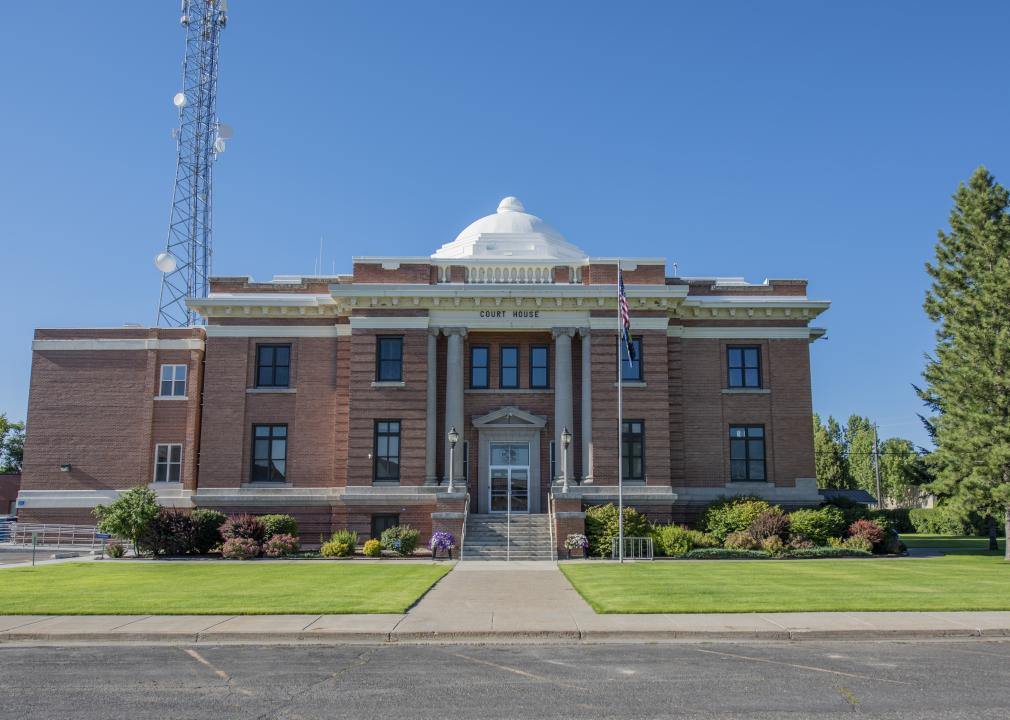
#41. Oneida County
– Index: 0.041
– Total population: 4,385
– White: 97.9% (4,293)
– Black or African American: 0.1% (5)
– American Indian and Alaska Native: 0.2% (7)
– Asian: 0.0% (0)
– Native Hawaiian and other Pacific Islander: 0.0% (0)
– 2 or more races: 1.8% (80)
– Some other Race: 0.0% (0)
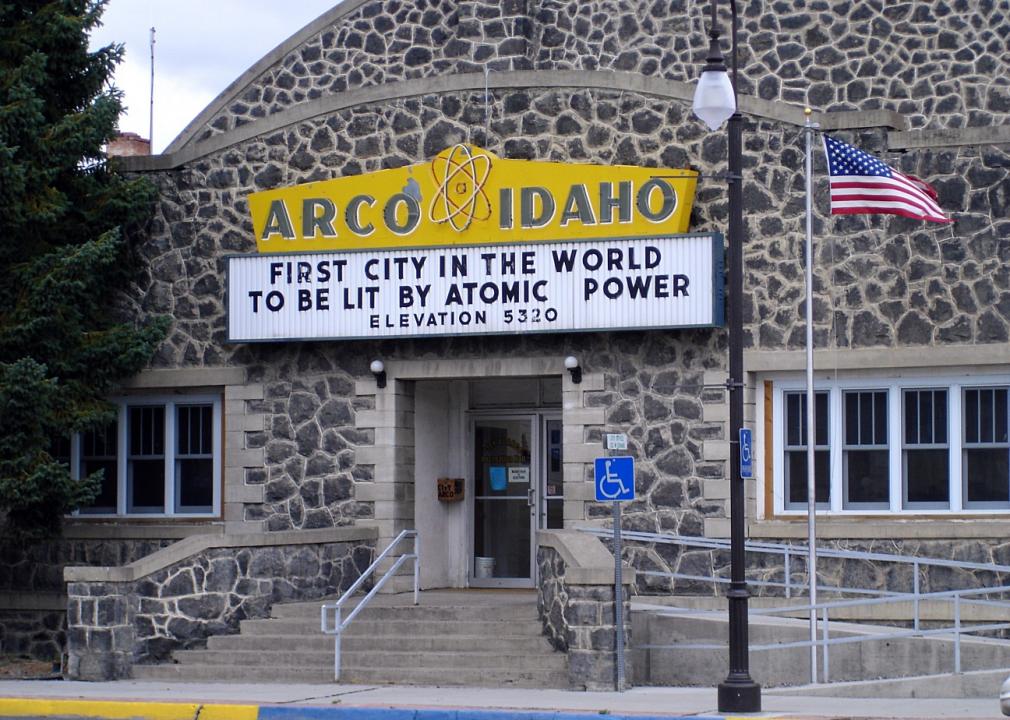
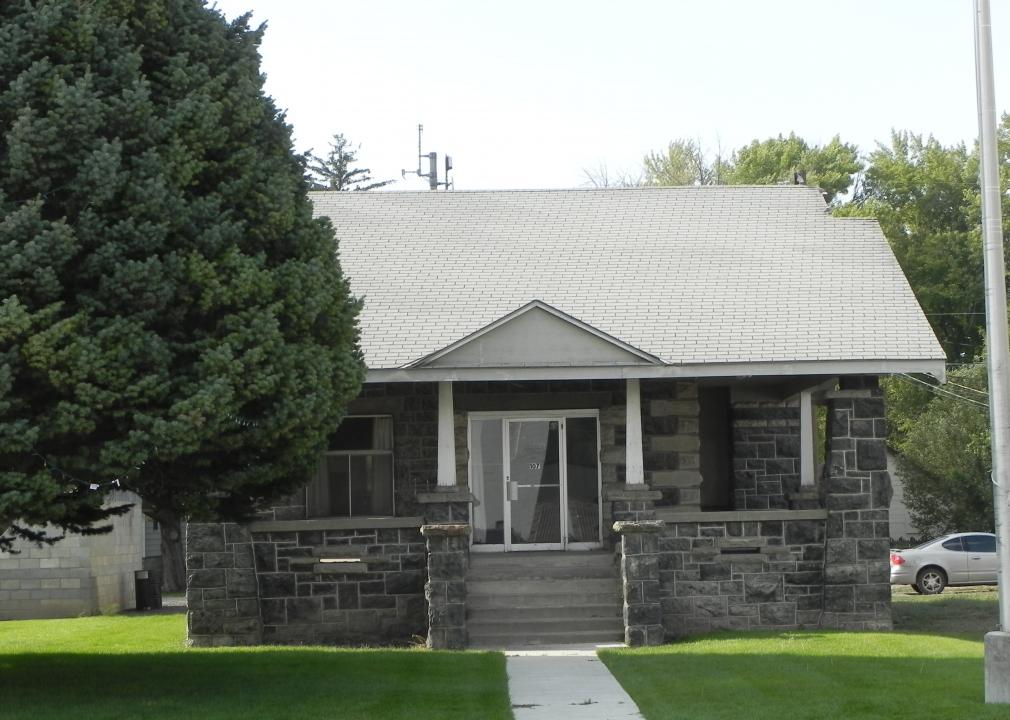
Ken L. // Wikimedia Commons
#40. Adams County
– Index: 0.088
– Total population: 4,097
– White: 95.5% (3,911)
– Black or African American: 0.4% (16)
– American Indian and Alaska Native: 1.8% (72)
– Asian: 0.0% (0)
– Native Hawaiian and other Pacific Islander: 0.2% (8)
– 2 or more races: 2.0% (80)
– Some other Race: 0.2% (10)
You may also like: Fastest-growing counties in Idaho
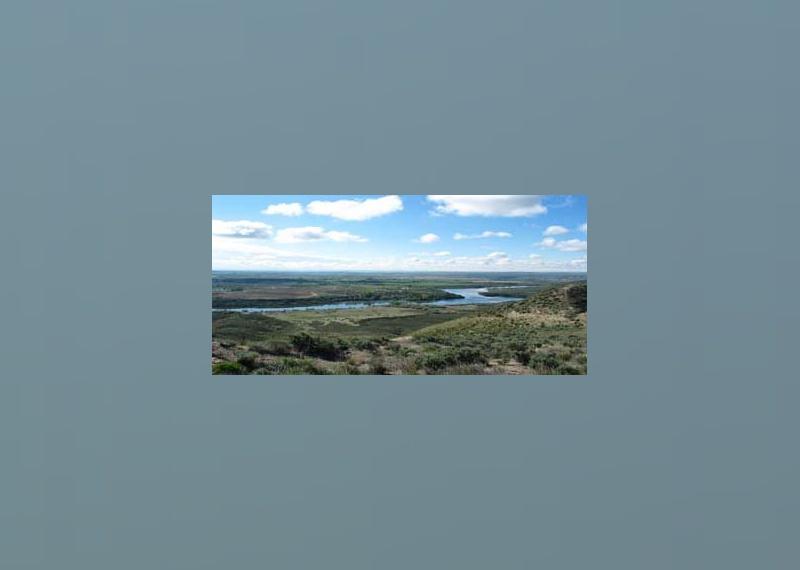
Dschwen // Wikimedia Commons
#39. Caribou County
– Index: 0.088
– Total population: 6,953
– White: 95.4% (6,636)
– Black or African American: 0.0% (0)
– American Indian and Alaska Native: 0.2% (11)
– Asian: 0.1% (4)
– Native Hawaiian and other Pacific Islander: 0.0% (0)
– 2 or more races: 2.3% (163)
– Some other Race: 2.0% (139)
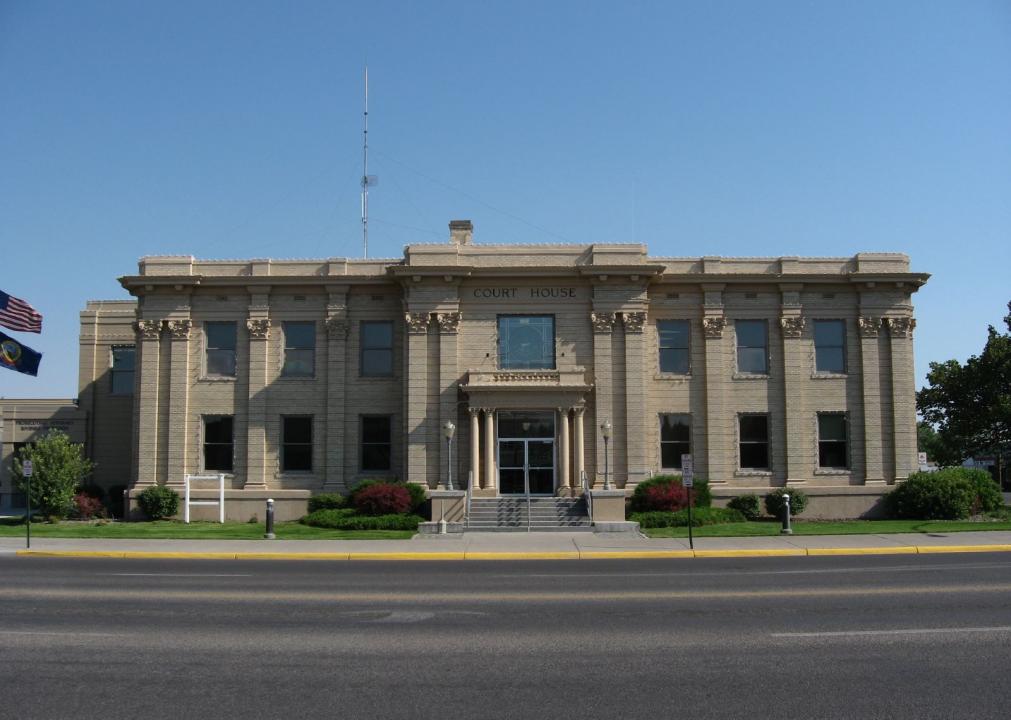
PdxCobra // Wikimedia Commons
#38. Boise County
– Index: 0.095
– Total population: 7,378
– White: 95.1% (7,016)
– Black or African American: 0.3% (19)
– American Indian and Alaska Native: 0.4% (32)
– Asian: 1.0% (71)
– Native Hawaiian and other Pacific Islander: 0.1% (5)
– 2 or more races: 2.9% (212)
– Some other Race: 0.3% (23)
L’Aquatique // Wikimedia Commons
#37. Bonner County
– Index: 0.096
– Total population: 43,611
– White: 95.0% (41,441)
– Black or African American: 0.3% (127)
– American Indian and Alaska Native: 0.9% (378)
– Asian: 0.7% (298)
– Native Hawaiian and other Pacific Islander: 0.1% (53)
– 2 or more races: 2.4% (1,066)
– Some other Race: 0.6% (248)
Aualliso // Wikimedia Commons
#36. Fremont County
– Index: 0.101
– Total population: 13,020
– White: 94.8% (12,342)
– Black or African American: 0.2% (22)
– American Indian and Alaska Native: 0.1% (18)
– Asian: 0.2% (24)
– Native Hawaiian and other Pacific Islander: 0.6% (82)
– 2 or more races: 2.3% (298)
– Some other Race: 1.8% (234)
Greg L. Wright // Wikimedia Commons
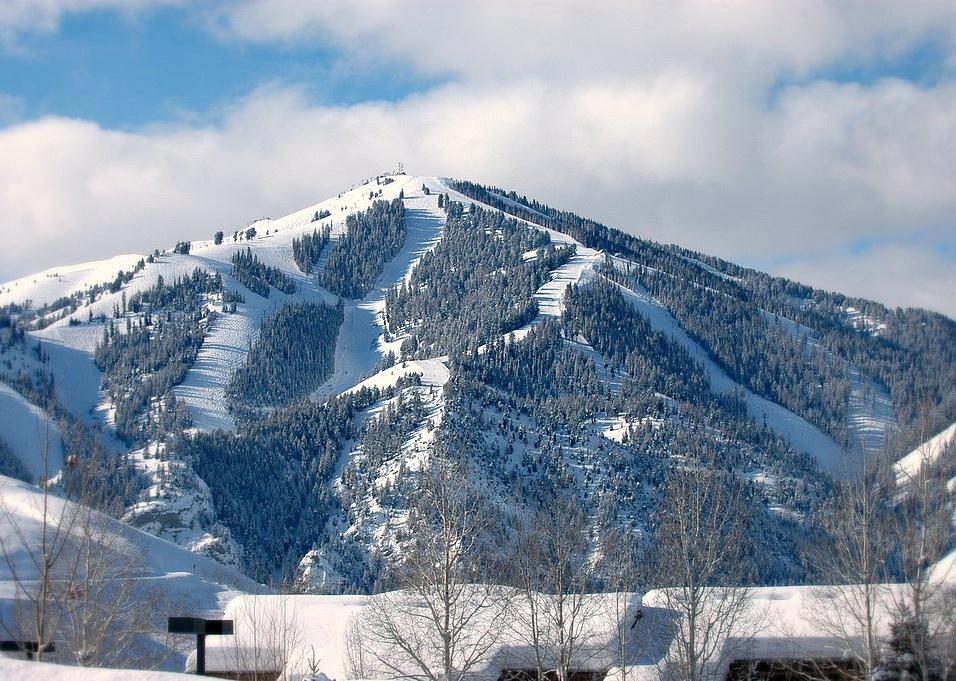
#35. Blaine County
– Index: 0.101
– Total population: 22,373
– White: 94.8% (21,206)
– Black or African American: 0.4% (98)
– American Indian and Alaska Native: 0.7% (159)
– Asian: 1.1% (237)
– Native Hawaiian and other Pacific Islander: 0.2% (38)
– 2 or more races: 1.6% (359)
– Some other Race: 1.2% (276)
You may also like: Counties with the most super commuters in Idaho
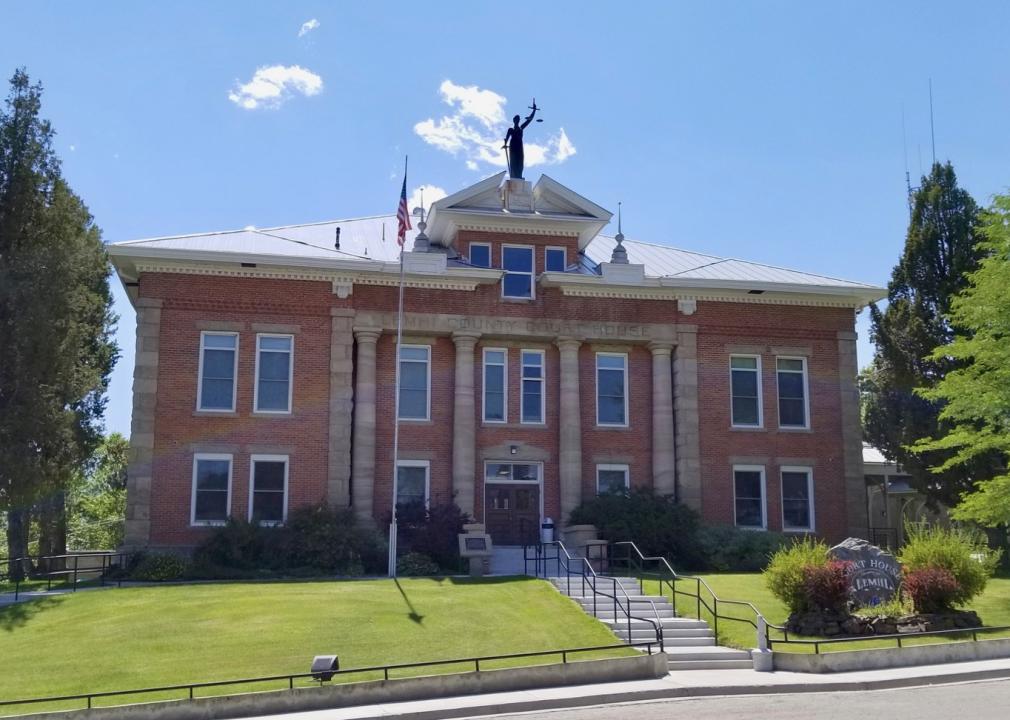
John Stanton // Wikimedia Commons
#34. Lemhi County
– Index: 0.102
– Total population: 7,847
– White: 94.7% (7,430)
– Black or African American: 0.0% (3)
– American Indian and Alaska Native: 0.5% (40)
– Asian: 0.0% (0)
– Native Hawaiian and other Pacific Islander: 0.1% (8)
– 2 or more races: 3.9% (307)
– Some other Race: 0.8% (59)
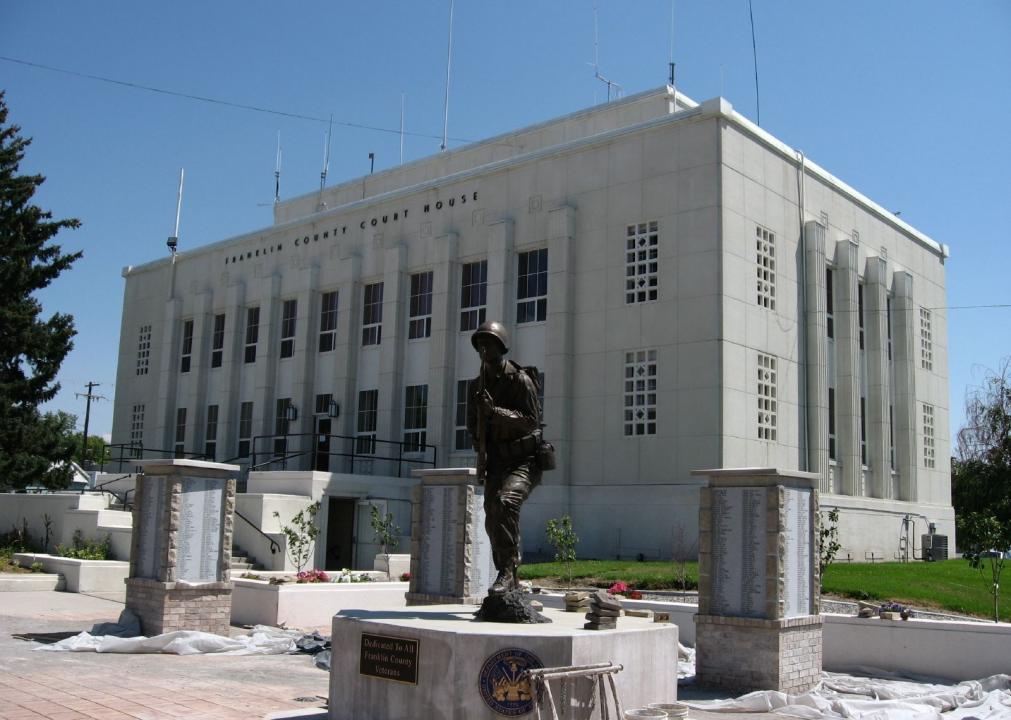
Ken L. // Wikimedia Commons
#33. Franklin County
– Index: 0.103
– Total population: 13,464
– White: 94.7% (12,748)
– Black or African American: 0.3% (35)
– American Indian and Alaska Native: 0.9% (115)
– Asian: 0.1% (20)
– Native Hawaiian and other Pacific Islander: 0.0% (2)
– 2 or more races: 1.9% (257)
– Some other Race: 2.1% (287)
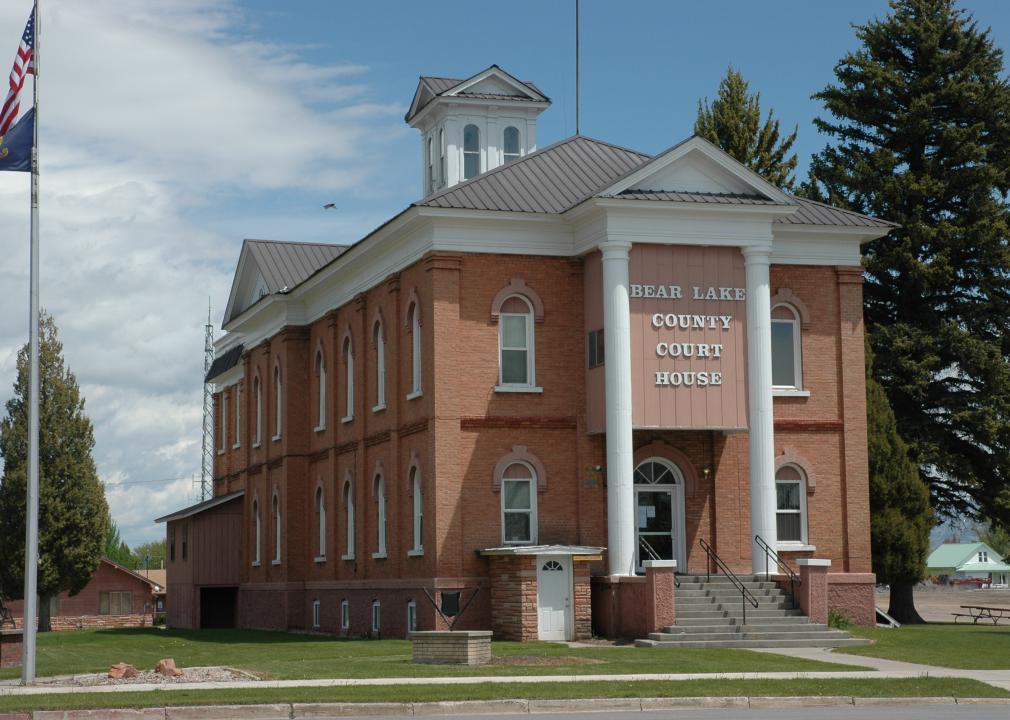
Tricia Simpson // Wikimedia Commons
#32. Bear Lake County
– Index: 0.110
– Total population: 6,000
– White: 94.3% (5,659)
– Black or African American: 0.9% (53)
– American Indian and Alaska Native: 1.1% (68)
– Asian: 0.7% (40)
– Native Hawaiian and other Pacific Islander: 0.0% (0)
– 2 or more races: 1.1% (66)
– Some other Race: 1.9% (114)
Federal Highway Administration // Wikimedia Commons
#31. Boundary County
– Index: 0.114
– Total population: 11,845
– White: 94.1% (11,145)
– Black or African American: 0.5% (63)
– American Indian and Alaska Native: 1.4% (161)
– Asian: 1.2% (144)
– Native Hawaiian and other Pacific Islander: 0.5% (65)
– 2 or more races: 1.6% (187)
– Some other Race: 0.7% (80)
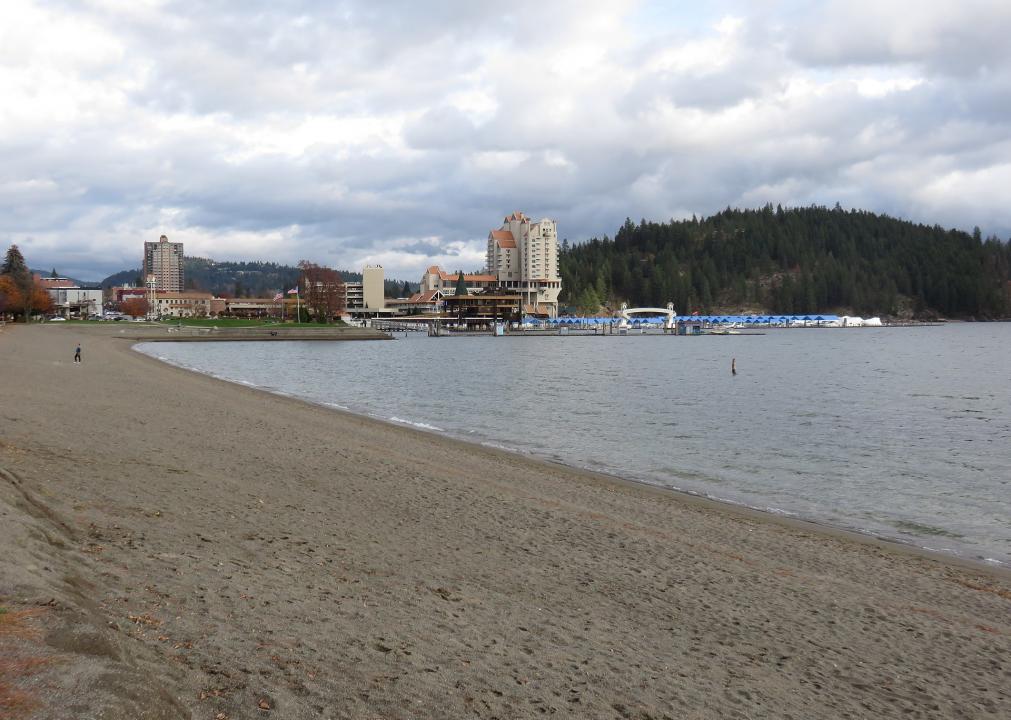
Antony-22 // Wikimedia Commons
#30. Kootenai County
– Index: 0.115
– Total population: 157,322
– White: 94.0% (147,874)
– Black or African American: 0.3% (494)
– American Indian and Alaska Native: 1.4% (2,138)
– Asian: 0.9% (1,433)
– Native Hawaiian and other Pacific Islander: 0.1% (171)
– 2 or more races: 2.8% (4,402)
– Some other Race: 0.5% (810)
You may also like: States sending the most people to Idaho
Ken L. // Wikimedia Commons
#29. Minidoka County
– Index: 0.123
– Total population: 20,705
– White: 93.6% (19,373)
– Black or African American: 0.2% (32)
– American Indian and Alaska Native: 1.3% (267)
– Asian: 0.3% (55)
– Native Hawaiian and other Pacific Islander: 0.1% (25)
– 2 or more races: 1.3% (278)
– Some other Race: 3.3% (675)
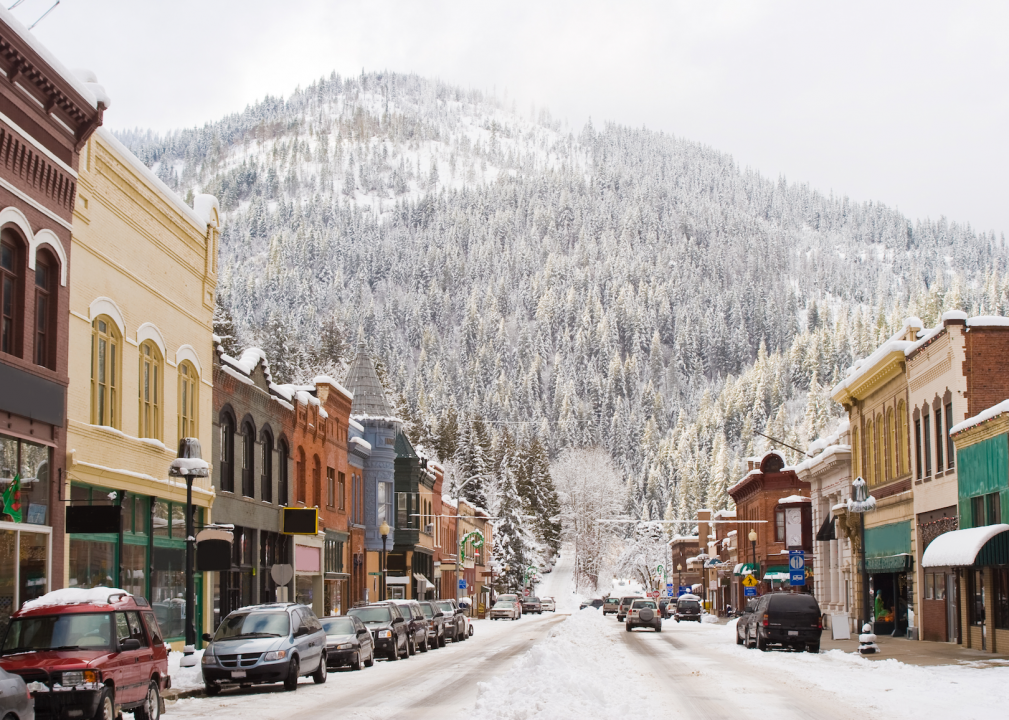
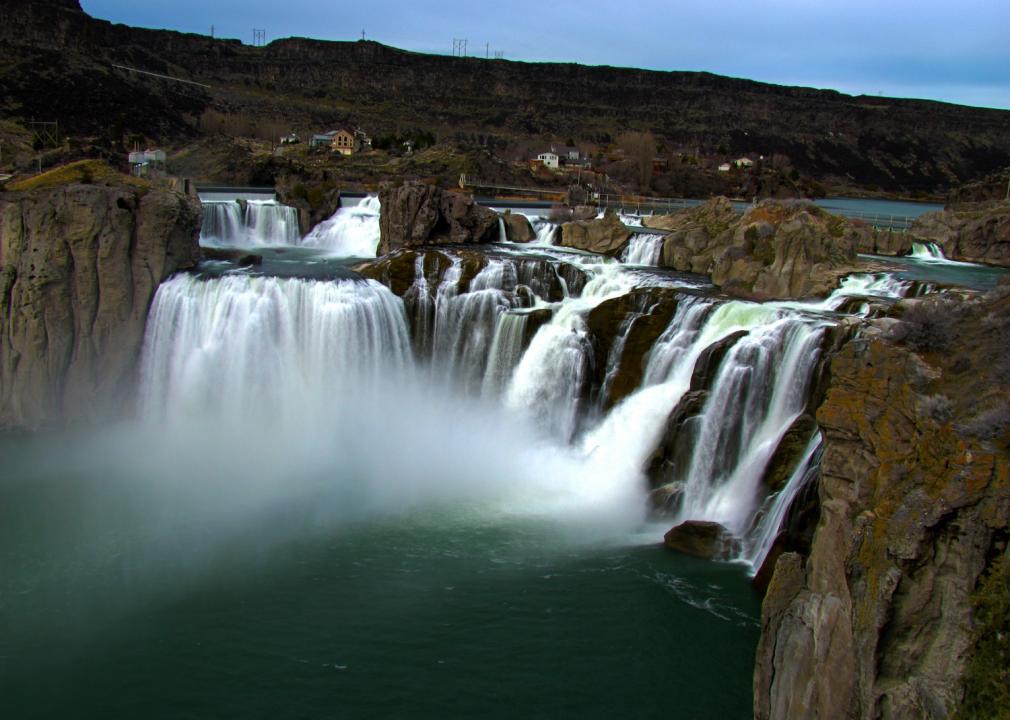
jfergusonphotos // Shutterstock
#28. Shoshone County
– Index: 0.124
– Total population: 12,609
– White: 93.5% (11,792)
– Black or African American: 0.3% (43)
– American Indian and Alaska Native: 3.1% (393)
– Asian: 0.1% (12)
– Native Hawaiian and other Pacific Islander: 0.0% (0)
– 2 or more races: 2.6% (324)
– Some other Race: 0.4% (45)
Larry D. Moore // Wikimedia Commons
#27. Jerome County
– Index: 0.127
– Total population: 23,730
– White: 93.4% (22,161)
– Black or African American: 0.2% (41)
– American Indian and Alaska Native: 0.7% (174)
– Asian: 1.0% (227)
– Native Hawaiian and other Pacific Islander: 0.4% (106)
– 2 or more races: 1.7% (408)
– Some other Race: 2.6% (613)
Forest Service Northern Region from Missoula, MT, USA // Wikimedia Commons
#26. Idaho County
– Index: 0.127
– Total population: 16,411
– White: 93.3% (15,319)
– Black or African American: 0.1% (23)
– American Indian and Alaska Native: 4.0% (649)
– Asian: 0.4% (66)
– Native Hawaiian and other Pacific Islander: 0.0% (3)
– 2 or more races: 1.5% (253)
– Some other Race: 0.6% (98)
wilson44691 // Wikimedia Commons
#25. Cassia County
– Index: 0.131
– Total population: 23,690
– White: 93.1% (22,067)
– Black or African American: 0.2% (52)
– American Indian and Alaska Native: 1.2% (277)
– Asian: 0.6% (139)
– Native Hawaiian and other Pacific Islander: 0.1% (14)
– 2 or more races: 1.4% (322)
– Some other Race: 3.5% (819)
You may also like: Counties with the oldest homes in Idaho
Tom Young // Wikimedia Commons
#24. Lincoln County
– Index: 0.132
– Total population: 5,350
– White: 93.0% (4,978)
– Black or African American: 0.0% (0)
– American Indian and Alaska Native: 0.6% (32)
– Asian: 0.4% (22)
– Native Hawaiian and other Pacific Islander: 0.0% (0)
– 2 or more races: 2.8% (148)
– Some other Race: 3.2% (170)
NPS photo // Wikimedia Commons
#23. Gooding County
– Index: 0.133
– Total population: 15,148
– White: 93.0% (14,091)
– Black or African American: 0.1% (13)
– American Indian and Alaska Native: 0.5% (69)
– Asian: 0.9% (139)
– Native Hawaiian and other Pacific Islander: 0.2% (36)
– 2 or more races: 2.5% (383)
– Some other Race: 2.8% (417)
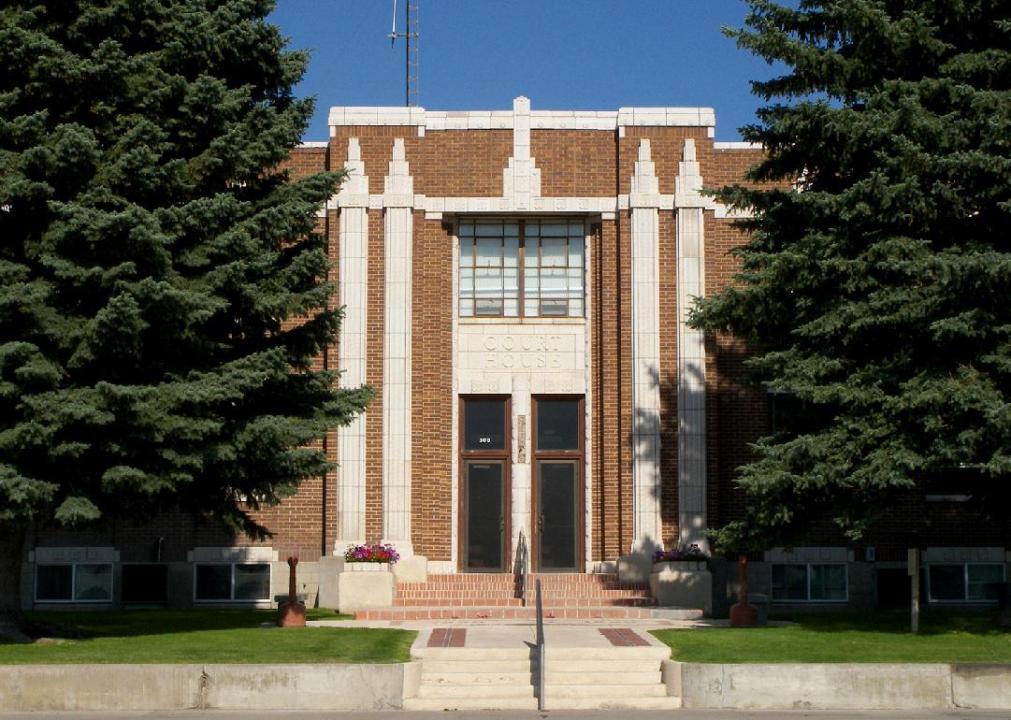
Ken L. // Wikimedia Commons
#22. Madison County
– Index: 0.137
– Total population: 39,100
– White: 92.8% (36,286)
– Black or African American: 0.2% (65)
– American Indian and Alaska Native: 0.1% (57)
– Asian: 1.6% (610)
– Native Hawaiian and other Pacific Islander: 0.2% (94)
– 2 or more races: 2.9% (1,146)
– Some other Race: 2.2% (842)
![]()
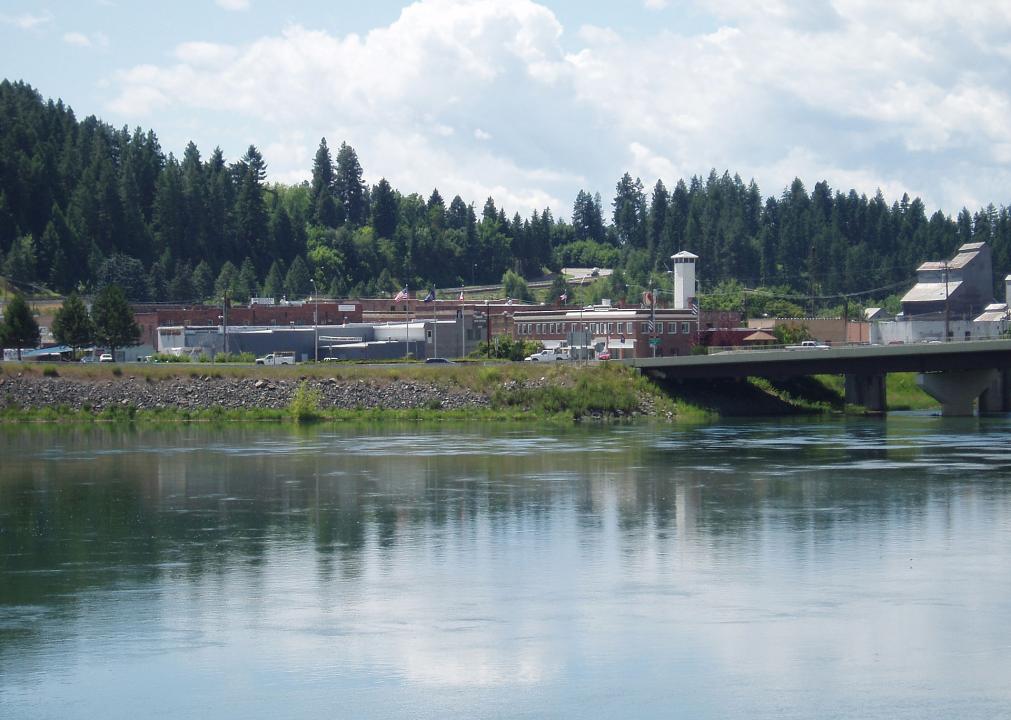
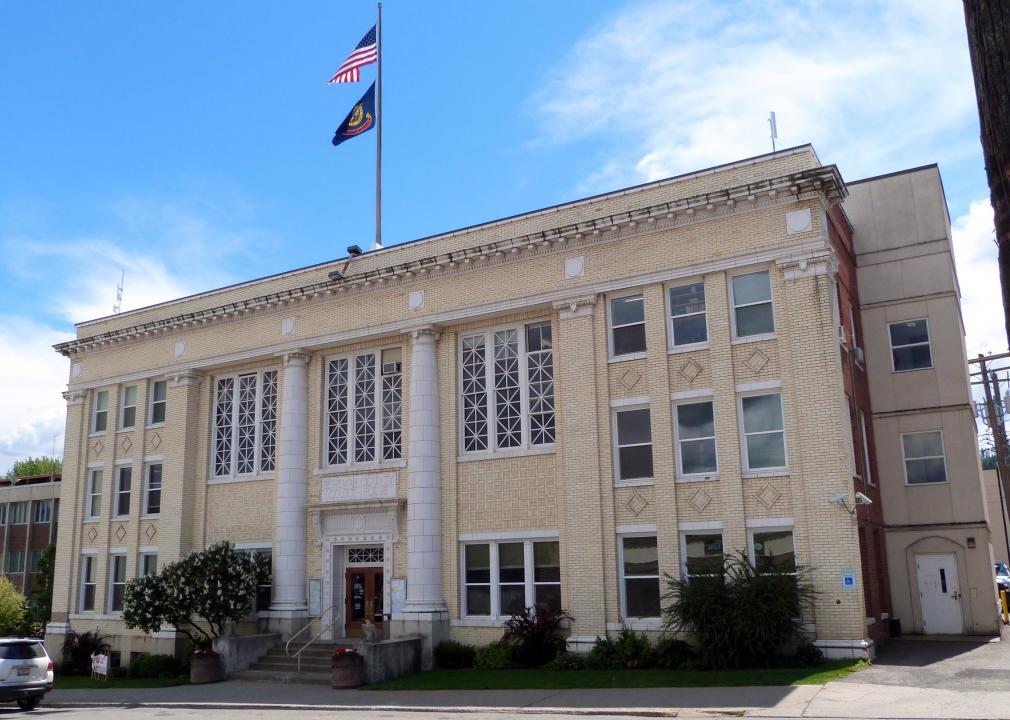
Jon Roanhaus // Wikimedia Commons
#21. Clearwater County
– Index: 0.139
– Total population: 8,673
– White: 92.7% (8,040)
– Black or African American: 0.5% (46)
– American Indian and Alaska Native: 2.2% (191)
– Asian: 0.4% (35)
– Native Hawaiian and other Pacific Islander: 0.2% (20)
– 2 or more races: 2.5% (220)
– Some other Race: 1.4% (121)
Apstrinka // Wikimedia Commons
#20. Latah County
– Index: 0.153
– Total population: 39,505
– White: 92.0% (36,325)
– Black or African American: 1.2% (462)
– American Indian and Alaska Native: 1.3% (531)
– Asian: 2.3% (915)
– Native Hawaiian and other Pacific Islander: 0.1% (20)
– 2 or more races: 2.6% (1,040)
– Some other Race: 0.5% (212)
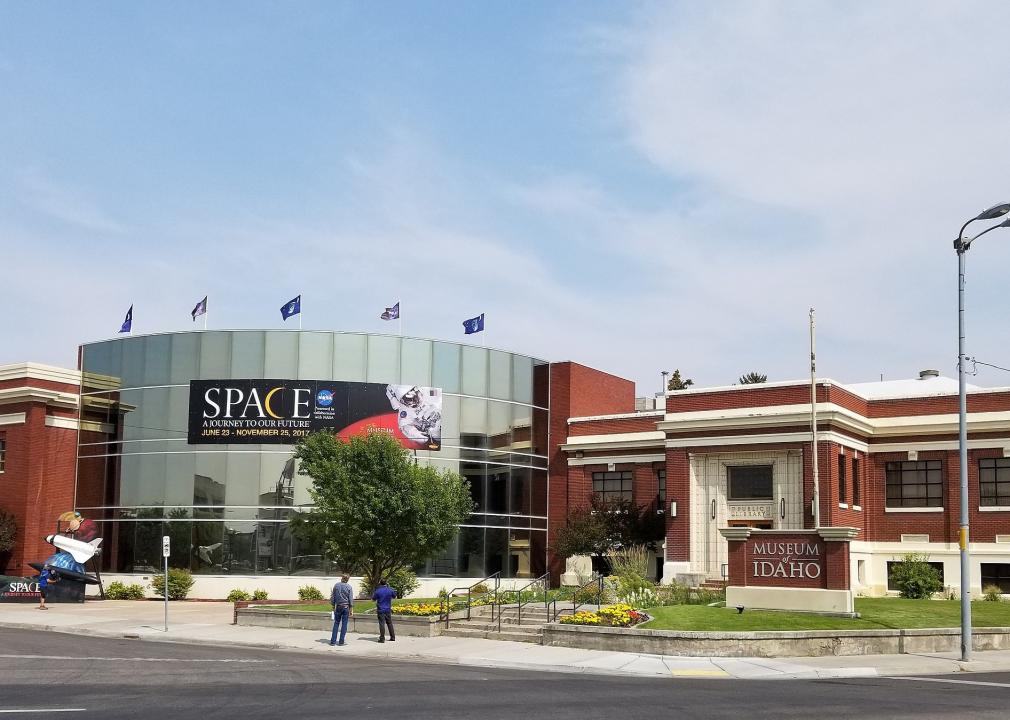
You may also like: Highest-rated specialty museums in Idaho, according to Tripadvisor
Karthikc123 // Wikimedia Commons
#19. Twin Falls County
– Index: 0.155
– Total population: 84,869
– White: 91.8% (77,944)
– Black or African American: 0.8% (689)
– American Indian and Alaska Native: 0.7% (605)
– Asian: 1.8% (1,562)
– Native Hawaiian and other Pacific Islander: 0.1% (45)
– 2 or more races: 1.9% (1,622)
– Some other Race: 2.8% (2,402)
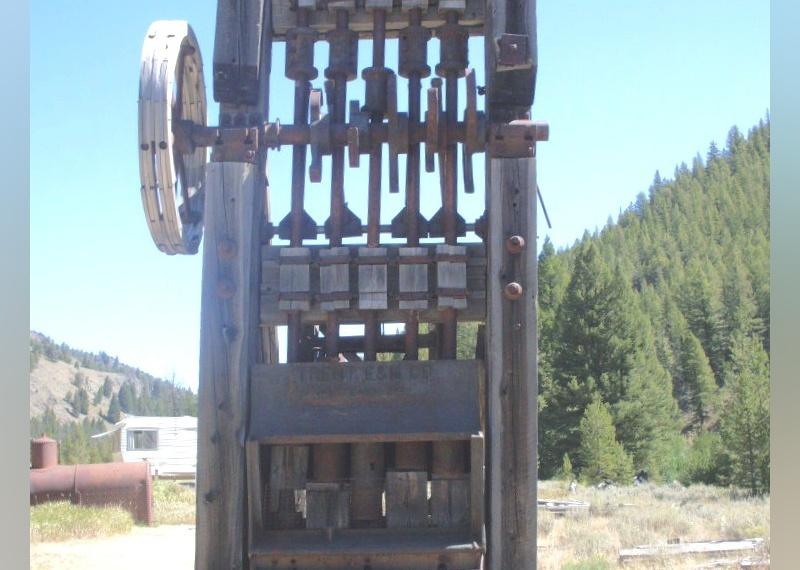
tinosa // Wikimedia Commons
#18. Custer County
– Index: 0.162
– Total population: 4,169
– White: 91.3% (3,807)
– Black or African American: 0.1% (5)
– American Indian and Alaska Native: 1.1% (46)
– Asian: 0.0% (0)
– Native Hawaiian and other Pacific Islander: 0.0% (0)
– 2 or more races: 6.4% (266)
– Some other Race: 1.1% (45)
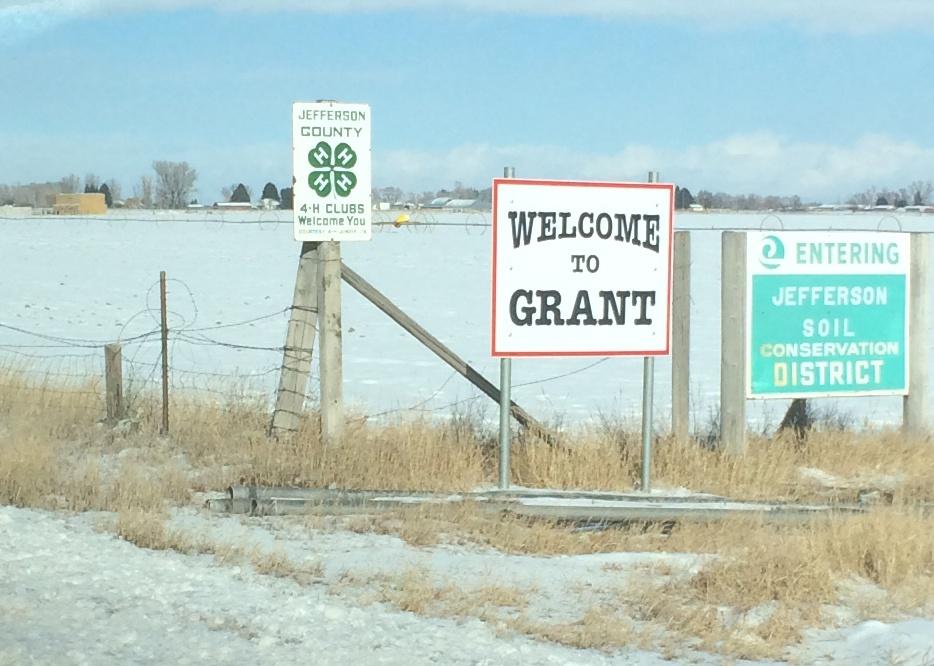
Bathlander // Wikimedia Commons
#17. Jefferson County
– Index: 0.164
– Total population: 28,534
– White: 91.3% (26,039)
– Black or African American: 0.0% (0)
– American Indian and Alaska Native: 1.2% (350)
– Asian: 0.4% (127)
– Native Hawaiian and other Pacific Islander: 0.0% (14)
– 2 or more races: 1.7% (472)
– Some other Race: 5.4% (1,532)
Charles Knowles // Shutterstock
#16. Ada County
– Index: 0.179
– Total population: 456,849
– White: 90.5% (413,350)
– Black or African American: 1.4% (6,274)
– American Indian and Alaska Native: 0.5% (2,407)
– Asian: 2.5% (11,617)
– Native Hawaiian and other Pacific Islander: 0.2% (839)
– 2 or more races: 3.4% (15,397)
– Some other Race: 1.5% (6,965)
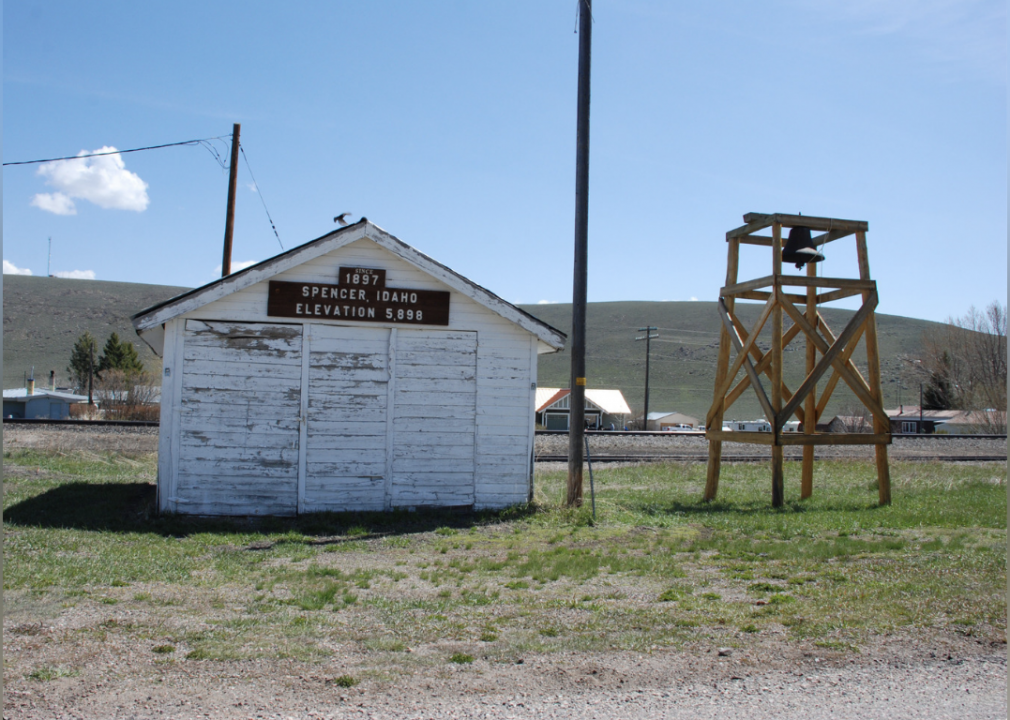
Kristen Taylor // Wikimedia Commons
#15. Clark County
– Index: 0.180
– Total population: 913
– White: 90.4% (825)
– Black or African American: 0.8% (7)
– American Indian and Alaska Native: 4.6% (42)
– Asian: 0.0% (0)
– Native Hawaiian and other Pacific Islander: 0.0% (0)
– 2 or more races: 0.0% (0)
– Some other Race: 4.3% (39)
You may also like: Highest-rated Class of 2021 football recruits from Idaho
John D // Wikimedia Commons
#14. Gem County
– Index: 0.185
– Total population: 17,331
– White: 90.1% (15,611)
– Black or African American: 0.1% (20)
– American Indian and Alaska Native: 1.4% (240)
– Asian: 0.6% (98)
– Native Hawaiian and other Pacific Islander: 0.0% (0)
– 2 or more races: 2.8% (484)
– Some other Race: 5.1% (878)
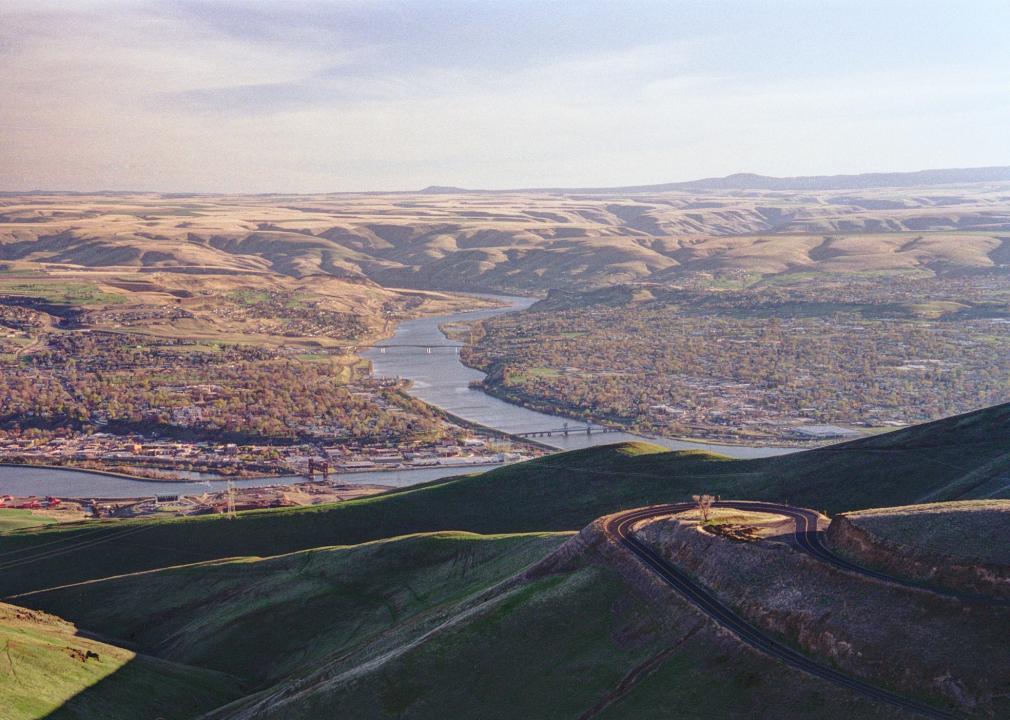
Dsdugan // Wikimedia Commons
#13. Nez Perce County
– Index: 0.192
– Total population: 40,217
– White: 89.6% (36,037)
– Black or African American: 0.4% (143)
– American Indian and Alaska Native: 6.1% (2,473)
– Asian: 0.8% (332)
– Native Hawaiian and other Pacific Islander: 0.0% (5)
– 2 or more races: 2.7% (1,079)
– Some other Race: 0.4% (148)
Jcarr29 // Wikimedia Commons
#12. Bonneville County
– Index: 0.196
– Total population: 114,392
– White: 89.5% (102,331)
– Black or African American: 0.5% (583)
– American Indian and Alaska Native: 0.4% (512)
– Asian: 1.0% (1,169)
– Native Hawaiian and other Pacific Islander: 0.1% (127)
– 2 or more races: 2.8% (3,147)
– Some other Race: 5.7% (6,523)
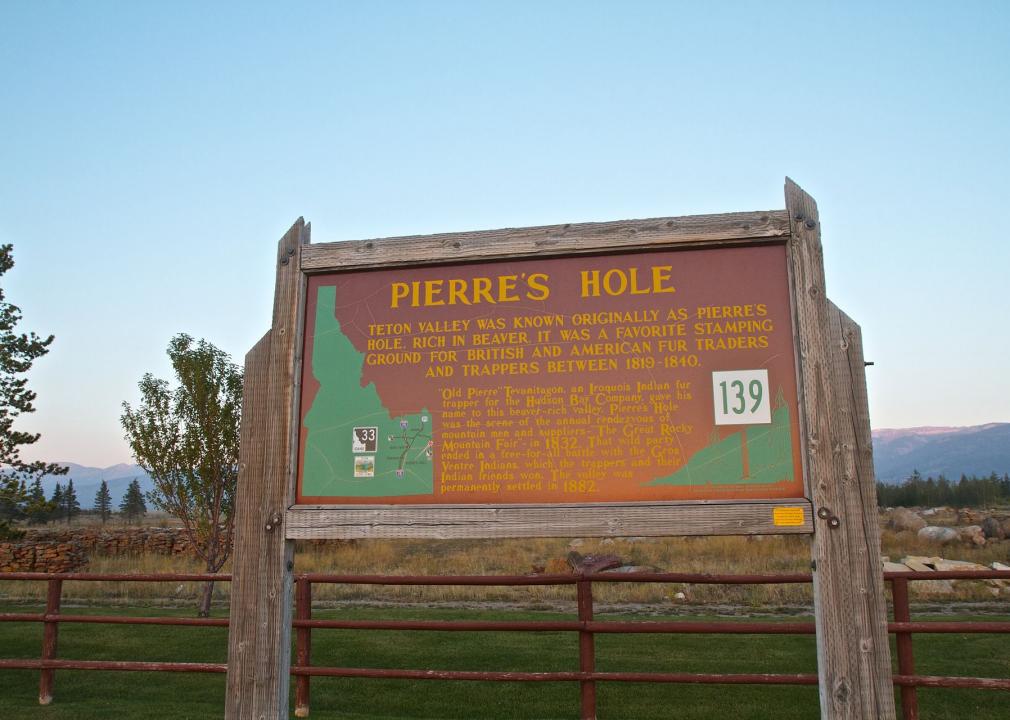
Lowjumpingfrog // Wikimedia Commons
#11. Teton County
– Index: 0.203
– Total population: 11,426
– White: 88.9% (10,153)
– Black or African American: 0.0% (0)
– American Indian and Alaska Native: 0.7% (83)
– Asian: 0.0% (0)
– Native Hawaiian and other Pacific Islander: 0.0% (0)
– 2 or more races: 2.1% (240)
– Some other Race: 8.3% (950)
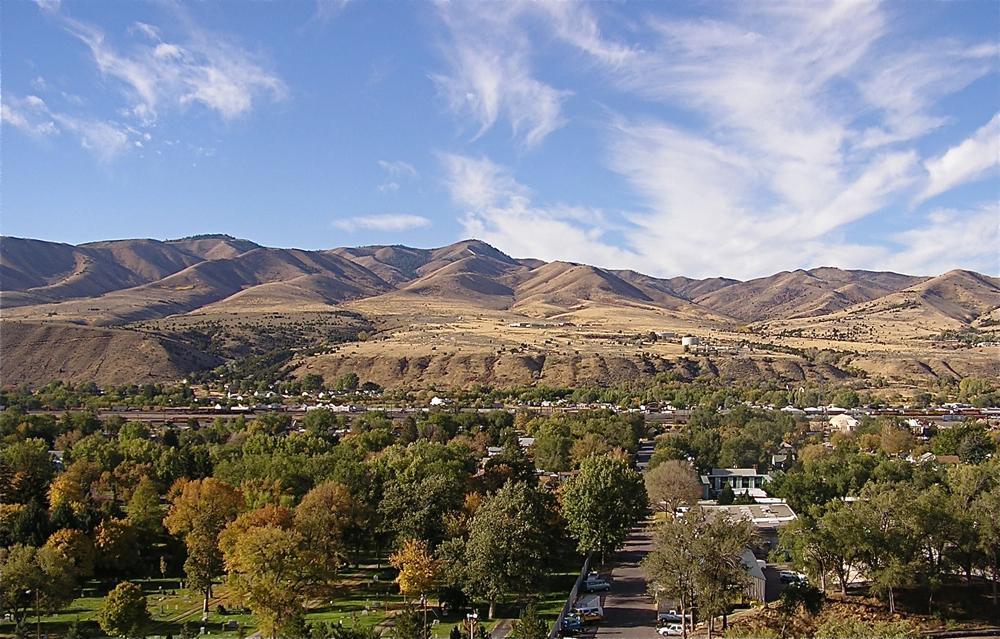
Michlaovic // Wikimedia
#10. Bannock County
– Index: 0.205
– Total population: 85,765
– White: 89.0% (76,327)
– Black or African American: 0.7% (603)
– American Indian and Alaska Native: 3.0% (2,536)
– Asian: 2.0% (1,688)
– Native Hawaiian and other Pacific Islander: 0.2% (158)
– 2 or more races: 3.2% (2,770)
– Some other Race: 2.0% (1,683)
You may also like: Recipes from Idaho
Ian Poellet // Wikimedia Commons
#9. Payette County
– Index: 0.221
– Total population: 23,260
– White: 87.9% (20,452)
– Black or African American: 0.1% (19)
– American Indian and Alaska Native: 0.6% (138)
– Asian: 1.0% (228)
– Native Hawaiian and other Pacific Islander: 0.1% (13)
– 2 or more races: 3.8% (876)
– Some other Race: 6.6% (1,534)
Sam Beebe // Wikimedia Commons
#8. Washington County
– Index: 0.222
– Total population: 10,057
– White: 87.8% (8,834)
– Black or African American: 0.2% (19)
– American Indian and Alaska Native: 1.0% (100)
– Asian: 0.4% (37)
– Native Hawaiian and other Pacific Islander: 0.0% (0)
– 2 or more races: 3.3% (329)
– Some other Race: 7.3% (738)
Ian Poellet // Wikimedia Commons
#7. Benewah County
– Index: 0.240
– Total population: 9,138
– White: 86.6% (7,916)
– Black or African American: 0.1% (6)
– American Indian and Alaska Native: 9.3% (853)
– Asian: 0.3% (29)
– Native Hawaiian and other Pacific Islander: 0.8% (71)
– 2 or more races: 2.7% (249)
– Some other Race: 0.2% (14)
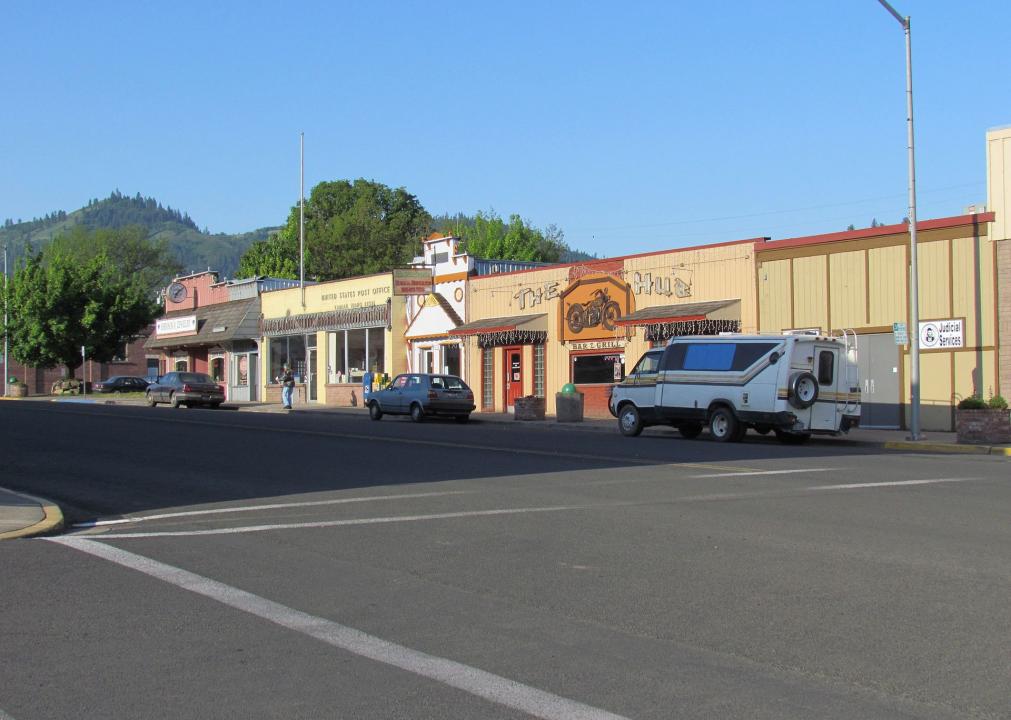
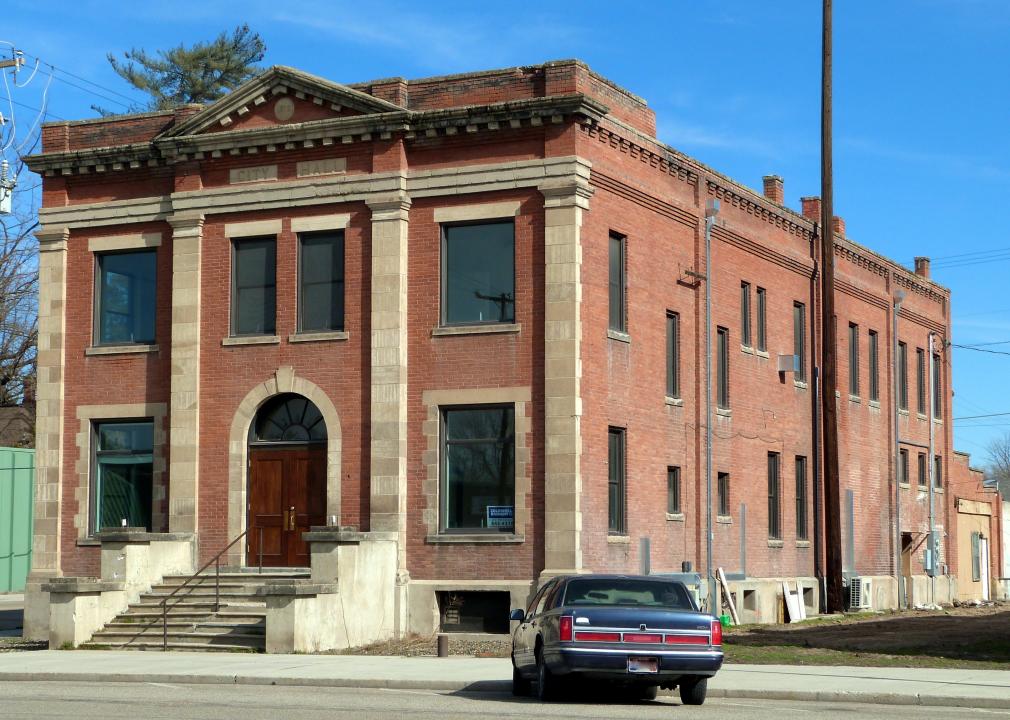
rustejunk // Wikimedia Commons
#6. Lewis County
– Index: 0.241
– Total population: 3,838
– White: 86.7% (3,327)
– Black or African American: 0.1% (5)
– American Indian and Alaska Native: 8.4% (321)
– Asian: 1.4% (53)
– Native Hawaiian and other Pacific Islander: 0.0% (1)
– 2 or more races: 2.8% (106)
– Some other Race: 0.7% (25)
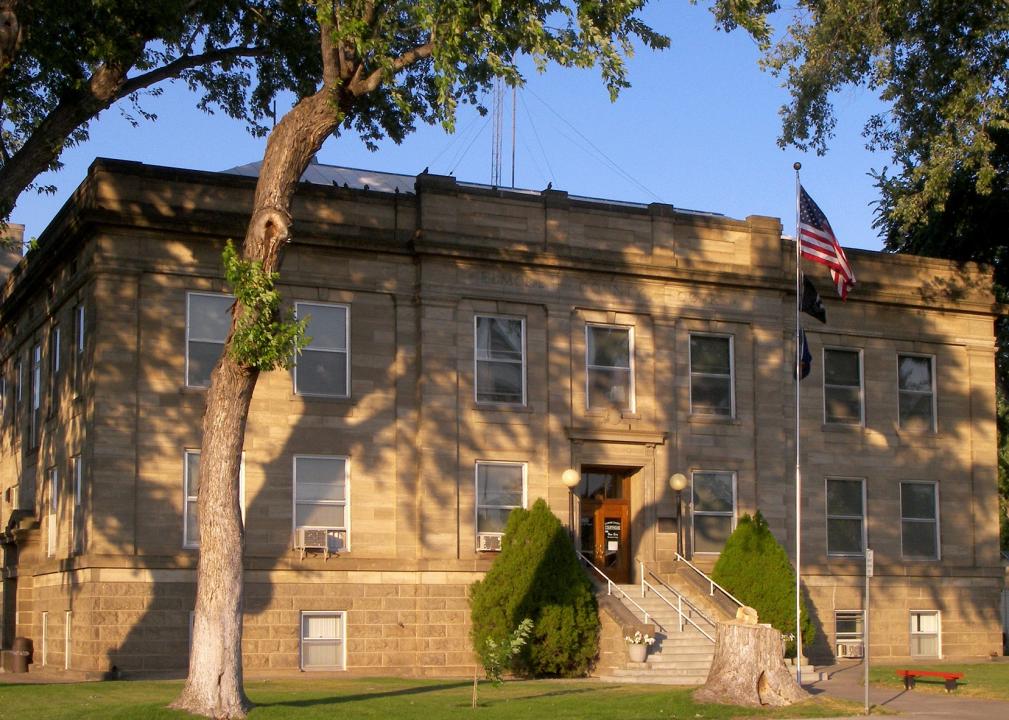
Larry D. Moore // Wikimedia Commons
#5. Elmore County
– Index: 0.271
– Total population: 26,743
– White: 85.1% (22,766)
– Black or African American: 2.7% (720)
– American Indian and Alaska Native: 2.1% (555)
– Asian: 2.6% (705)
– Native Hawaiian and other Pacific Islander: 0.4% (107)
– 2 or more races: 4.1% (1,087)
– Some other Race: 3.0% (803)
You may also like: Best places to retire in Idaho
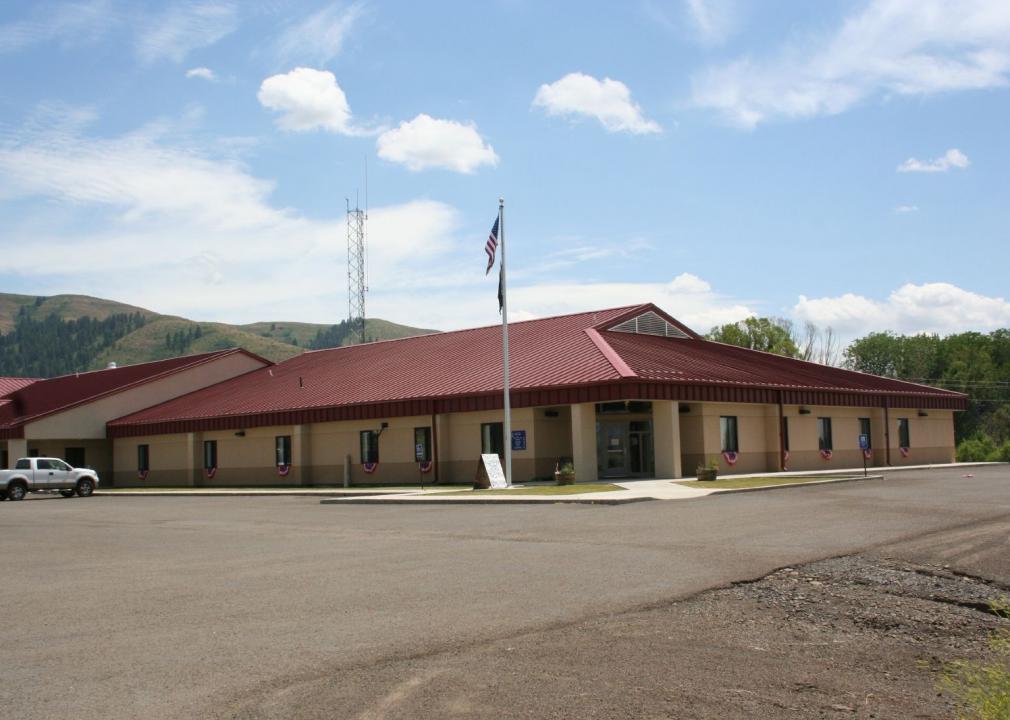
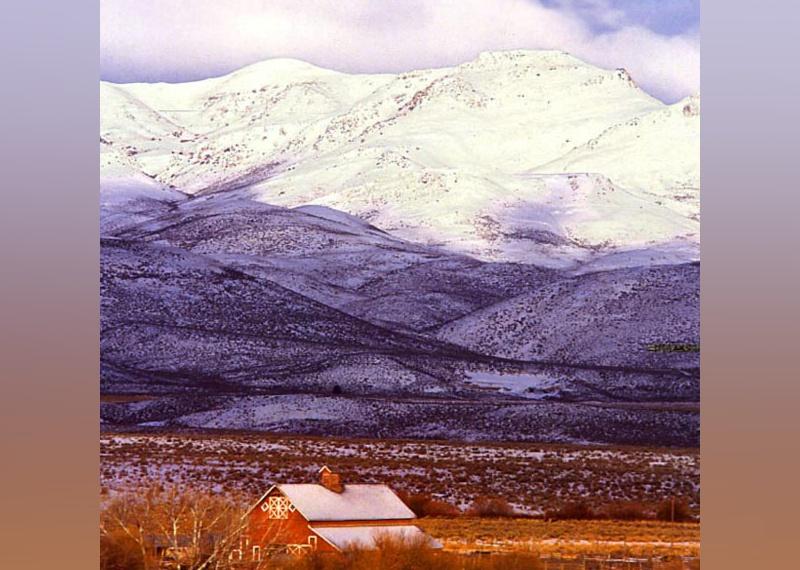
JERRYE & ROY KLOTZ MD // Wikimedia Commons
#4. Power County
– Index: 0.280
– Total population: 7,671
– White: 84.1% (6,448)
– Black or African American: 0.1% (6)
– American Indian and Alaska Native: 5.9% (449)
– Asian: 0.0% (0)
– Native Hawaiian and other Pacific Islander: 0.0% (3)
– 2 or more races: 0.2% (13)
– Some other Race: 9.8% (752)
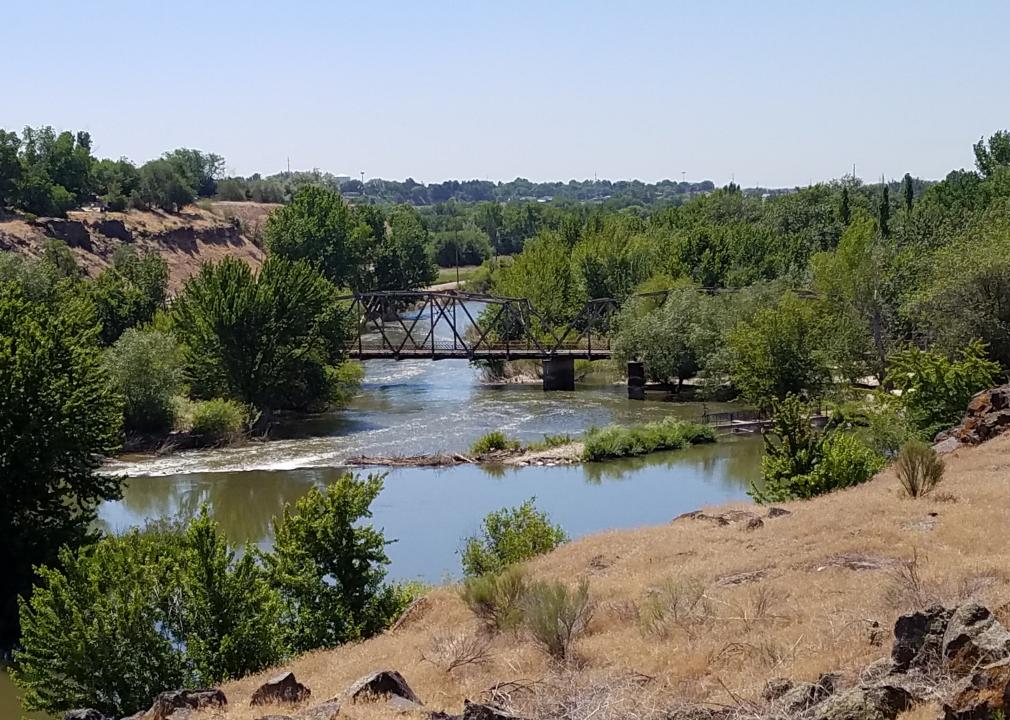
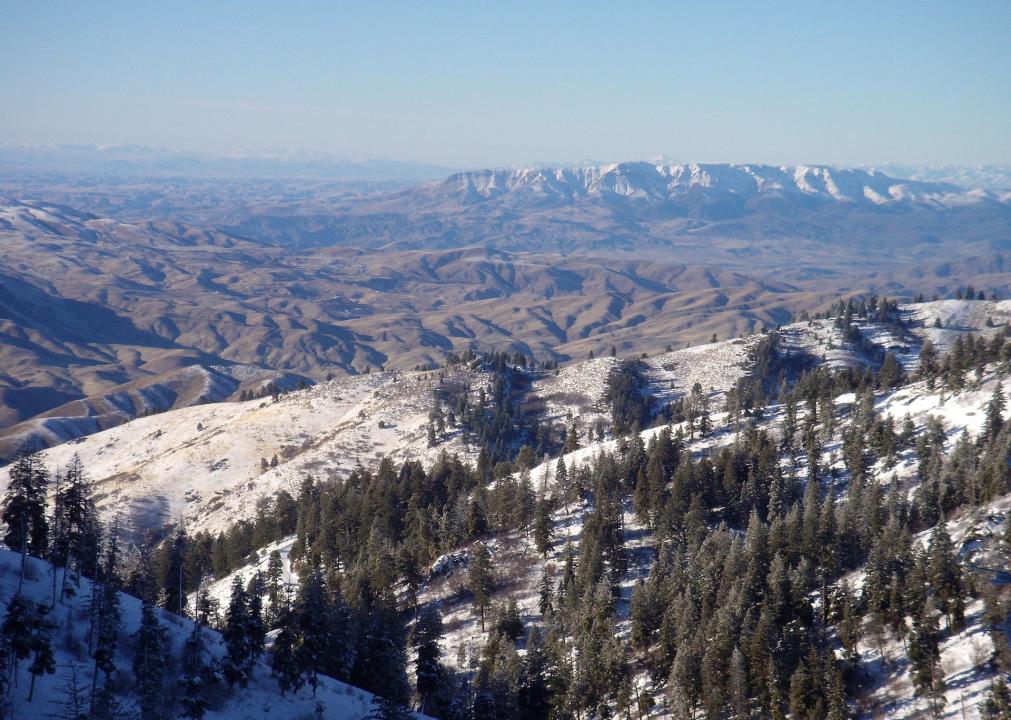
Tamanoeconomico // Wikimedia Commons
#3. Canyon County
– Index: 0.302
– Total population: 217,633
– White: 82.7% (180,081)
– Black or African American: 0.4% (893)
– American Indian and Alaska Native: 1.0% (2,257)
– Asian: 0.8% (1,846)
– Native Hawaiian and other Pacific Islander: 0.3% (598)
– 2 or more races: 3.9% (8,419)
– Some other Race: 10.8% (23,539)

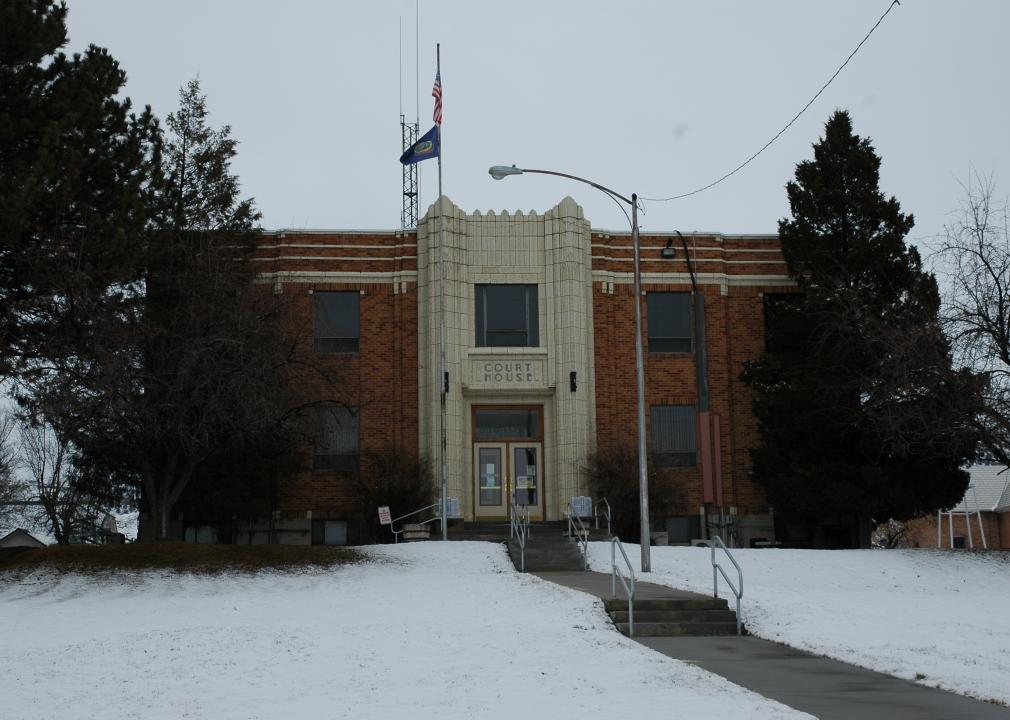
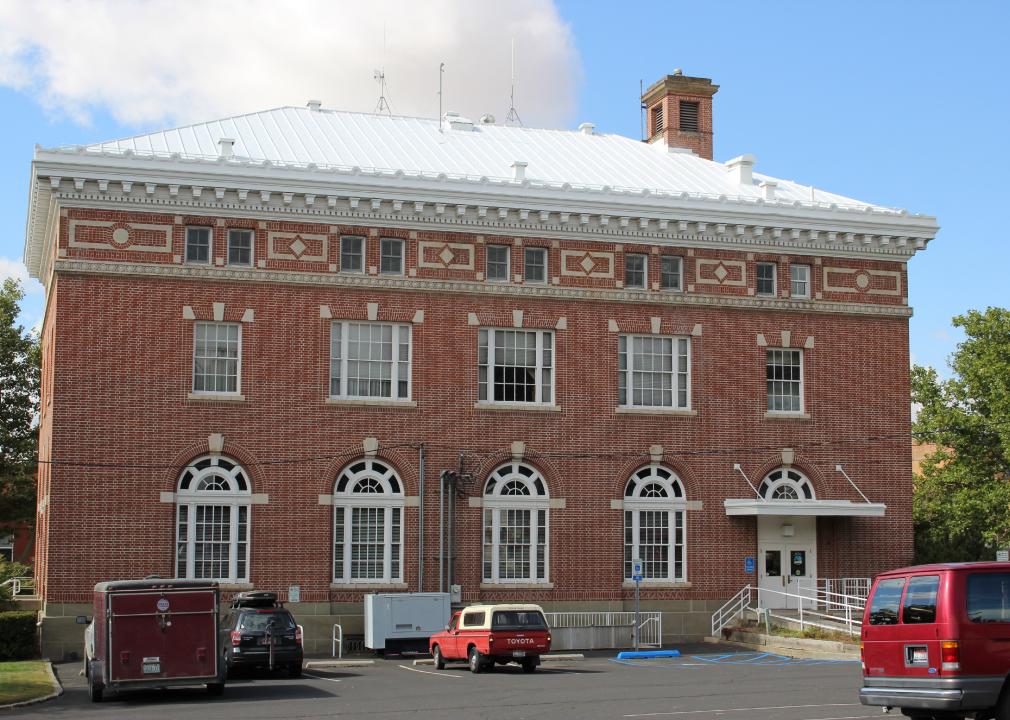
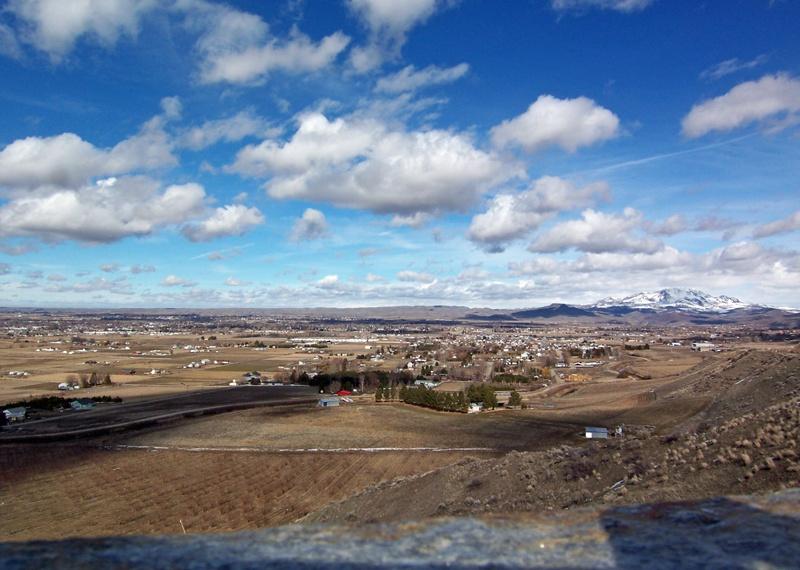
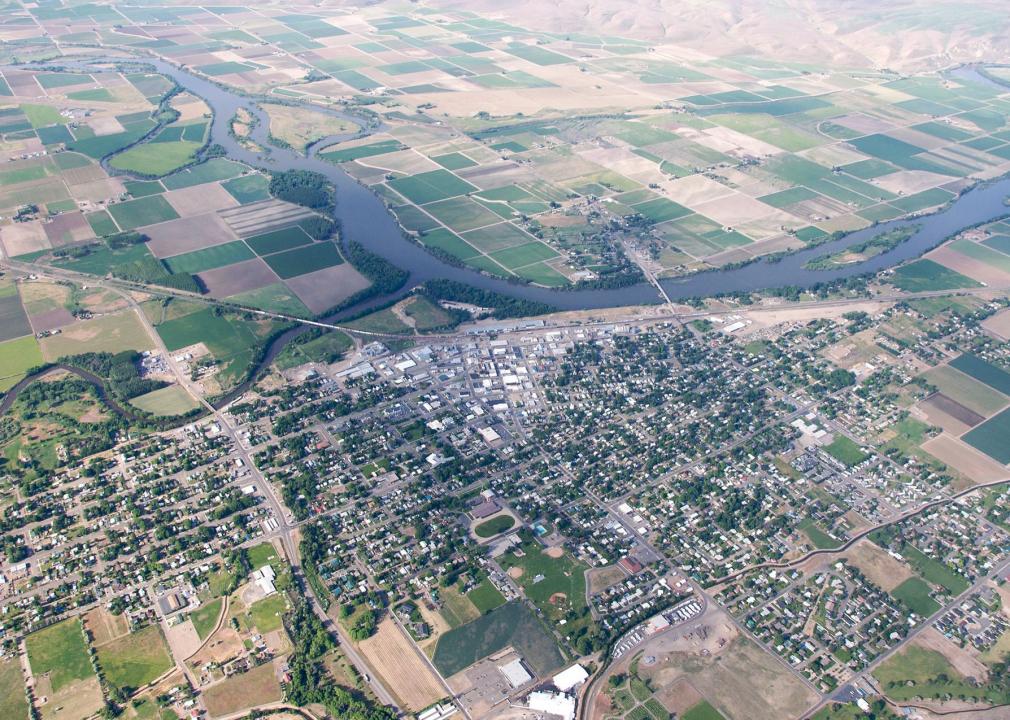
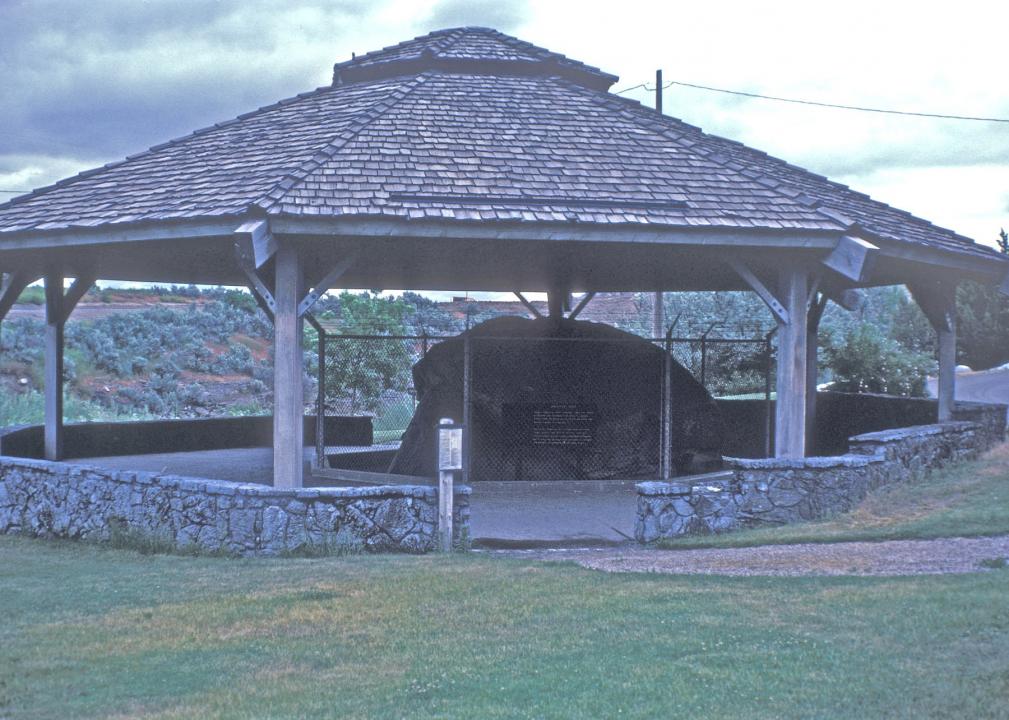
KRRK // Wikimedia Commons
#2. Bingham County
– Index: 0.313
– Total population: 45,839
– White: 82.2% (37,701)
– Black or African American: 0.3% (143)
– American Indian and Alaska Native: 6.4% (2,936)
– Asian: 0.6% (263)
– Native Hawaiian and other Pacific Islander: 0.1% (24)
– 2 or more races: 3.4% (1,575)
– Some other Race: 7.0% (3,197)
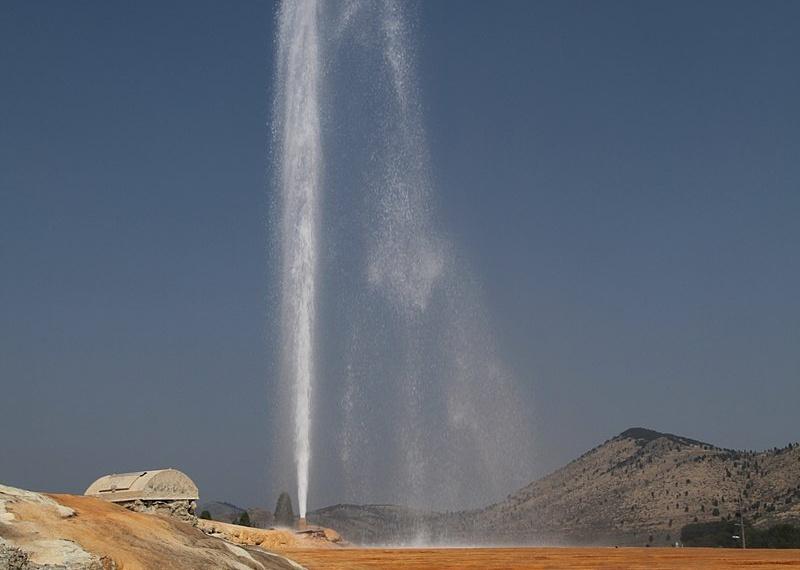
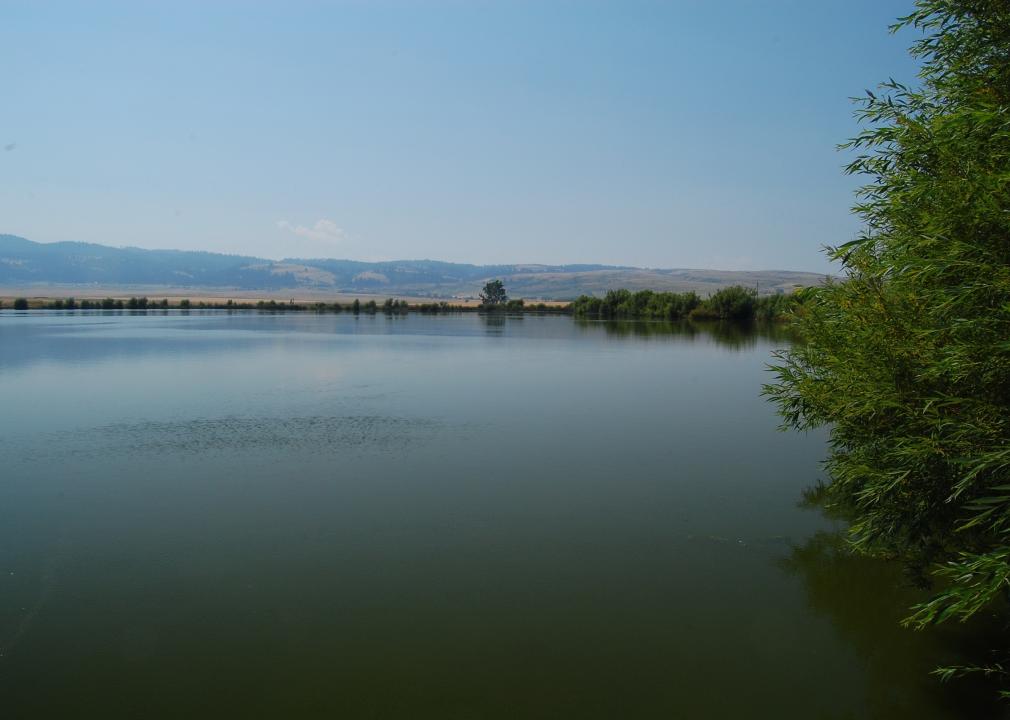
United States Department of Agriculture // Wikimedia Commons
#1. Owyhee County
– Index: 0.353
– Total population: 11,552
– White: 79.1% (9,139)
– Black or African American: 0.5% (61)
– American Indian and Alaska Native: 3.2% (372)
– Asian: 0.1% (13)
– Native Hawaiian and other Pacific Islander: 0.0% (0)
– 2 or more races: 3.4% (395)
– Some other Race: 13.6% (1,572)