Counties with the worst commutes in Idaho

Sundry Photography // Shutterstock
Counties with the worst commutes in Idaho
Commuting easily ranks as one of the least enjoyable parts of a person’s day. Commuters encounter more physical health problems, and low-income commuters are less likely to gain financial stability—among a host of other negative impacts. And yet, America’s commutes keep getting longer as people move farther away from the office, according to Census Bureau data.
Stacker compiled a list of counties with the worst commutes in Idaho, using 2021 data from the Census Bureau. Counties are ranked by longest average commute time in 2021 among workers over the age of 16, excluding those who work from home. Think you have a long trip to work? Read on to compare it against the worst commutes statewide.
![]()
Canva
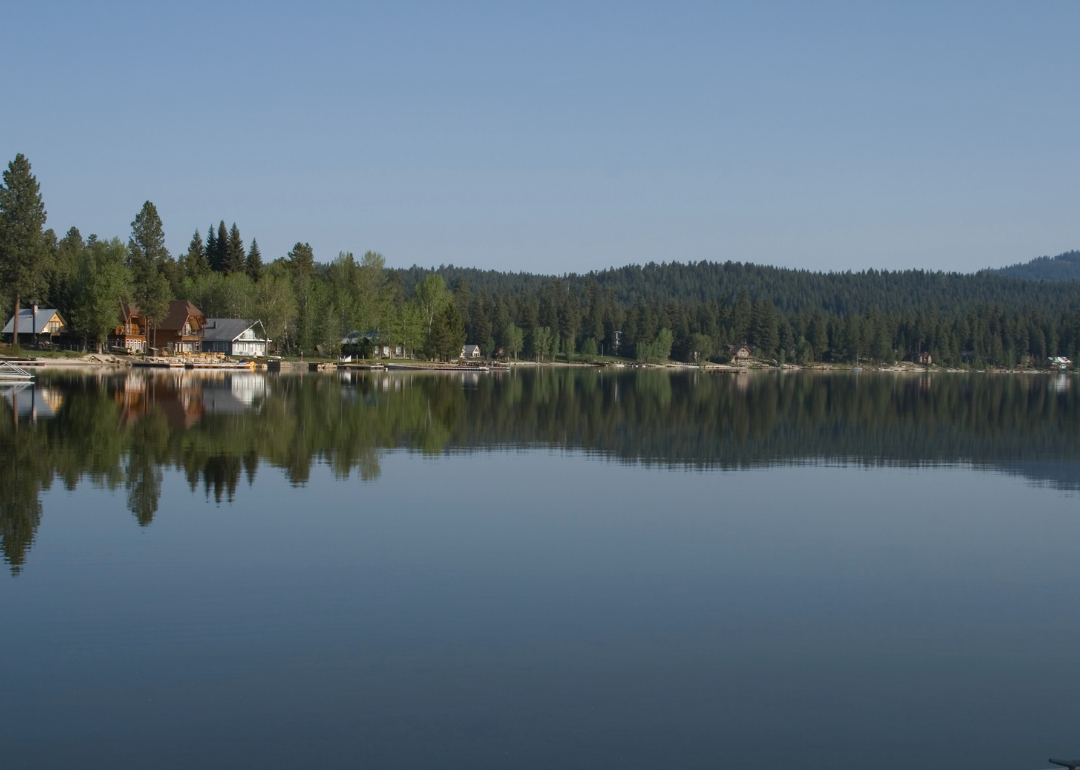
#44. Valley County
– Average commute to work: 11.4 minutes
– Share with commutes over an hour: 1.3%
– Share that worked outside their county of residence: 1.6%
– Means of transportation to work:
— Drove alone: 77.3%
— Carpooled: 2.4%
— Public transportation: 0.5%
— Walked: 1.5%
— Bicycle: 1.7%
— Taxicab, motorcycle, or other means: 0.7%
— Worked from home: 15.8%
Canva
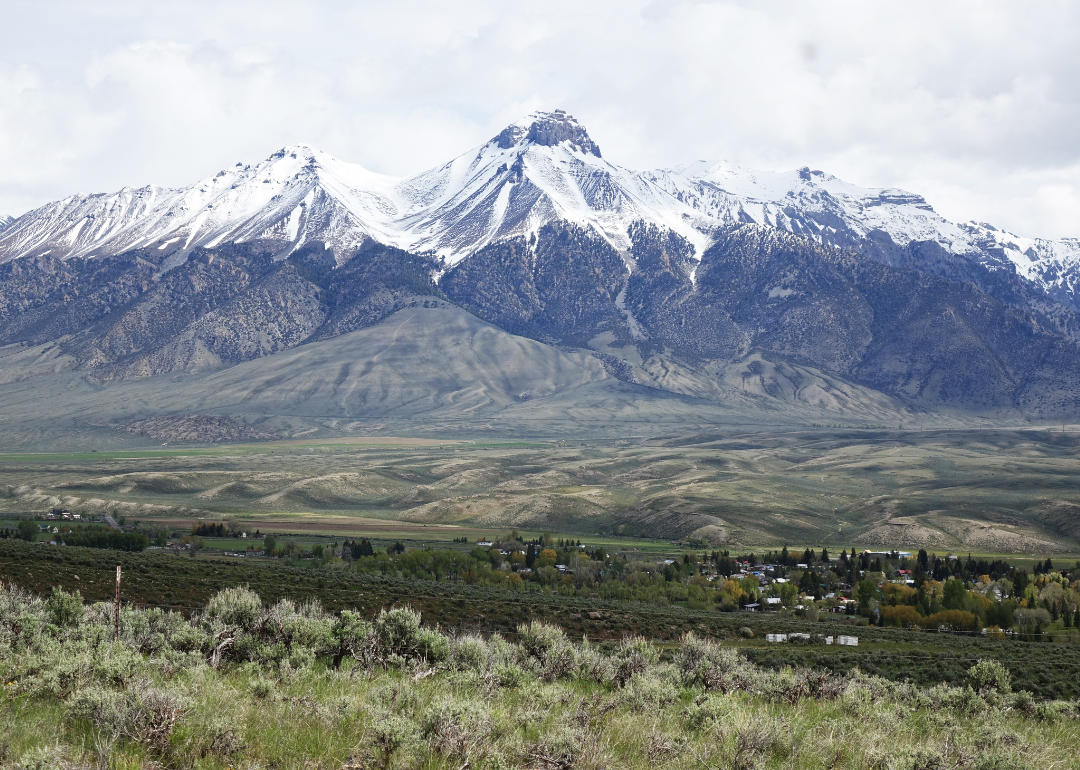
#43. Custer County
– Average commute to work: 14.7 minutes
– Share with commutes over an hour: 5.6%
– Share that worked outside their county of residence: 9.8%
– Means of transportation to work:
— Drove alone: 51.6%
— Carpooled: 9.2%
— Public transportation: 1.4%
— Walked: 6.5%
— Bicycle: 0.3%
— Taxicab, motorcycle, or other means: 2%
— Worked from home: 29%
Canva
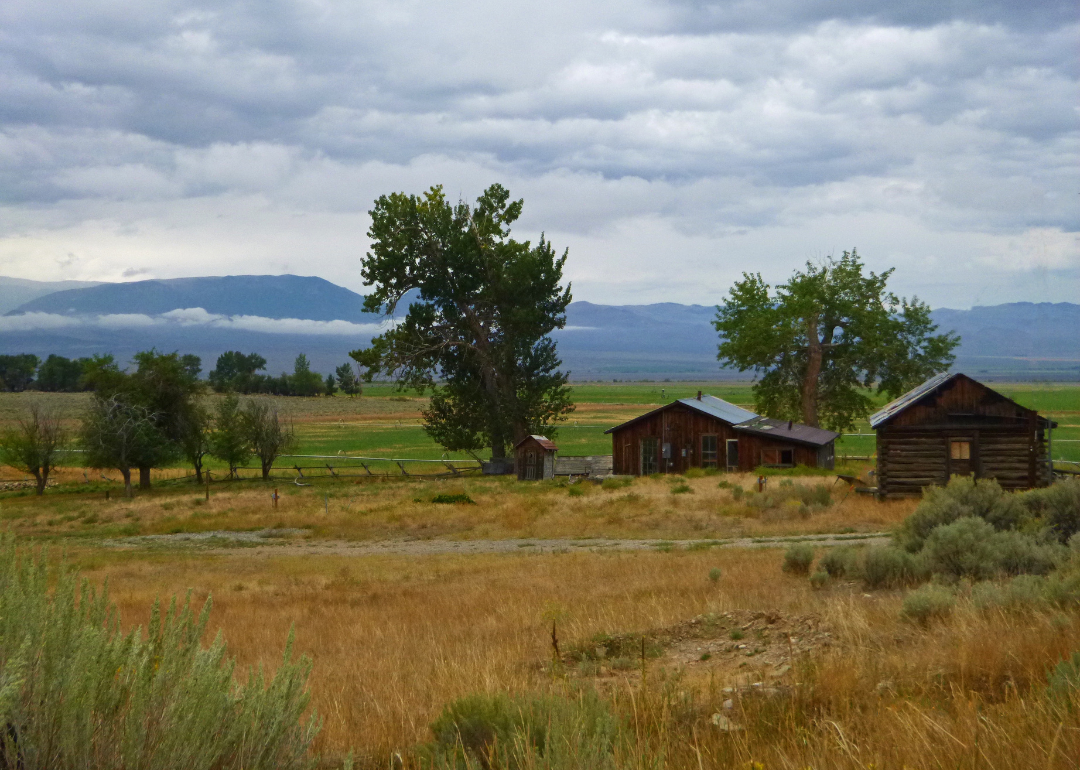
#42. Lemhi County
– Average commute to work: 15.1 minutes
– Share with commutes over an hour: 5%
– Share that worked outside their county of residence: 3.8%
– Means of transportation to work:
— Drove alone: 75.1%
— Carpooled: 12.3%
— Public transportation: 0%
— Walked: 5.5%
— Bicycle: 0%
— Taxicab, motorcycle, or other means: 0.3%
— Worked from home: 6.8%

Canva
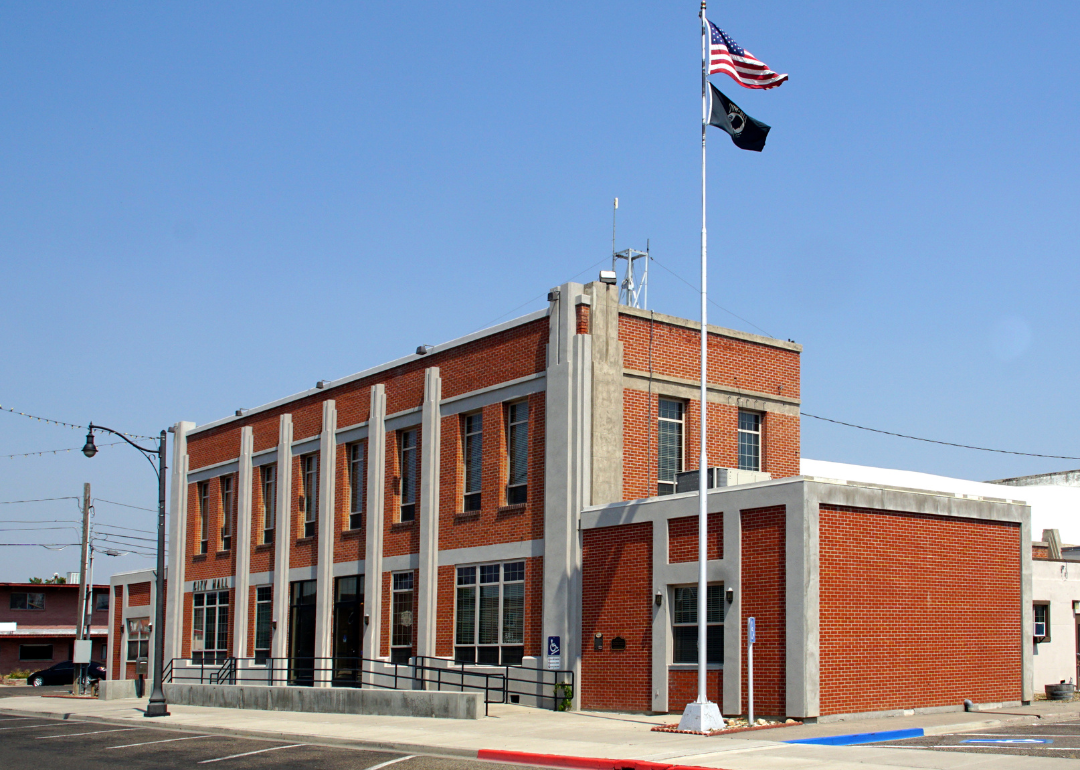
#41. Madison County
– Average commute to work: 15.3 minutes
– Share with commutes over an hour: 3.2%
– Share that worked outside their county of residence: 17.1%
– Means of transportation to work:
— Drove alone: 67.9%
— Carpooled: 16.3%
— Public transportation: 0.6%
— Walked: 5.3%
— Bicycle: 0.4%
— Taxicab, motorcycle, or other means: 0.2%
— Worked from home: 9.3%
Canva
#40. Minidoka County
– Average commute to work: 15.5 minutes
– Share with commutes over an hour: 1.6%
– Share that worked outside their county of residence: 37.9%
– Means of transportation to work:
— Drove alone: 81.3%
— Carpooled: 11.2%
— Public transportation: 0%
— Walked: 0.8%
— Bicycle: 0.2%
— Taxicab, motorcycle, or other means: 2%
— Worked from home: 4.4%

Canva
#39. Cassia County
– Average commute to work: 16 minutes
– Share with commutes over an hour: 2.9%
– Share that worked outside their county of residence: 26.3%
– Means of transportation to work:
— Drove alone: 81.2%
— Carpooled: 9%
— Public transportation: 0.4%
— Walked: 1.8%
— Bicycle: 0.1%
— Taxicab, motorcycle, or other means: 1.4%
— Worked from home: 6.1%
Canva
#38. Washington County
– Average commute to work: 17.1 minutes
– Share with commutes over an hour: 4.5%
– Share that worked outside their county of residence: 10.6%
– Means of transportation to work:
— Drove alone: 70.9%
— Carpooled: 11.5%
— Public transportation: 0.5%
— Walked: 5.1%
— Bicycle: 1.5%
— Taxicab, motorcycle, or other means: 2.5%
— Worked from home: 8%

Canva
#37. Power County
– Average commute to work: 17.2 minutes
– Share with commutes over an hour: 1%
– Share that worked outside their county of residence: 29.6%
– Means of transportation to work:
— Drove alone: 74.2%
— Carpooled: 10%
— Public transportation: 0%
— Walked: 6.1%
— Bicycle: 0%
— Taxicab, motorcycle, or other means: 0.7%
— Worked from home: 9%

Canva
#36. Nez Perce County
– Average commute to work: 17.3 minutes
– Share with commutes over an hour: 3.7%
– Share that worked outside their county of residence: 3.3%
– Means of transportation to work:
— Drove alone: 82.9%
— Carpooled: 6.7%
— Public transportation: 0.4%
— Walked: 3%
— Bicycle: 0.3%
— Taxicab, motorcycle, or other means: 1.2%
— Worked from home: 5.5%

Canva
#35. Blaine County
– Average commute to work: 17.7 minutes
– Share with commutes over an hour: 3.2%
– Share that worked outside their county of residence: 2.6%
– Means of transportation to work:
— Drove alone: 70.5%
— Carpooled: 6.9%
— Public transportation: 2%
— Walked: 1.9%
— Bicycle: 3.4%
— Taxicab, motorcycle, or other means: 1.4%
— Worked from home: 14%
Canva
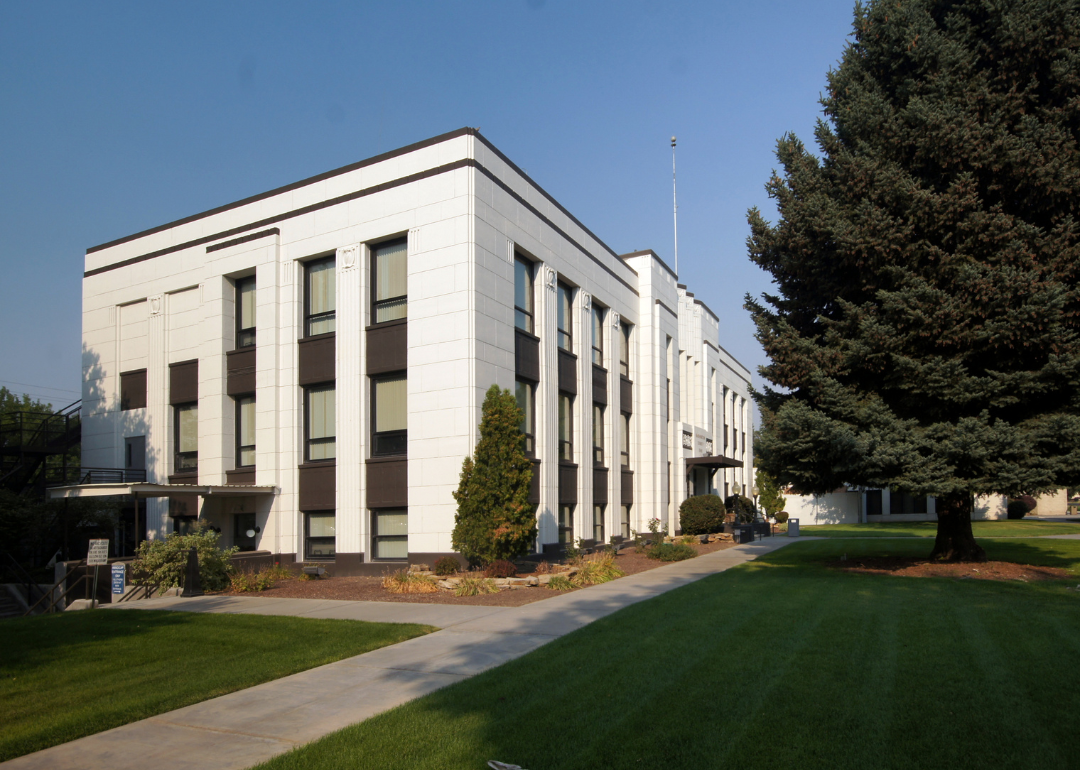
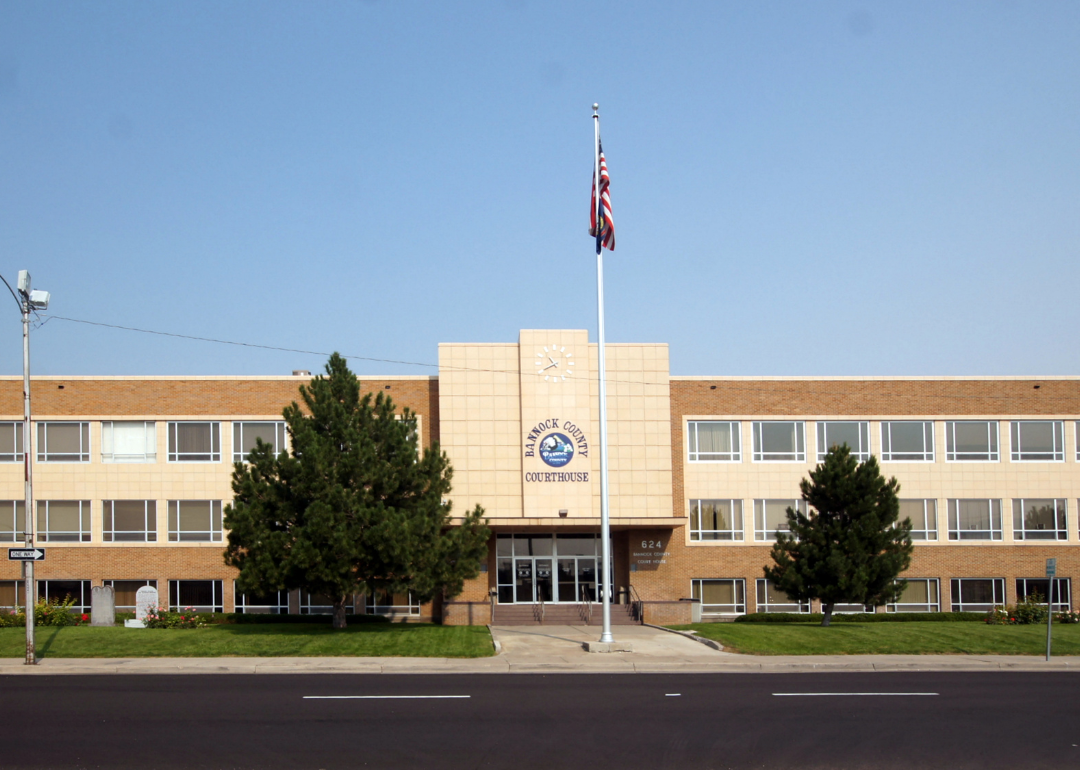
#34. Bannock County
– Average commute to work: 18.2 minutes
– Share with commutes over an hour: 5.3%
– Share that worked outside their county of residence: 12%
– Means of transportation to work:
— Drove alone: 76.8%
— Carpooled: 9.8%
— Public transportation: 1.1%
— Walked: 2.6%
— Bicycle: 0.6%
— Taxicab, motorcycle, or other means: 0.8%
— Worked from home: 8.3%

Canva
#33. Idaho County
– Average commute to work: 18.5 minutes
– Share with commutes over an hour: 8.7%
– Share that worked outside their county of residence: 18.9%
– Means of transportation to work:
— Drove alone: 72.1%
— Carpooled: 12.6%
— Public transportation: 0.2%
— Walked: 6%
— Bicycle: 0.3%
— Taxicab, motorcycle, or other means: 1.9%
— Worked from home: 6.9%

Canva
#32. Twin Falls County
– Average commute to work: 18.9 minutes
– Share with commutes over an hour: 4.2%
– Share that worked outside their county of residence: 12.6%
– Means of transportation to work:
— Drove alone: 82.2%
— Carpooled: 8.2%
— Public transportation: 0.2%
— Walked: 1.4%
— Bicycle: 0.1%
— Taxicab, motorcycle, or other means: 0.9%
— Worked from home: 7.1%

Canva
#31. Caribou County
– Average commute to work: 19 minutes
– Share with commutes over an hour: 8.5%
– Share that worked outside their county of residence: 9.4%
– Means of transportation to work:
— Drove alone: 78.4%
— Carpooled: 14.9%
— Public transportation: 0%
— Walked: 1.7%
— Bicycle: 0.2%
— Taxicab, motorcycle, or other means: 1.3%
— Worked from home: 3.5%

Canva
#29. Jerome County (tie)
– Average commute to work: 19.2 minutes
– Share with commutes over an hour: 3.5%
– Share that worked outside their county of residence: 37%
– Means of transportation to work:
— Drove alone: 80.2%
— Carpooled: 13%
— Public transportation: 0.3%
— Walked: 1.5%
— Bicycle: 0%
— Taxicab, motorcycle, or other means: 0.3%
— Worked from home: 4.7%

Danita Delimont // Shutterstock
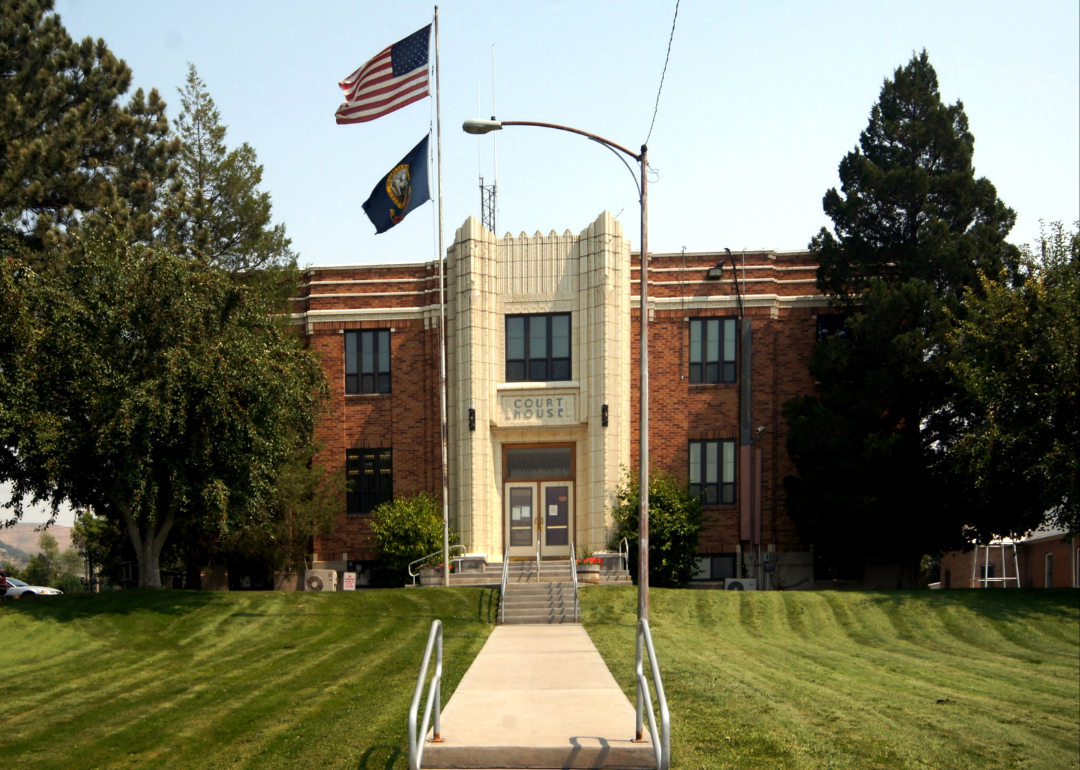
#29. Latah County (tie)
– Average commute to work: 19.2 minutes
– Share with commutes over an hour: 4.7%
– Share that worked outside their county of residence: 6.6%
– Means of transportation to work:
— Drove alone: 66.1%
— Carpooled: 11.2%
— Public transportation: 0.7%
— Walked: 11.3%
— Bicycle: 1.4%
— Taxicab, motorcycle, or other means: 1.6%
— Worked from home: 7.7%

davidrh // Shutterstock
#28. Butte County
– Average commute to work: 19.8 minutes
– Share with commutes over an hour: 6.1%
– Share that worked outside their county of residence: 15.5%
– Means of transportation to work:
— Drove alone: 66.3%
— Carpooled: 10.9%
— Public transportation: 1.3%
— Walked: 4.2%
— Bicycle: 1.2%
— Taxicab, motorcycle, or other means: 1.3%
— Worked from home: 14.7%

Canva
#26. Bonneville County (tie)
– Average commute to work: 20.1 minutes
– Share with commutes over an hour: 7.3%
– Share that worked outside their county of residence: 11%
– Means of transportation to work:
— Drove alone: 77.5%
— Carpooled: 9.7%
— Public transportation: 2.2%
— Walked: 1.5%
— Bicycle: 0.3%
— Taxicab, motorcycle, or other means: 1.2%
— Worked from home: 7.6%
Canva
#26. Payette County (tie)
– Average commute to work: 20.1 minutes
– Share with commutes over an hour: 5.2%
– Share that worked outside their county of residence: 18.9%
– Means of transportation to work:
— Drove alone: 84.8%
— Carpooled: 8.3%
— Public transportation: 0%
— Walked: 2.5%
— Bicycle: 0.3%
— Taxicab, motorcycle, or other means: 0.9%
— Worked from home: 3.2%

jfergusonphotos // Shutterstock
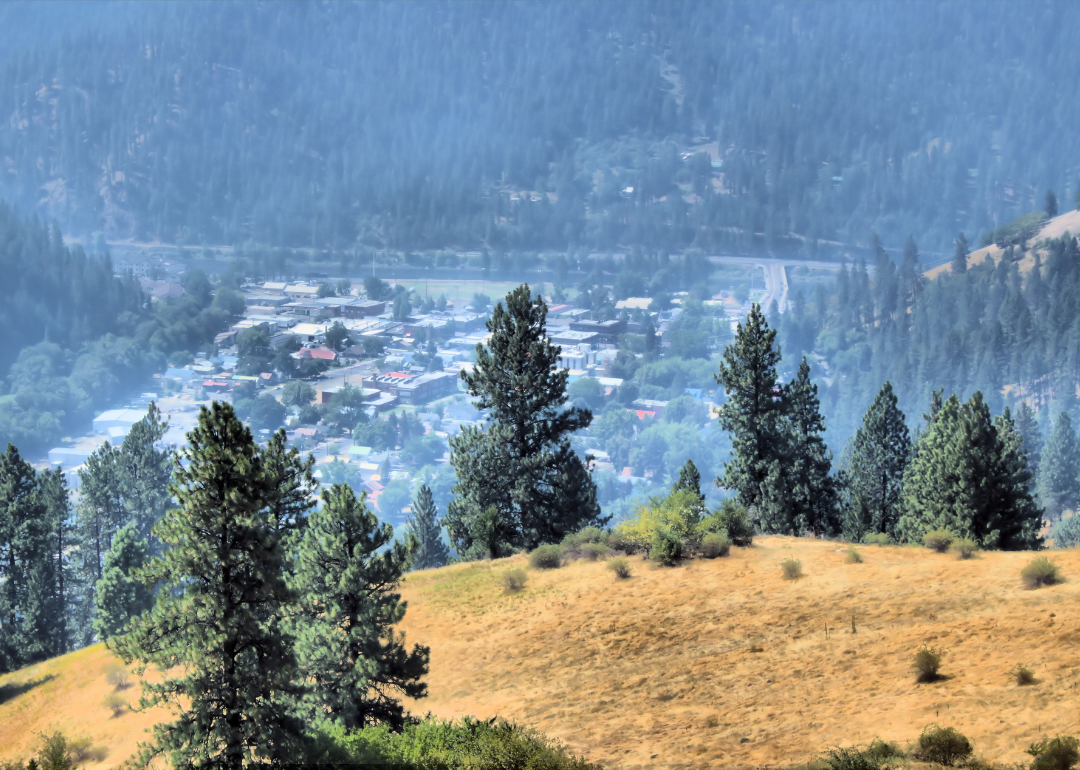
#25. Shoshone County
– Average commute to work: 20.3 minutes
– Share with commutes over an hour: 9.1%
– Share that worked outside their county of residence: 16.1%
– Means of transportation to work:
— Drove alone: 77.6%
— Carpooled: 10.7%
— Public transportation: 1%
— Walked: 5.2%
— Bicycle: 0.3%
— Taxicab, motorcycle, or other means: 1.5%
— Worked from home: 3.7%

Charles Knowles // Shutterstock
#24. Ada County
– Average commute to work: 21 minutes
– Share with commutes over an hour: 2.6%
– Share that worked outside their county of residence: 6.8%
– Means of transportation to work:
— Drove alone: 76.1%
— Carpooled: 6.8%
— Public transportation: 0.3%
— Walked: 2%
— Bicycle: 1.5%
— Taxicab, motorcycle, or other means: 1.3%
— Worked from home: 12.1%
melissamn // Shutterstock
#23. Lewis County
– Average commute to work: 21.4 minutes
– Share with commutes over an hour: 10.1%
– Share that worked outside their county of residence: 36.9%
– Means of transportation to work:
— Drove alone: 73.1%
— Carpooled: 12.5%
— Public transportation: 0.4%
— Walked: 6%
— Bicycle: 0.4%
— Taxicab, motorcycle, or other means: 0.6%
— Worked from home: 7.1%
Canva
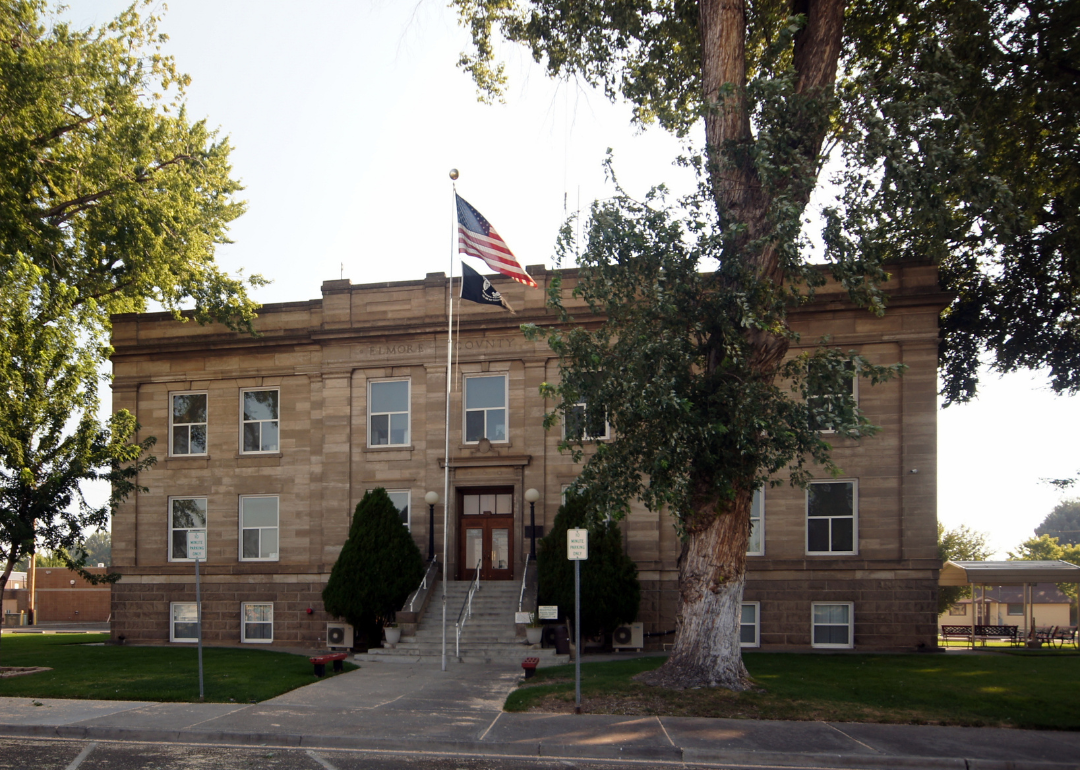
#22. Elmore County
– Average commute to work: 21.6 minutes
– Share with commutes over an hour: 8%
– Share that worked outside their county of residence: 14.9%
– Means of transportation to work:
— Drove alone: 81.7%
— Carpooled: 11.4%
— Public transportation: 0.6%
— Walked: 2.6%
— Bicycle: 0%
— Taxicab, motorcycle, or other means: 1.3%
— Worked from home: 2.3%

Canva
#21. Kootenai County
– Average commute to work: 22.1 minutes
– Share with commutes over an hour: 4.9%
– Share that worked outside their county of residence: 2.5%
– Means of transportation to work:
— Drove alone: 79.2%
— Carpooled: 8.4%
— Public transportation: 0.6%
— Walked: 1.2%
— Bicycle: 0.4%
— Taxicab, motorcycle, or other means: 0.6%
— Worked from home: 9.5%

Canva
#20. Gooding County
– Average commute to work: 22.2 minutes
– Share with commutes over an hour: 4.3%
– Share that worked outside their county of residence: 34.5%
– Means of transportation to work:
— Drove alone: 76.8%
— Carpooled: 9.2%
— Public transportation: 0.3%
— Walked: 3.3%
— Bicycle: 0%
— Taxicab, motorcycle, or other means: 1.9%
— Worked from home: 8.5%

Norm Lane // Shutterstock
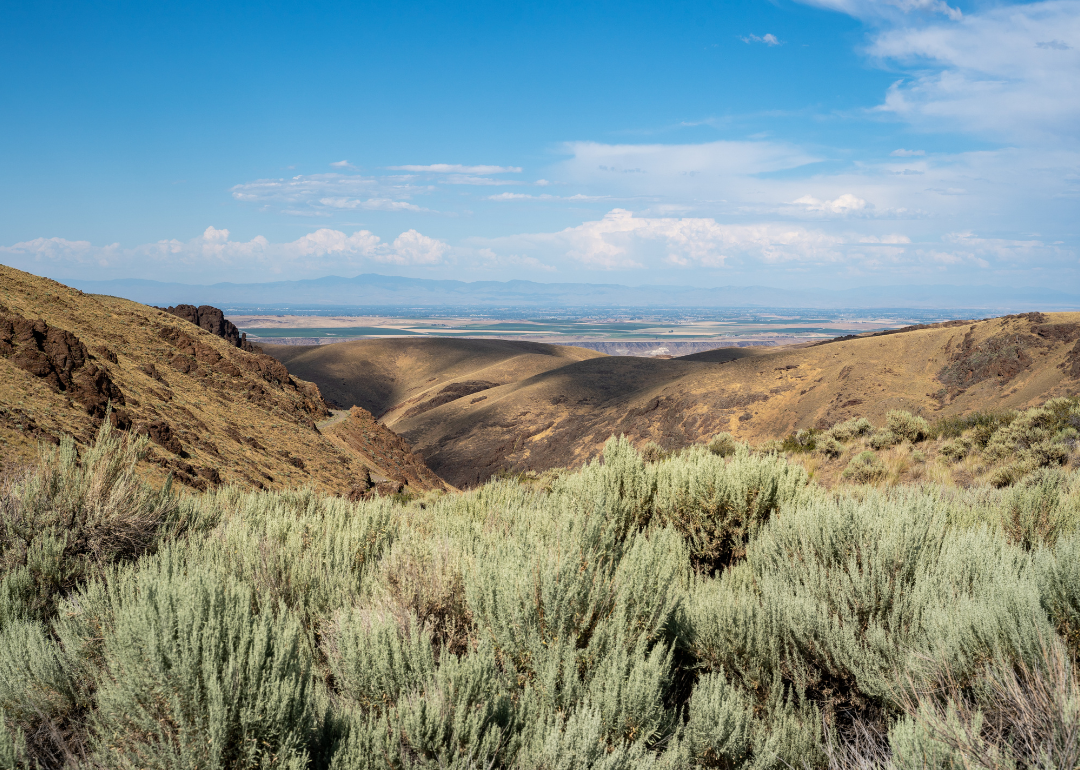
#19. Benewah County
– Average commute to work: 22.4 minutes
– Share with commutes over an hour: 10.5%
– Share that worked outside their county of residence: 21%
– Means of transportation to work:
— Drove alone: 78.9%
— Carpooled: 9.5%
— Public transportation: 0.7%
— Walked: 3.4%
— Bicycle: 0.1%
— Taxicab, motorcycle, or other means: 1.5%
— Worked from home: 6%
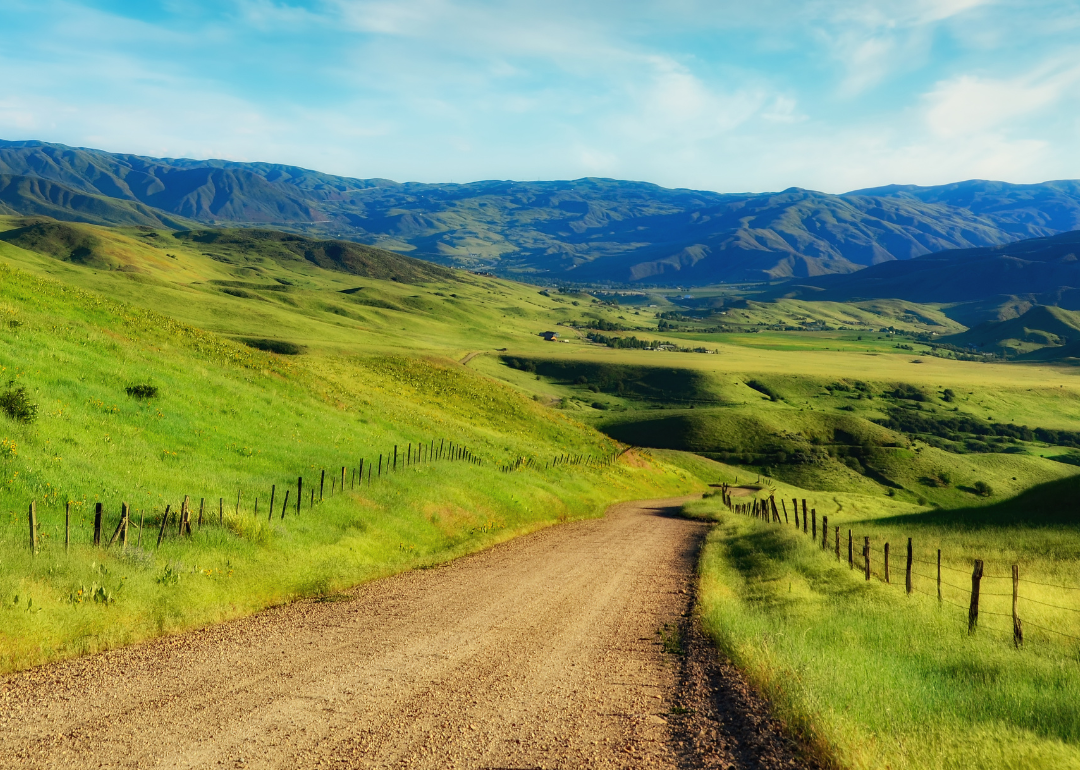
Tucker James // Shutterstock
#18. Bingham County
– Average commute to work: 22.9 minutes
– Share with commutes over an hour: 4.6%
– Share that worked outside their county of residence: 36.3%
– Means of transportation to work:
— Drove alone: 77.5%
— Carpooled: 12.6%
— Public transportation: 2.1%
— Walked: 1.1%
— Bicycle: 0%
— Taxicab, motorcycle, or other means: 0.9%
— Worked from home: 5.8%

B Brown // Shutterstock
#17. Jefferson County
– Average commute to work: 23.2 minutes
– Share with commutes over an hour: 6.3%
– Share that worked outside their county of residence: 52.1%
– Means of transportation to work:
— Drove alone: 77.9%
— Carpooled: 9.6%
— Public transportation: 2.3%
— Walked: 1.7%
— Bicycle: 0.1%
— Taxicab, motorcycle, or other means: 1.3%
— Worked from home: 7.2%

Canva
#16. Bonner County
– Average commute to work: 24.1 minutes
– Share with commutes over an hour: 8.2%
– Share that worked outside their county of residence: 11.1%
– Means of transportation to work:
— Drove alone: 76.6%
— Carpooled: 8.3%
— Public transportation: 1.1%
— Walked: 2.7%
— Bicycle: 2%
— Taxicab, motorcycle, or other means: 0.9%
— Worked from home: 8.4%
Canva
#15. Fremont County
– Average commute to work: 24.3 minutes
– Share with commutes over an hour: 11%
– Share that worked outside their county of residence: 40.2%
– Means of transportation to work:
— Drove alone: 76.7%
— Carpooled: 9.6%
— Public transportation: 0.4%
— Walked: 2.7%
— Bicycle: 0%
— Taxicab, motorcycle, or other means: 1.5%
— Worked from home: 9.1%
Canva
#14. Adams County
– Average commute to work: 24.5 minutes
– Share with commutes over an hour: 11%
– Share that worked outside their county of residence: 40.6%
– Means of transportation to work:
— Drove alone: 68.6%
— Carpooled: 11.3%
— Public transportation: 0%
— Walked: 1.5%
— Bicycle: 0%
— Taxicab, motorcycle, or other means: 0.3%
— Worked from home: 18.3%

Canva
#13. Boundary County
– Average commute to work: 24.8 minutes
– Share with commutes over an hour: 9.2%
– Share that worked outside their county of residence: 9.9%
– Means of transportation to work:
— Drove alone: 76.1%
— Carpooled: 11.2%
— Public transportation: 0.4%
— Walked: 3.8%
— Bicycle: 1%
— Taxicab, motorcycle, or other means: 0%
— Worked from home: 7.5%

Canva
#12. Canyon County
– Average commute to work: 25.2 minutes
– Share with commutes over an hour: 4.3%
– Share that worked outside their county of residence: 34.6%
– Means of transportation to work:
— Drove alone: 77.6%
— Carpooled: 10.1%
— Public transportation: 0.2%
— Walked: 1.5%
— Bicycle: 0.4%
— Taxicab, motorcycle, or other means: 1.5%
— Worked from home: 8.6%

Canva
#10. Franklin County (tie)
– Average commute to work: 25.9 minutes
– Share with commutes over an hour: 7.9%
– Share that worked outside their county of residence: 1.5%
– Means of transportation to work:
— Drove alone: 78.6%
— Carpooled: 10.1%
— Public transportation: 0.2%
— Walked: 2%
— Bicycle: 0.2%
— Taxicab, motorcycle, or other means: 0.3%
— Worked from home: 8.6%
Canva
#10. Oneida County (tie)
– Average commute to work: 25.9 minutes
– Share with commutes over an hour: 17.9%
– Share that worked outside their county of residence: 5.5%
– Means of transportation to work:
— Drove alone: 77.4%
— Carpooled: 10.9%
— Public transportation: 0%
— Walked: 0.4%
— Bicycle: 0%
— Taxicab, motorcycle, or other means: 0%
— Worked from home: 11.3%
Canva
#9. Clearwater County
– Average commute to work: 26.1 minutes
– Share with commutes over an hour: 17.1%
– Share that worked outside their county of residence: 12.6%
– Means of transportation to work:
— Drove alone: 75.3%
— Carpooled: 10.1%
— Public transportation: 0.2%
— Walked: 3.5%
— Bicycle: 0.2%
— Taxicab, motorcycle, or other means: 2.7%
— Worked from home: 8.1%
Canva
#8. Owyhee County
– Average commute to work: 26.7 minutes
– Share with commutes over an hour: 12.5%
– Share that worked outside their county of residence: 54.8%
– Means of transportation to work:
— Drove alone: 73.9%
— Carpooled: 11.5%
— Public transportation: 0.4%
— Walked: 3.4%
— Bicycle: 0%
— Taxicab, motorcycle, or other means: 0.6%
— Worked from home: 10.3%

Canva
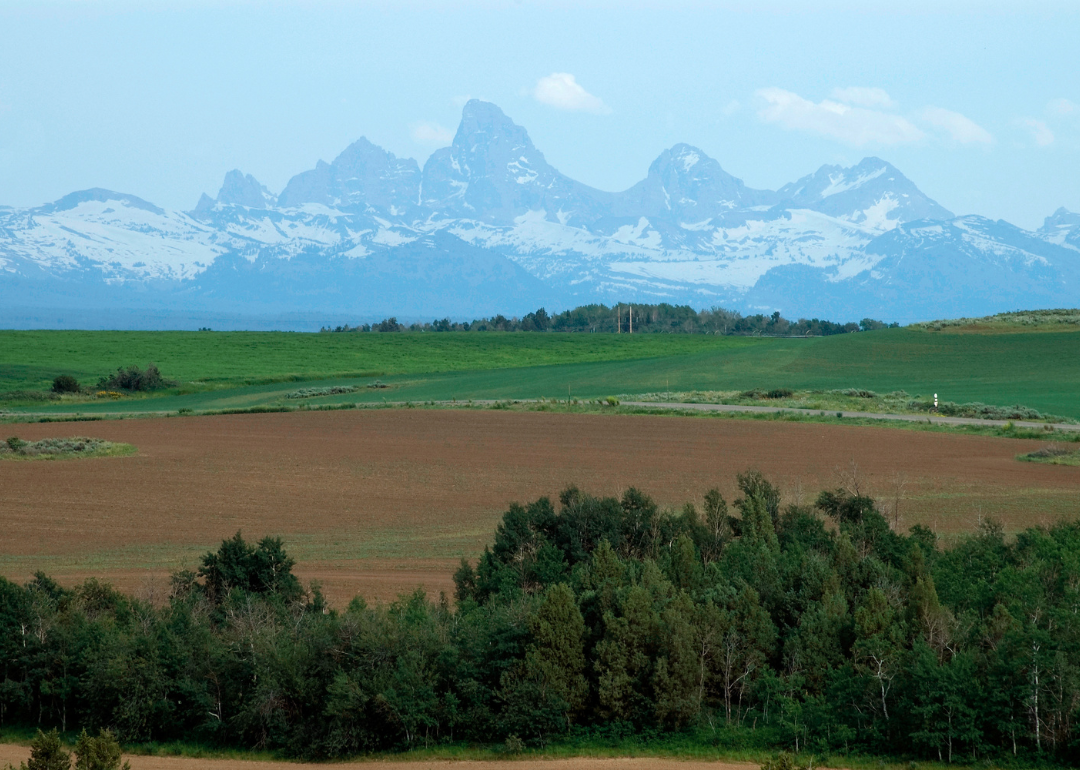
#7. Teton County
– Average commute to work: 28.2 minutes
– Share with commutes over an hour: 10.9%
– Share that worked outside their county of residence: 3.7%
– Means of transportation to work:
— Drove alone: 68.4%
— Carpooled: 13.7%
— Public transportation: 2.1%
— Walked: 3.5%
— Bicycle: 0.5%
— Taxicab, motorcycle, or other means: 0.4%
— Worked from home: 11.4%

Canva
#5. Bear Lake County (tie)
– Average commute to work: 29.4 minutes
– Share with commutes over an hour: 16.4%
– Share that worked outside their county of residence: 22.1%
– Means of transportation to work:
— Drove alone: 75.1%
— Carpooled: 12.4%
— Public transportation: 0.7%
— Walked: 2.7%
— Bicycle: 0.2%
— Taxicab, motorcycle, or other means: 0.5%
— Worked from home: 8.4%

MKStyle // Shutterstock
#5. Gem County (tie)
– Average commute to work: 29.4 minutes
– Share with commutes over an hour: 12.9%
– Share that worked outside their county of residence: 41.6%
– Means of transportation to work:
— Drove alone: 76.9%
— Carpooled: 11.3%
— Public transportation: 0.2%
— Walked: 0.6%
— Bicycle: 0.3%
— Taxicab, motorcycle, or other means: 0.7%
— Worked from home: 9.9%

David Gilder // Shutterstock
#4. Clark County
– Average commute to work: 30.4 minutes
– Share with commutes over an hour: 17.1%
– Share that worked outside their county of residence: 34.9%
– Means of transportation to work:
— Drove alone: 65.1%
— Carpooled: 19.5%
— Public transportation: 0%
— Walked: 4.5%
— Bicycle: 0%
— Taxicab, motorcycle, or other means: 0%
— Worked from home: 10.9%

Canva
#3. Lincoln County
– Average commute to work: 32.6 minutes
– Share with commutes over an hour: 21.7%
– Share that worked outside their county of residence: 51.2%
– Means of transportation to work:
— Drove alone: 75%
— Carpooled: 16.4%
— Public transportation: 2%
— Walked: 1.9%
— Bicycle: 0.5%
— Taxicab, motorcycle, or other means: 0.1%
— Worked from home: 4.1%

Canva
#2. Camas County
– Average commute to work: 35.2 minutes
– Share with commutes over an hour: 23.2%
– Share that worked outside their county of residence: 53.4%
– Means of transportation to work:
— Drove alone: 70.2%
— Carpooled: 12.1%
— Public transportation: 0%
— Walked: 0.3%
— Bicycle: 0%
— Taxicab, motorcycle, or other means: 0.5%
— Worked from home: 16.9%
Canva
#1. Boise County
– Average commute to work: 35.3 minutes
– Share with commutes over an hour: 17.9%
– Share that worked outside their county of residence: 50.2%
– Means of transportation to work:
— Drove alone: 69.8%
— Carpooled: 11.4%
— Public transportation: 0%
— Walked: 5.3%
— Bicycle: 0.7%
— Taxicab, motorcycle, or other means: 0.2%
— Worked from home: 12.6%