How grocery purchasing power has changed in the U.S.

eldar nurkovic // Shutterstock
How grocery purchasing power has changed in the U.S.
A concerned looking couple looking at fruit in a supermarket
If you’re feeling like grocery prices have inched up seemingly overnight, you’re not alone. The last time grocery costs spiked this much was in 1980, when the U.S. was coming off more than a decade of rising prices in the wake of higher government borrowing and spending spurred by World War II and the Vietnam War.
Today, few seem to agree on what’s behind rapid inflationary growth. Some business leaders, politicians and economists link increasing wages, while others say pandemic stimulus checks issued to consumers and businesses play a big part. Then there’s Russia’s war with Ukraine, major supply chain disruptions and record corporate profits. Time will tell which may be the driving factor.
For now, nearly everyone can agree that the result is the same: rising costs are hitting Americans’ wallets. An estimated 93% of U.S. adults surveyed said the prices of goods in their metro area increased over the last two months, according to the Census Bureau’s Oct. 5 Household Pulse Survey. The same survey found that 83% of adults said they’re somewhat or very concerned about additional price increases over the next six months—an understandable reaction for anyone who has walked past a grocery store shelf recently.
Food at home, the term used by statistical agencies to describe grocery items purchased to eat at home, rose in price by 11.2% year over year in September 2022, according to the Bureau of Labor Statistics (BLS). The BLS gathers information about the prices of goods by sending researchers to visit retail stores in major metro areas and report the prices of commonly purchased items, including eggs, coffee, and meats.
Experian created a hypothetical basket of commonly purchased food items to illustrate how the affordability of essential foods has shifted in recent years for the American consumer. This analysis uses price data from the BLS, wage data from the Census Bureau, and news reports on inflation. Continue reading to learn how food price inflation is hitting home across the country.
![]()

DGLimages // Shutterstock
A typical weekly grocery basket
An elderly person having a bag of groceries delivered
This basket of groceries costs $72 in 2022 and includes:
- 3 pounds of bananas
- 5 pounds of oranges
- 5 pounds of tomatoes
- 2 loaves bread
- 4 pounds of chicken
- 12 eggs
- 3 pounds of ground beef
- 5 pounds of potatoes
- 1 pound of coffee grounds
- 2 gallons of milk
The basket items reflect a subjective selection of common weekly grocery items for a small household. Chosen from among food items and prices tracked by the BLS, the groceries were assigned an average price that was calculated by dollars per pound, with the total basket cost adding up to 5% of median household income.
Experian
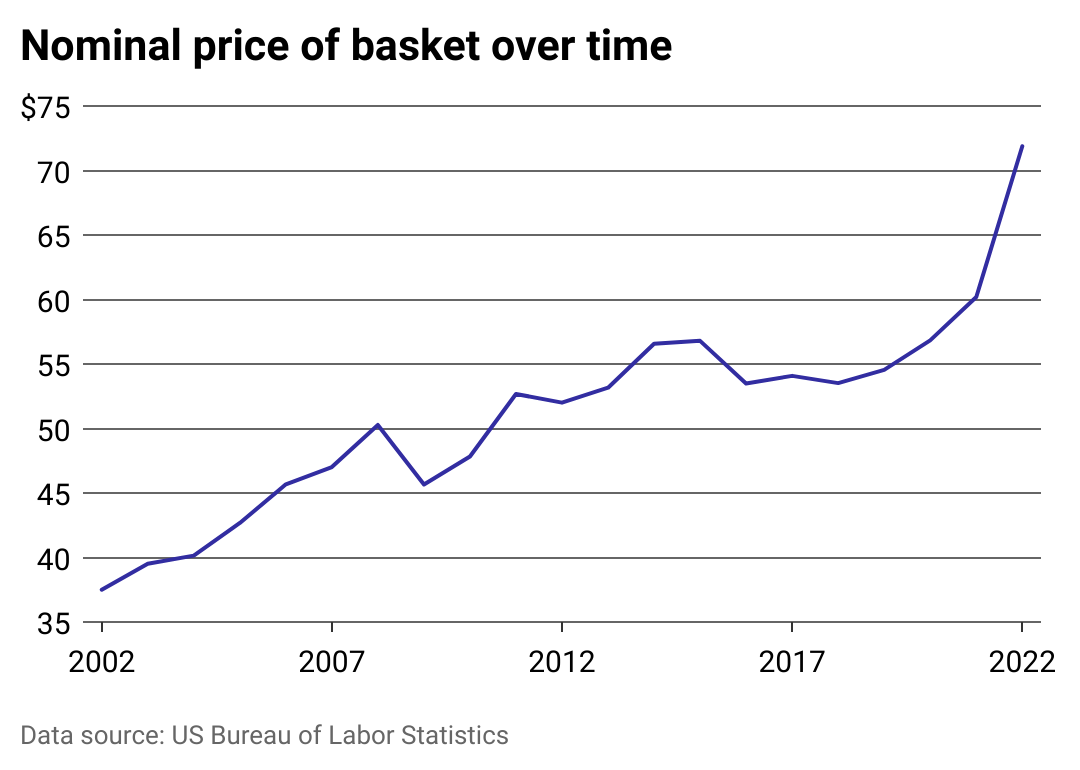
Food costs have spiked since the pandemic
Chart showing the price of a typical basket over time
The same basket of food items that cost $72 in 2022 would have rung up to about $60 in 2002 (in today’s dollars). A shopper could add more food into the hypothetical basket than they could today, reflecting a stronger purchasing power 20 years ago.
In 2003, the Labor Department recorded a 40-year low in inflation for consumers. This year, the inflation rate for consumers reached a 40-year high. As Americans grapple with rising costs for goods, some are cutting back or even borrowing money to fund purchases of necessities like food.
Experian
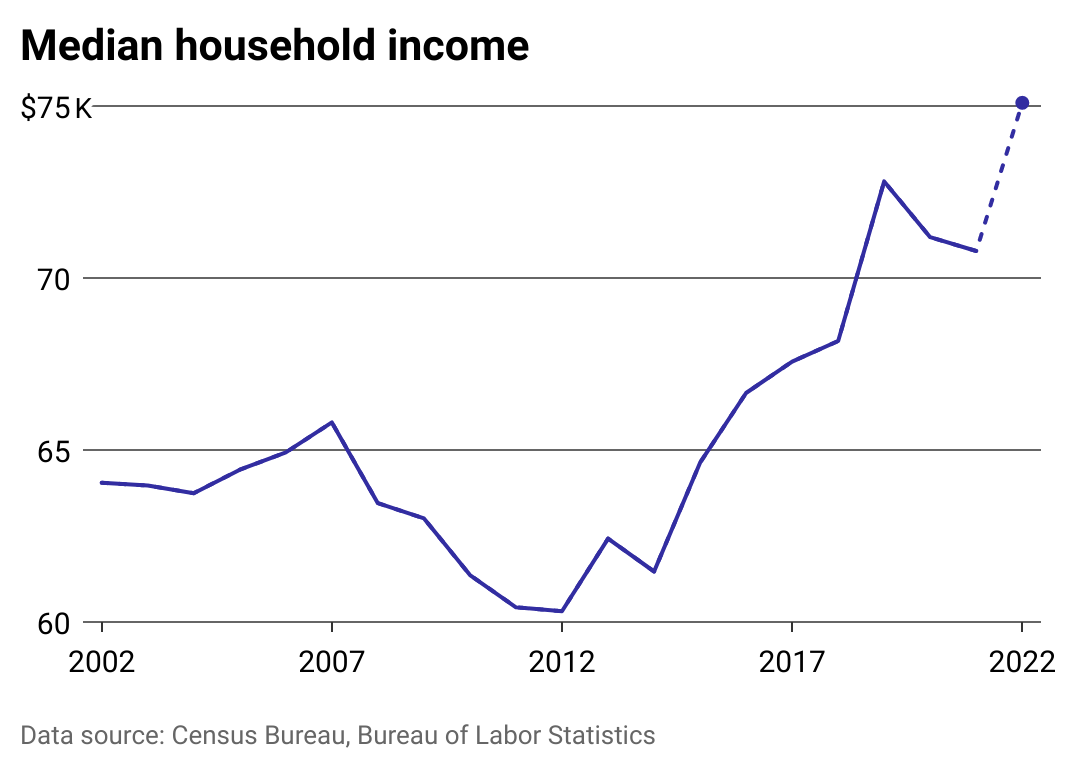
Median income dipped in 2021—but experts predict a rise
Chart showing median wage dipping slightly in 2021, with a projected rise in 2022.
The median income for American households took a big hit when the country entered the Great Recession, beginning its fall in 2008 and requiring almost an entire decade to return to pre-recession levels.
Americans’ annual median household income changed at a statistically insignificant level from 2020 to 2021—before accounting for stimulus payments in the first year of the COVID-19 pandemic, according to the Census Bureau.
The median household’s earnings declined from $71,186 in 2020 to $70,784 in 2021, according to the most recent Census household income estimate. The 2022 median household income is estimated to rise to $75,000 for 2022. Using quarter-over-quarter wage data from Q3 2022, this estimate calculates the rate of change from the prior year to determine a projection for 2022 median household income.
Experian
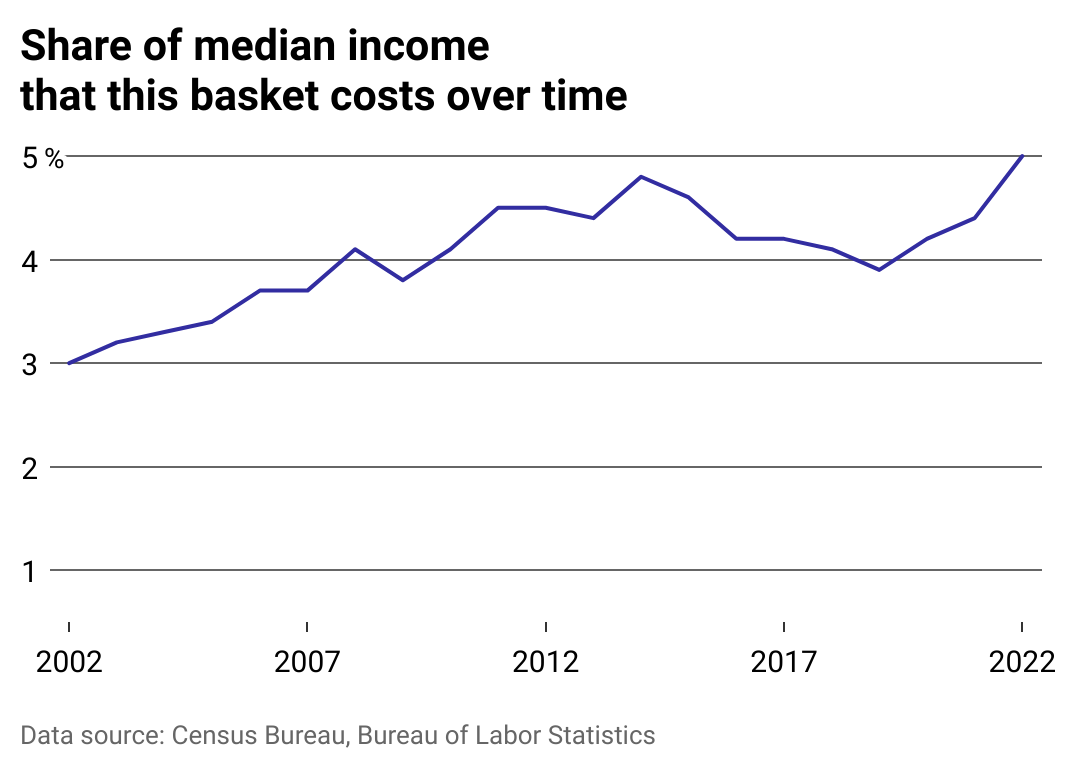
Grocery purchasing power for American consumers declines
A line chart showing how grocery purchasing power has declined.
Americans spent more than 14% of their pretax income on food in the 1960s, but since the turn of the millennium, that spending has hovered around 10%. That typically splits into about 5% going toward eating out and 5% for groceries consumed at home, according to the USDA.
A consumer earning the median weekly income who spends 5% of their income on groceries to eat home would have only had to spend 3% on the same basket of groceries in 2002 dollars.
Americans spent far more of their earnings on food decades ago, but that percentage has declined as U.S. agriculture became more productive by introducing new technologies.
This story originally appeared on Experian and was produced and
distributed in partnership with Stacker Studio.